Einstein QLA: Its all relative!
Average marks for your class or department are compared to all the other pinpoint schools
who have uploaded for this test.
Average marks for your class or department are compared to all the other pinpoint schools
who have uploaded for this test.
| Question | Topic | AO Strand | Max Mark | SetA Average per mark | Pinpoint Average | Average Difference |
|---|---|---|---|---|---|---|
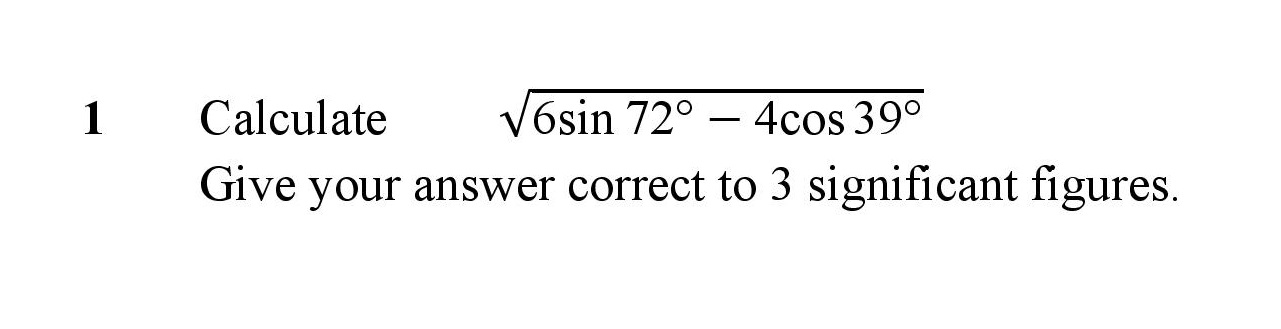
| Using a Calculator | 1 | 2 | 0.5 | 0.87 | -0.37 | |
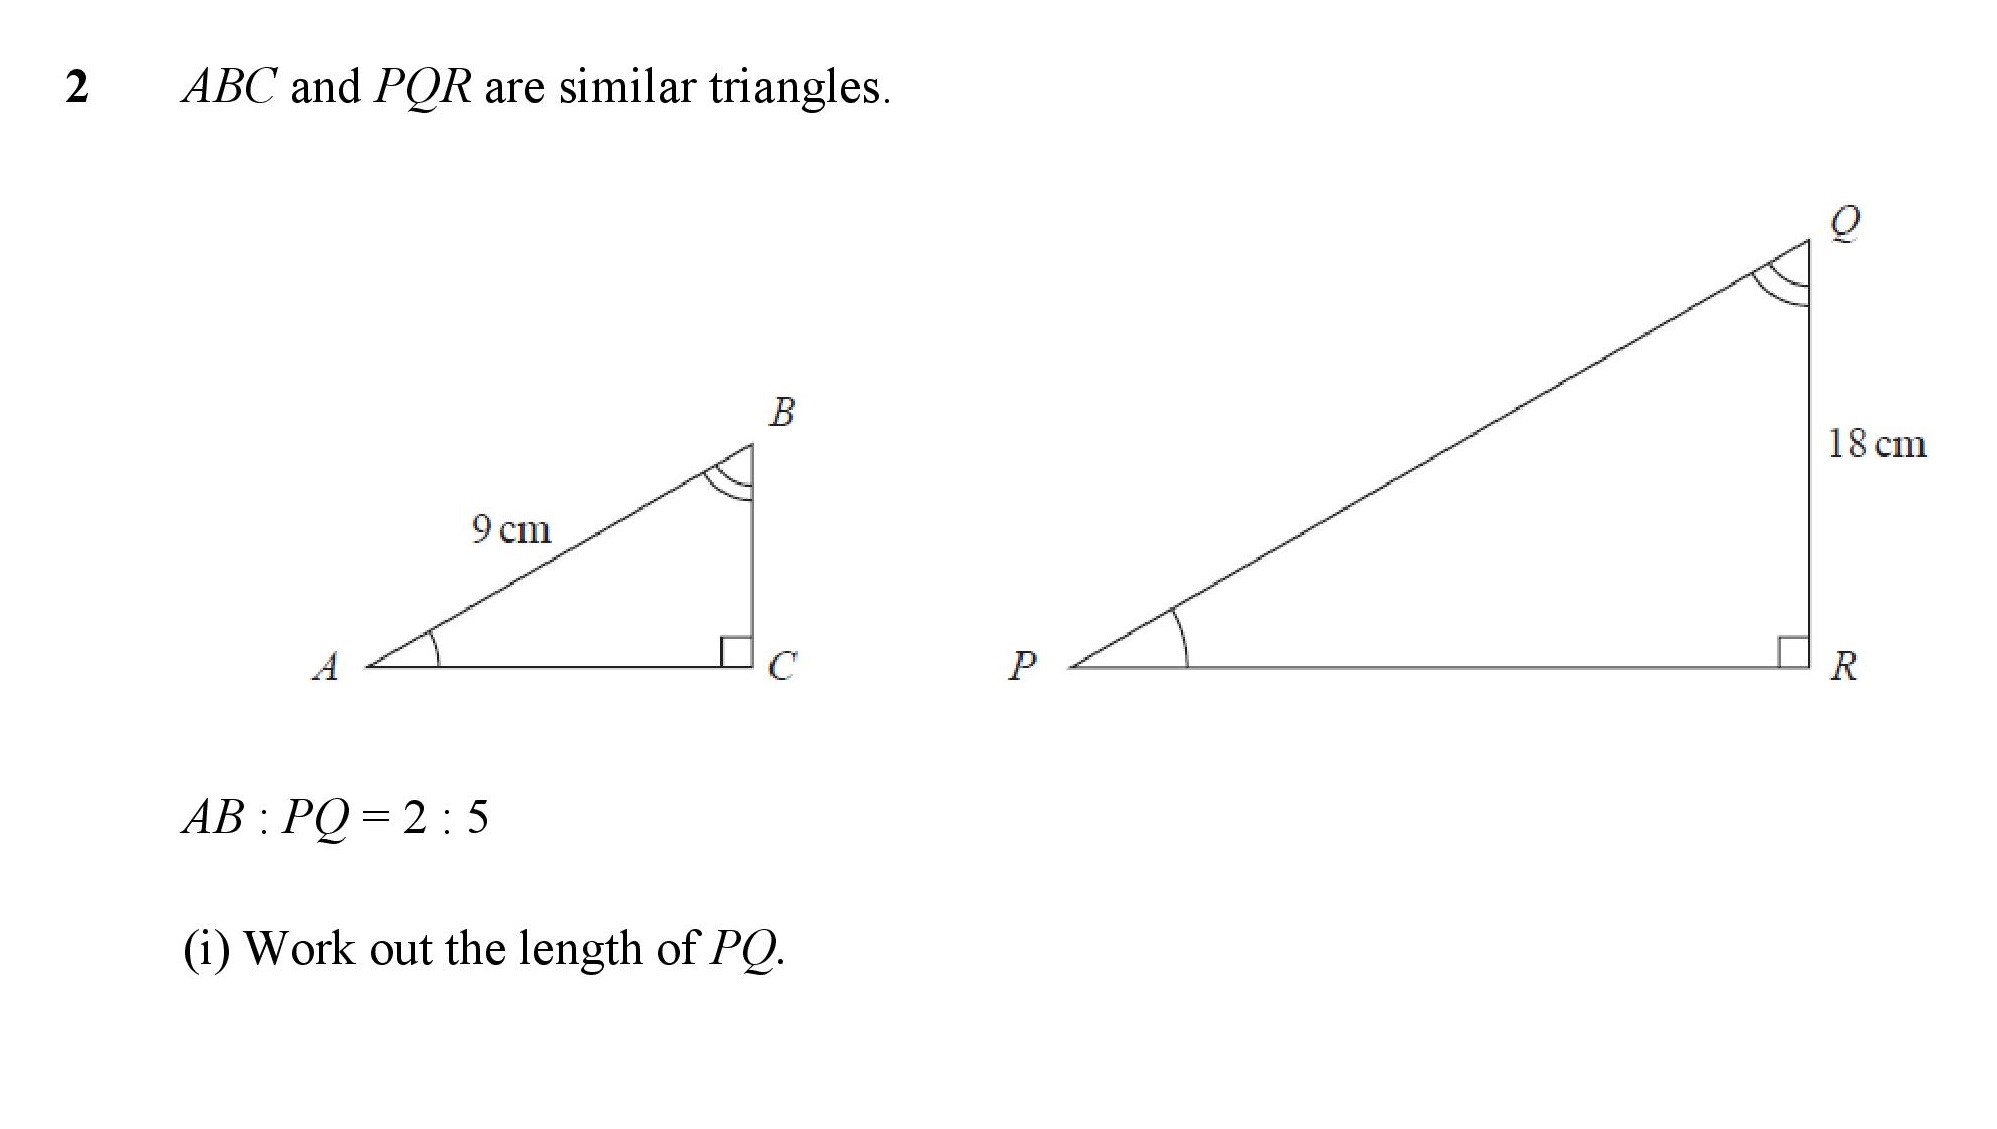
| Similar Shapes and Ratio | 1 | 2 | 0.25 | 0.77 | -0.52 | |
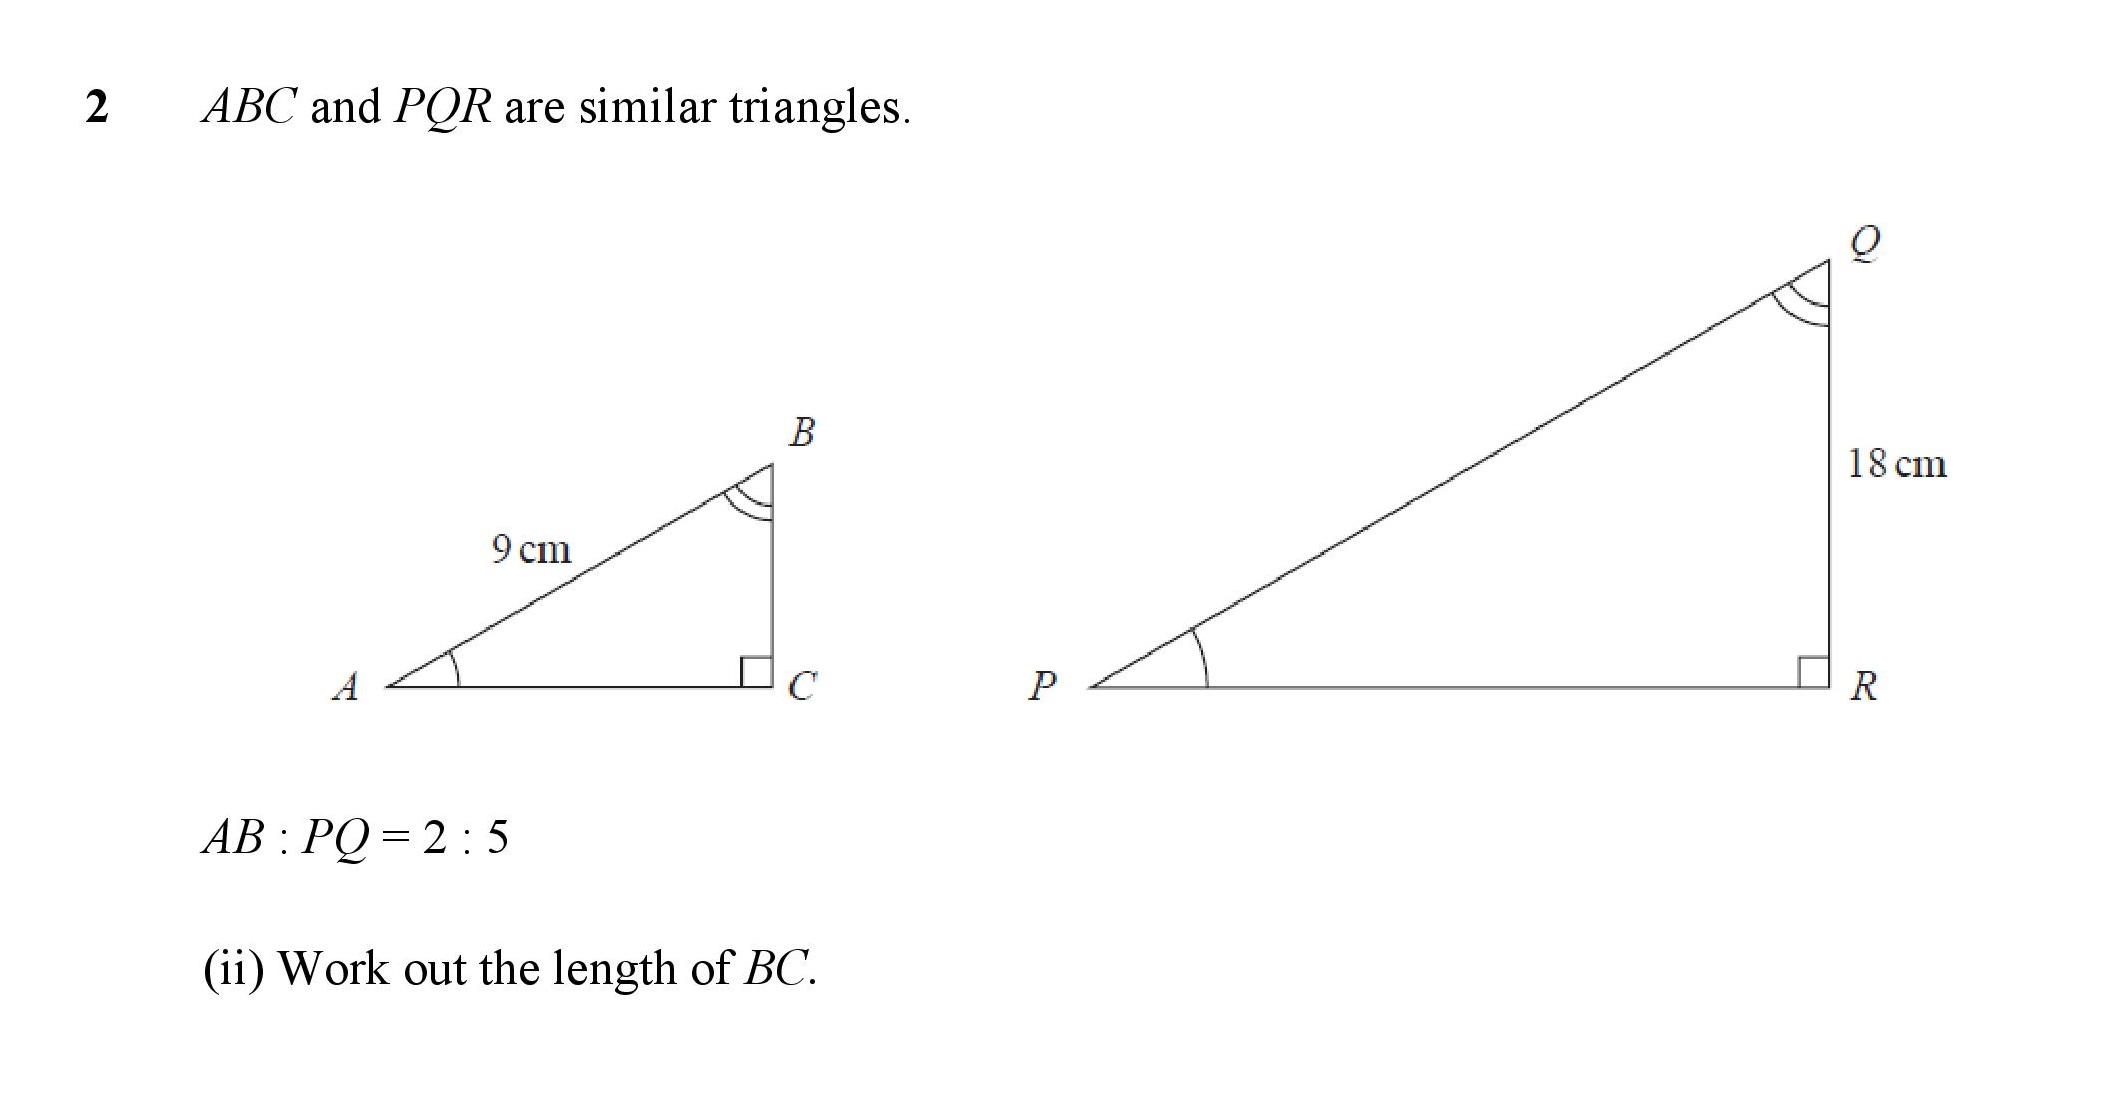
| Similar Shapes to linear scale factors only | 1 | 2 | 0.5 | 0.6 | -0.1 | |
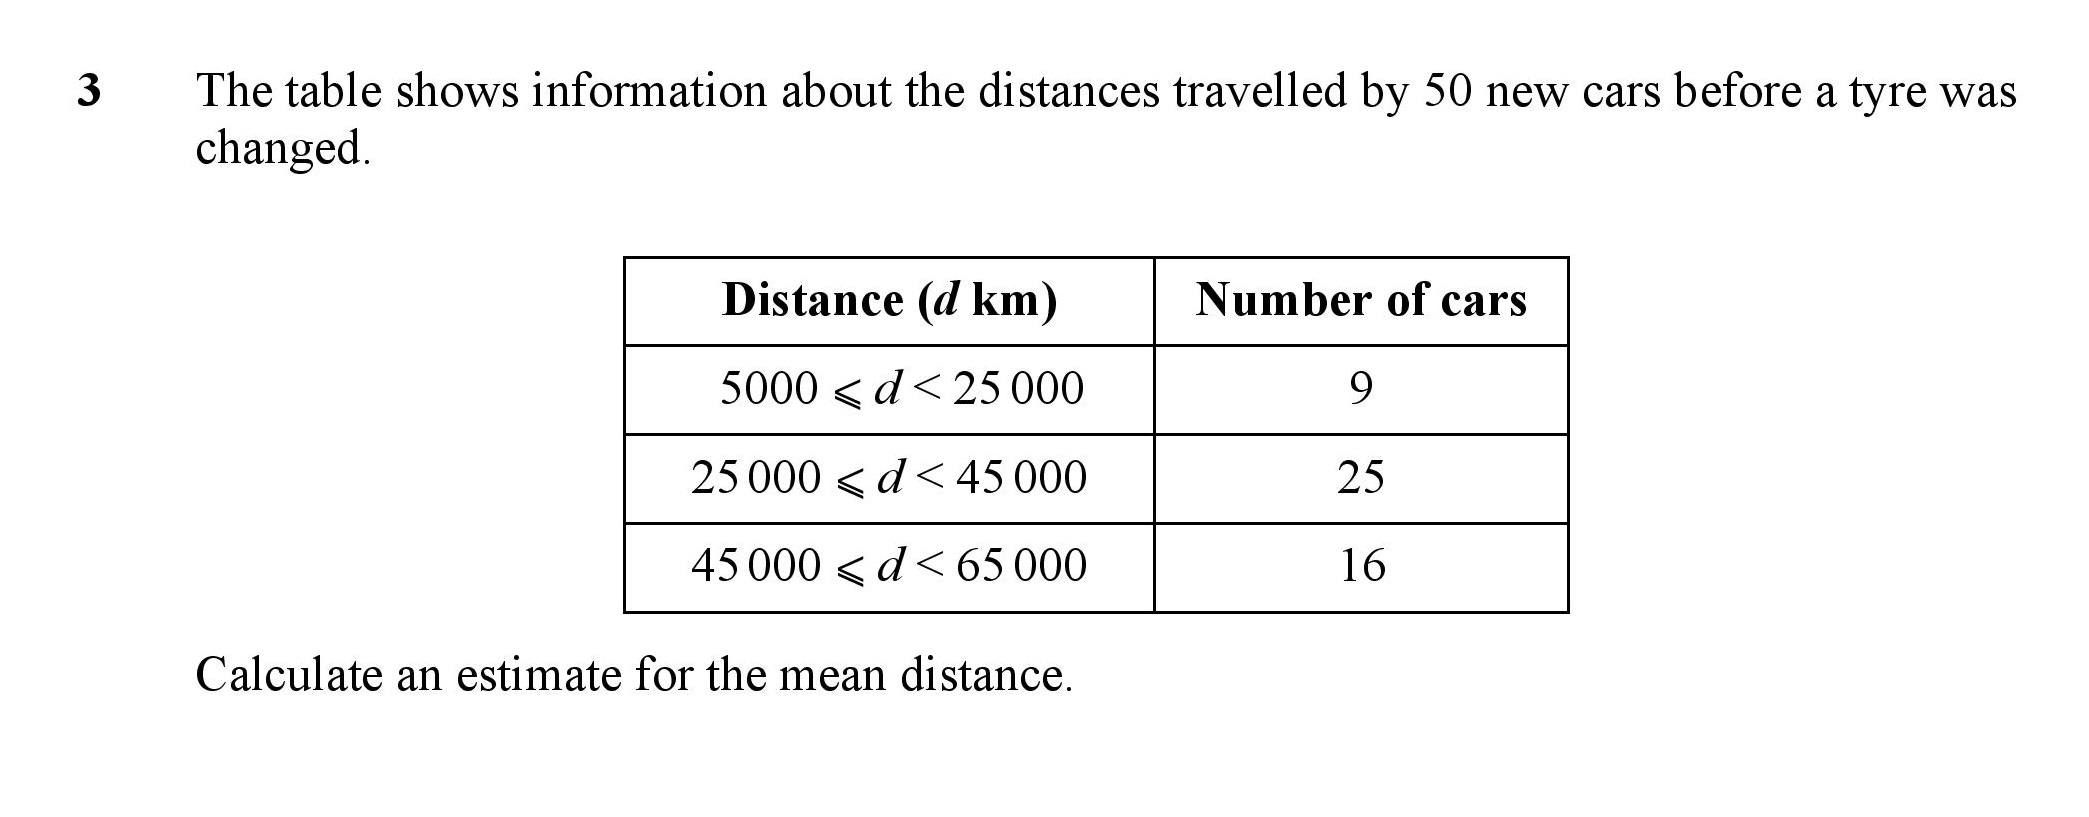
| Averages from Frequency Tables | 1 | 3 | 0.17 | 0.39 | -0.22 | |
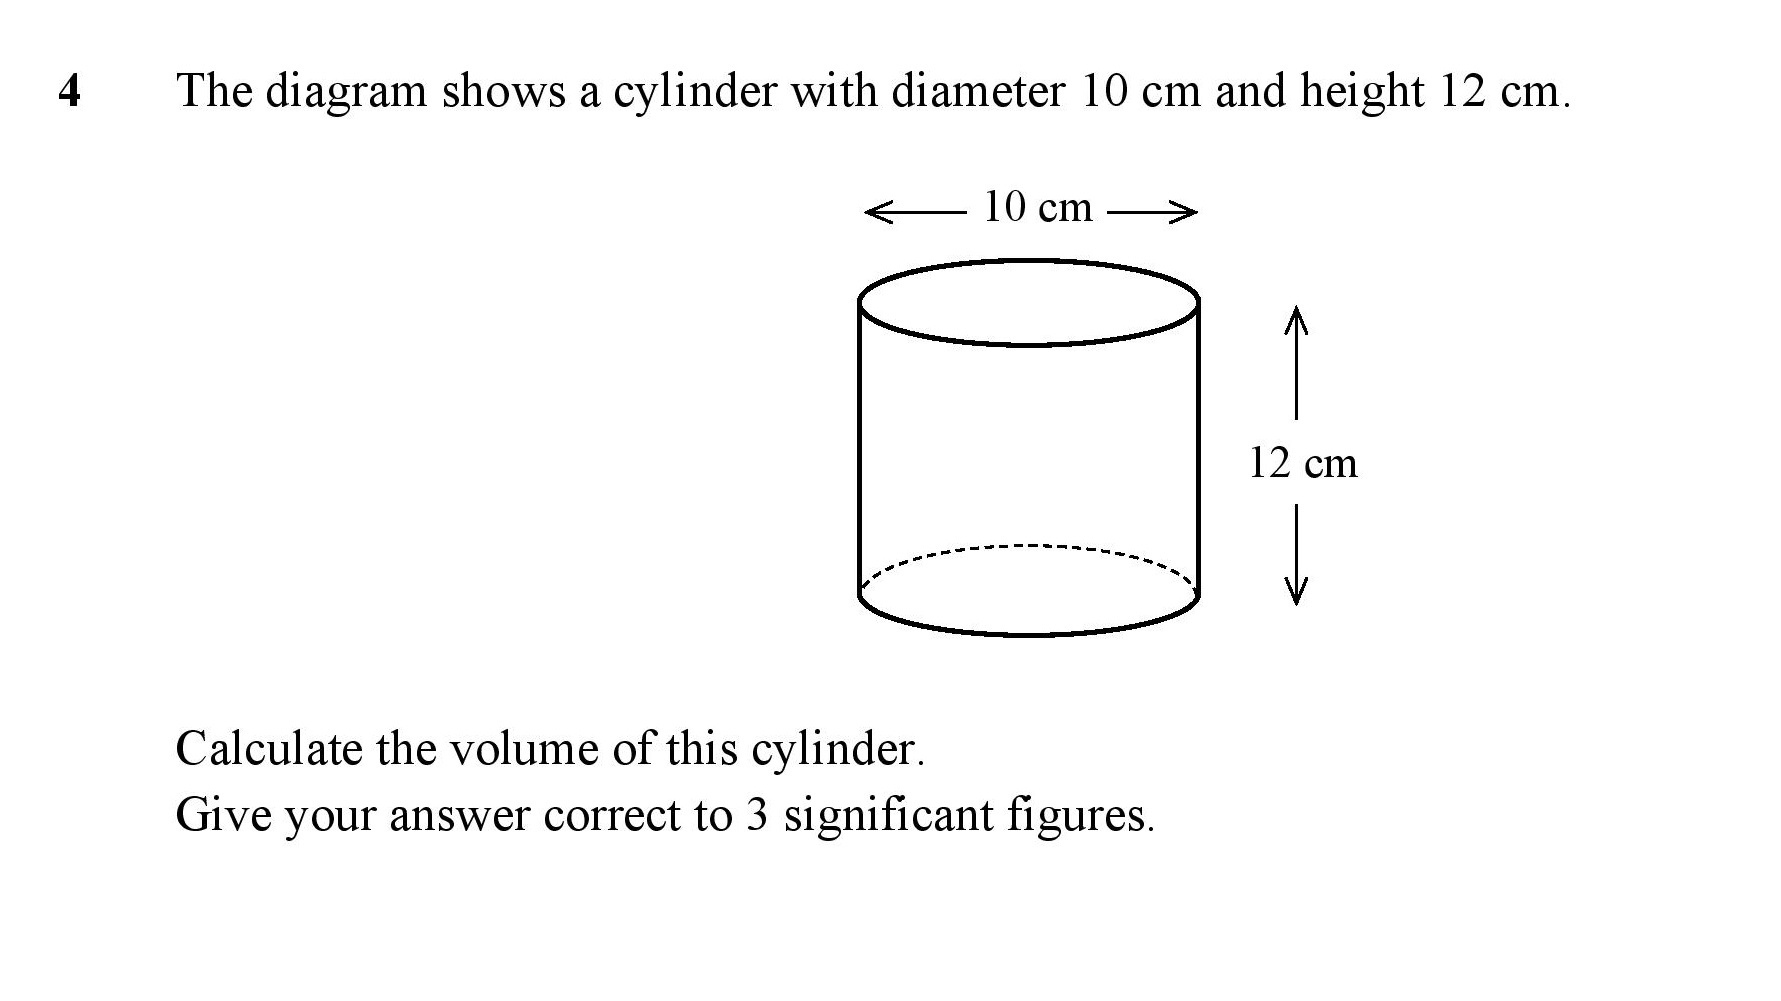
| Volume and Surface Area of a Cylinder | 1 | 2 | 0.5 | 0.54 | -0.04 | |
| Simple and Compound Interest | 2 | 4 | 0.25 | 0.54 | -0.29 | |
| Simple Bounds | 1 | 2 | 0.75 | 0.7 | 0.05 | |
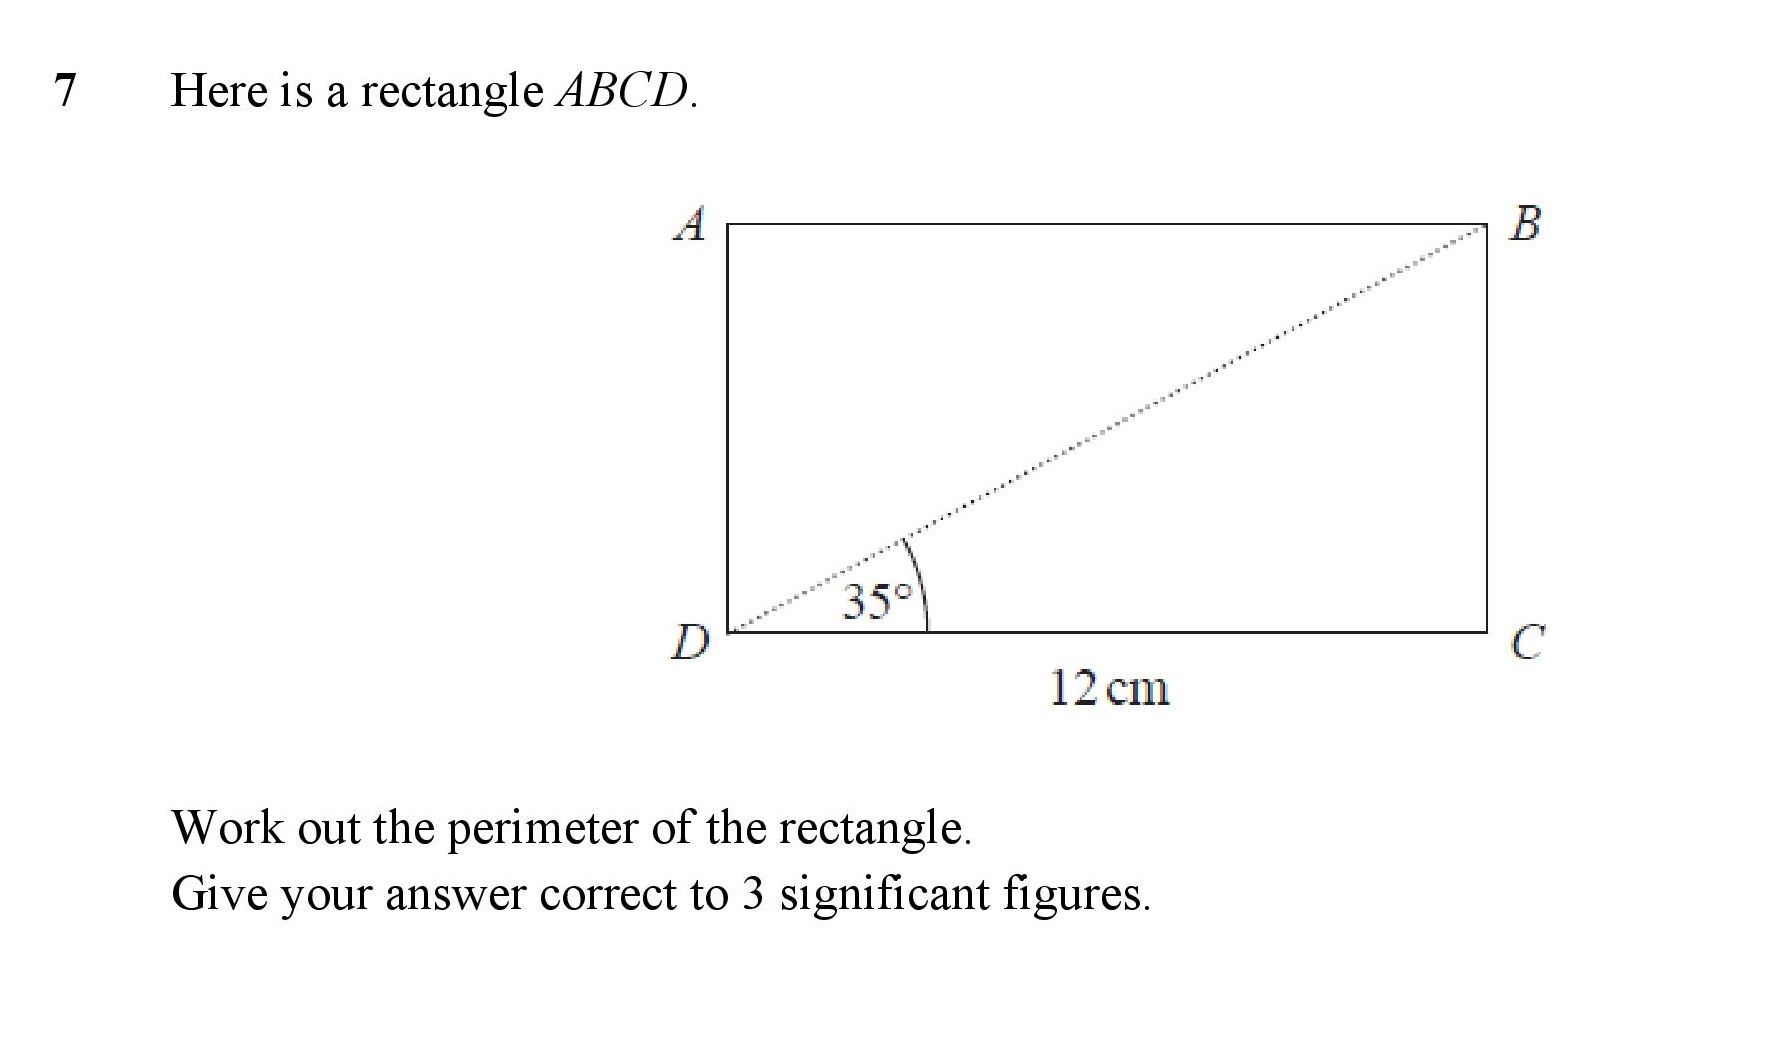
| Applied Trig Problems | 2 | 4 | 0.25 | 0.55 | -0.3 | |
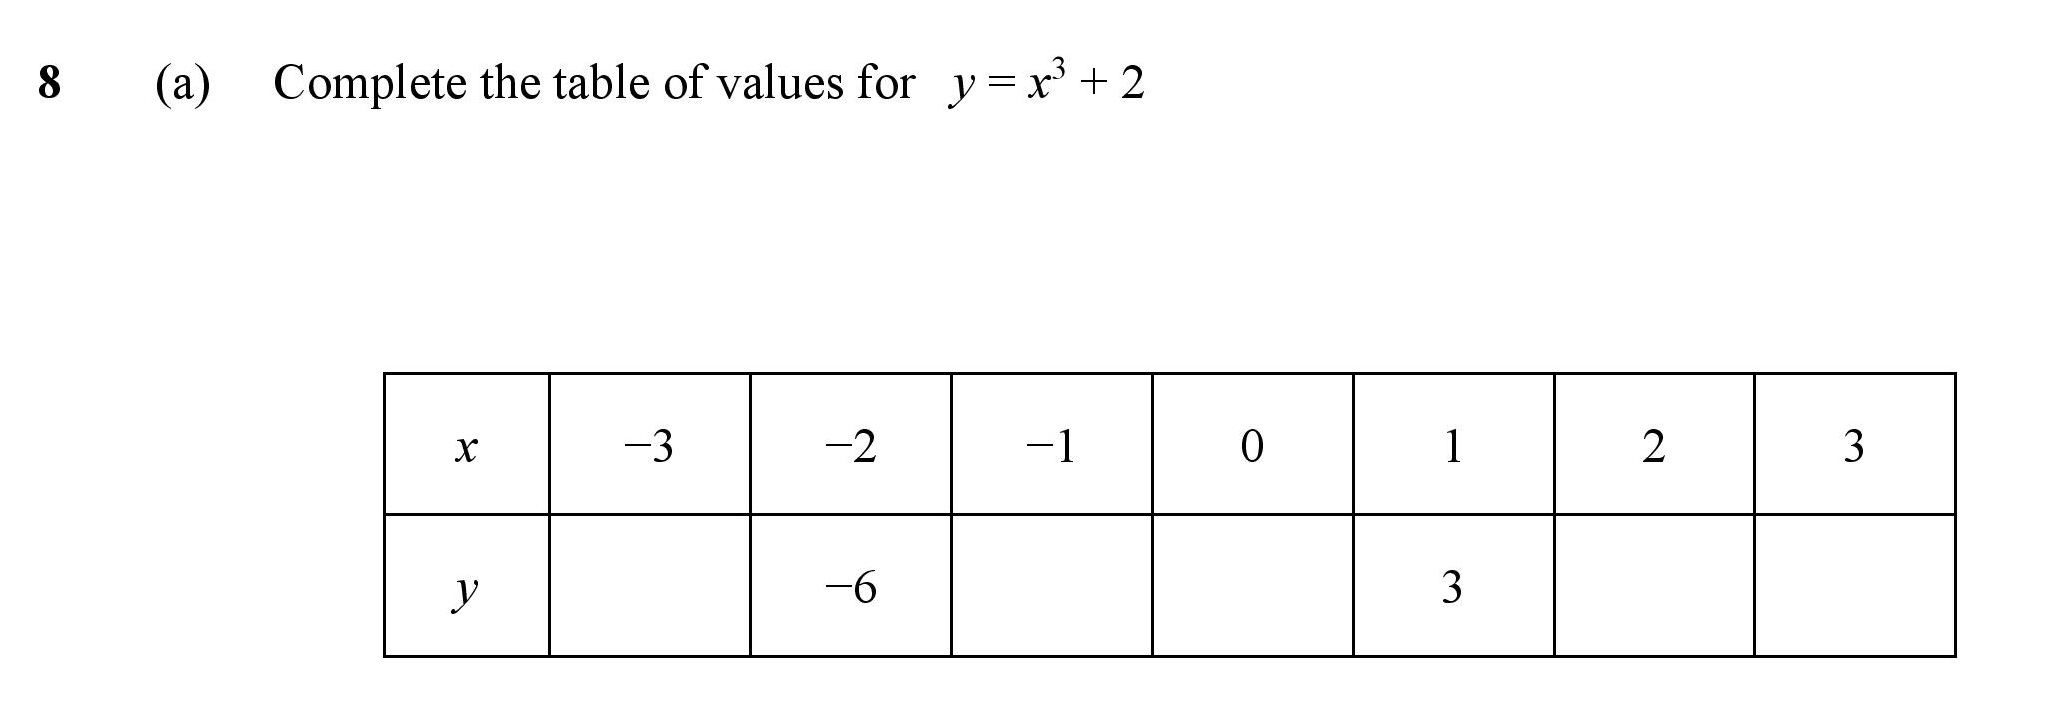
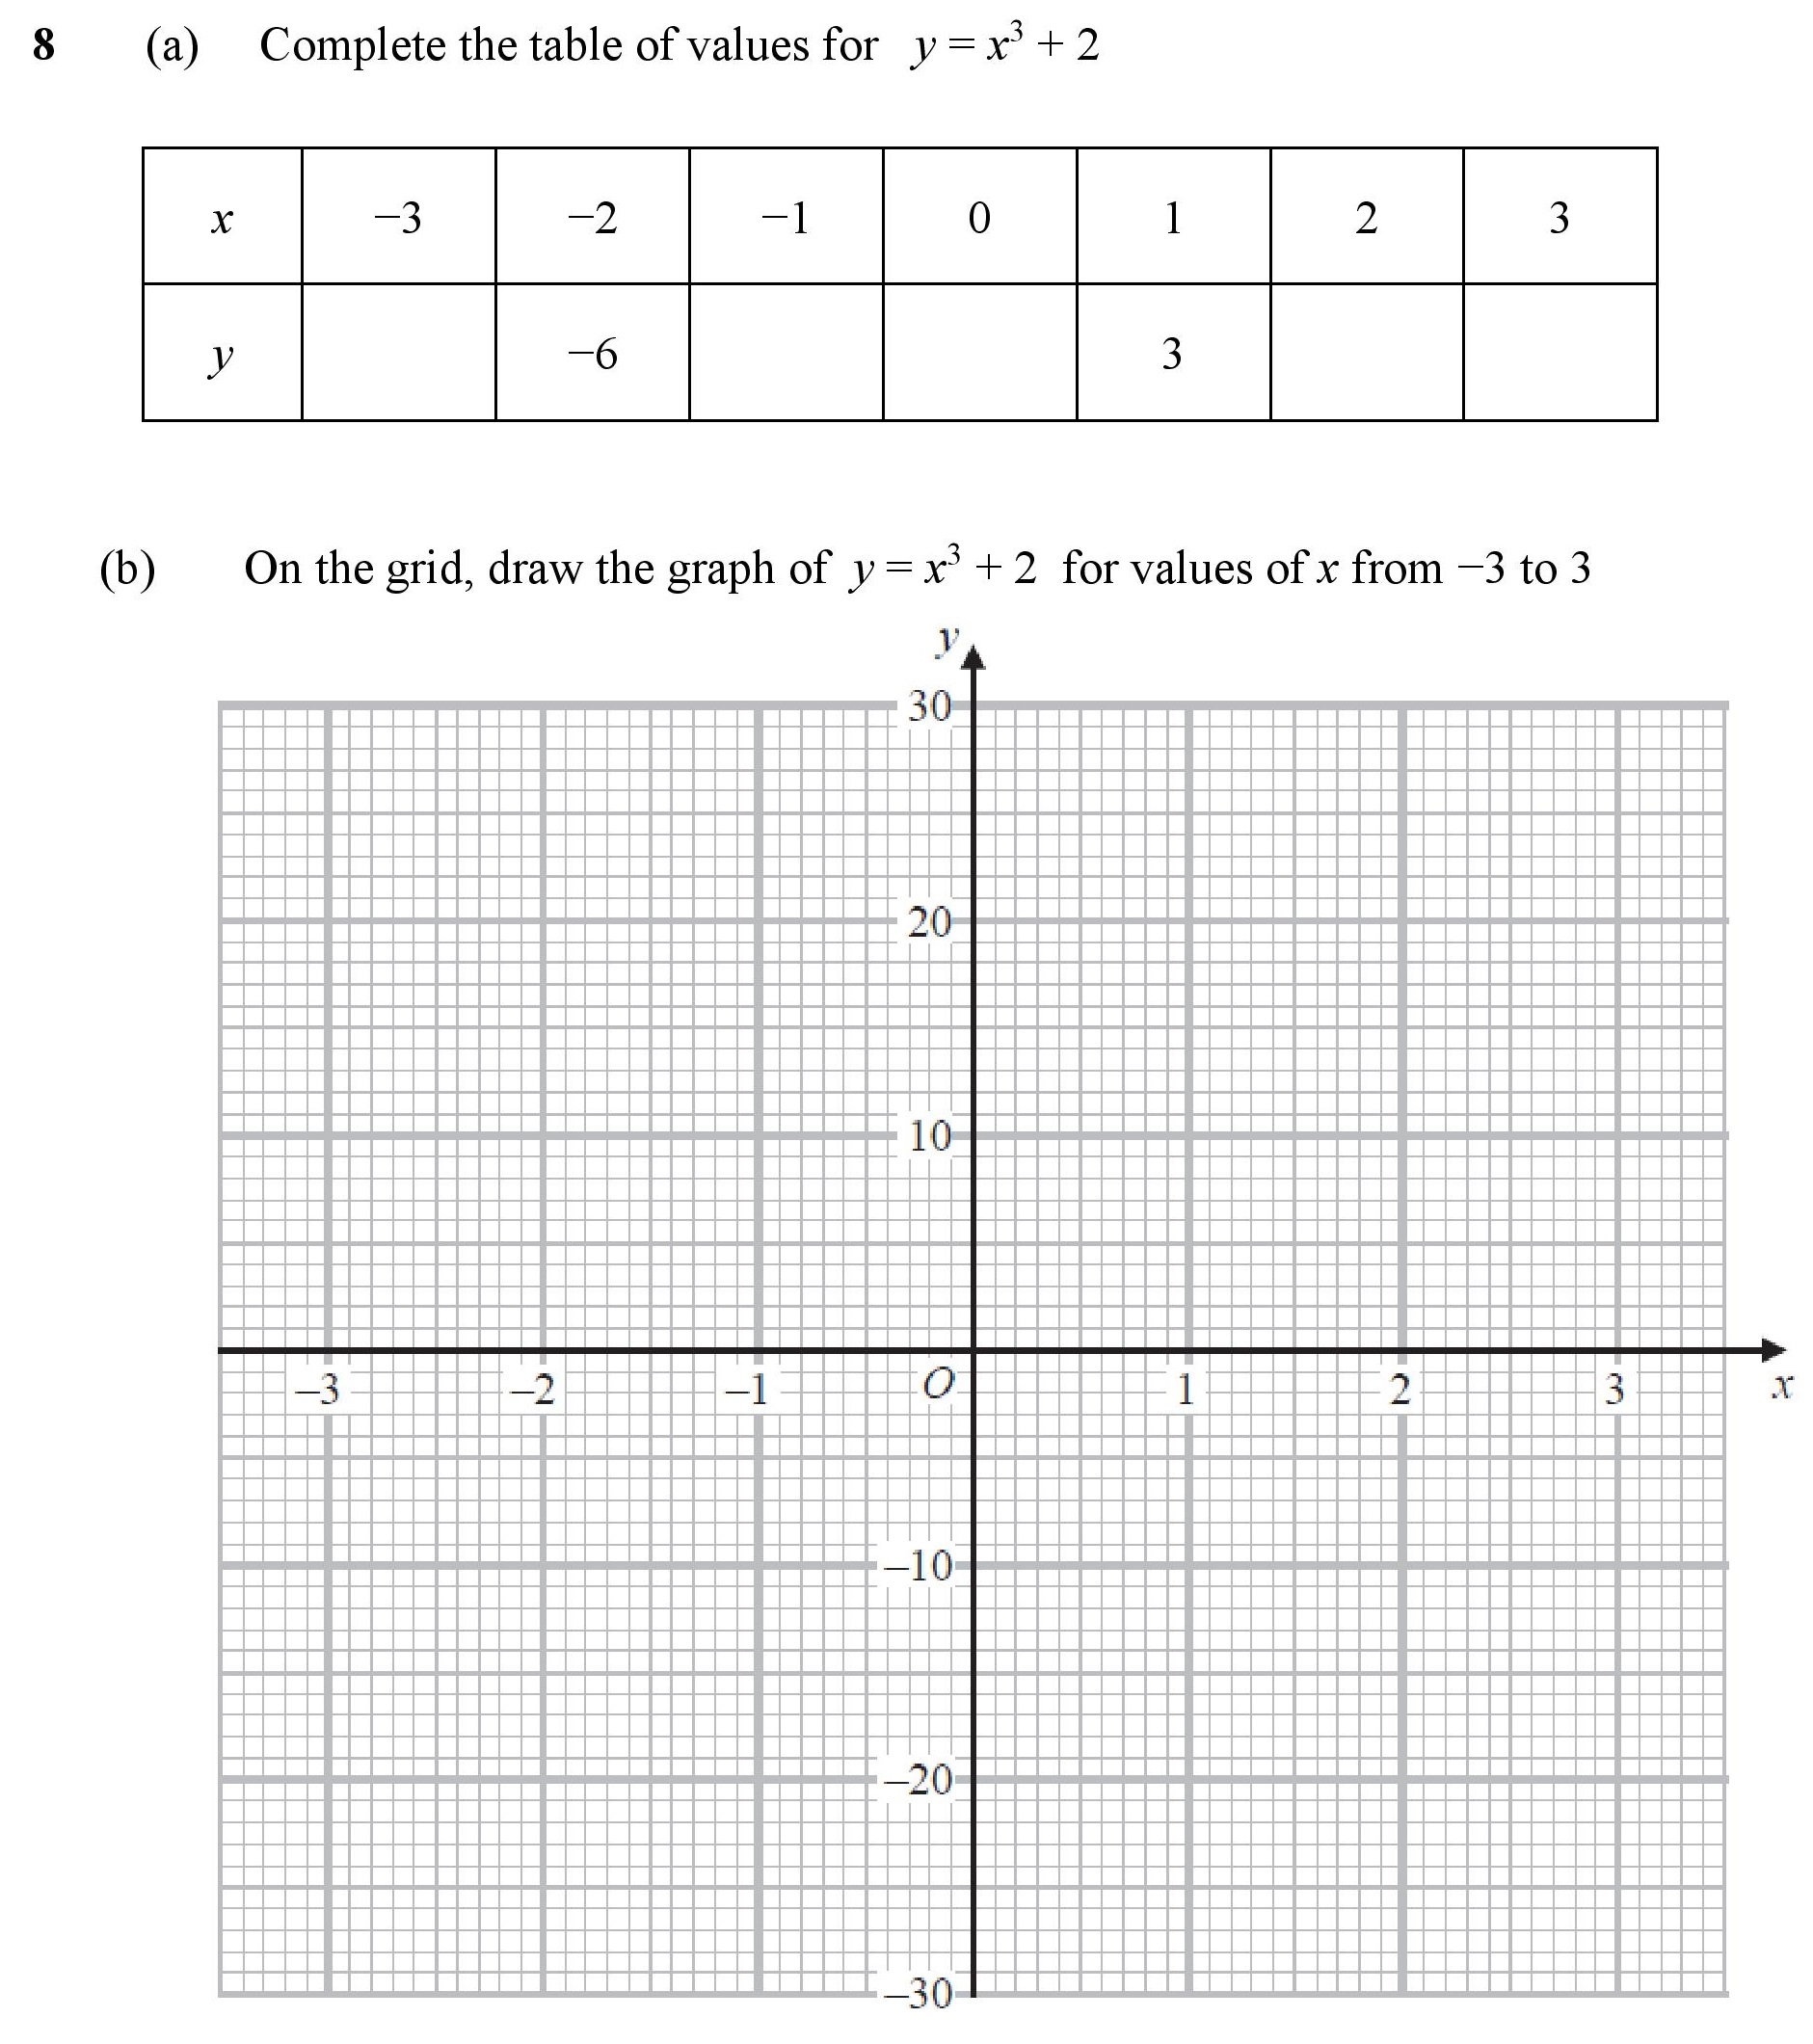
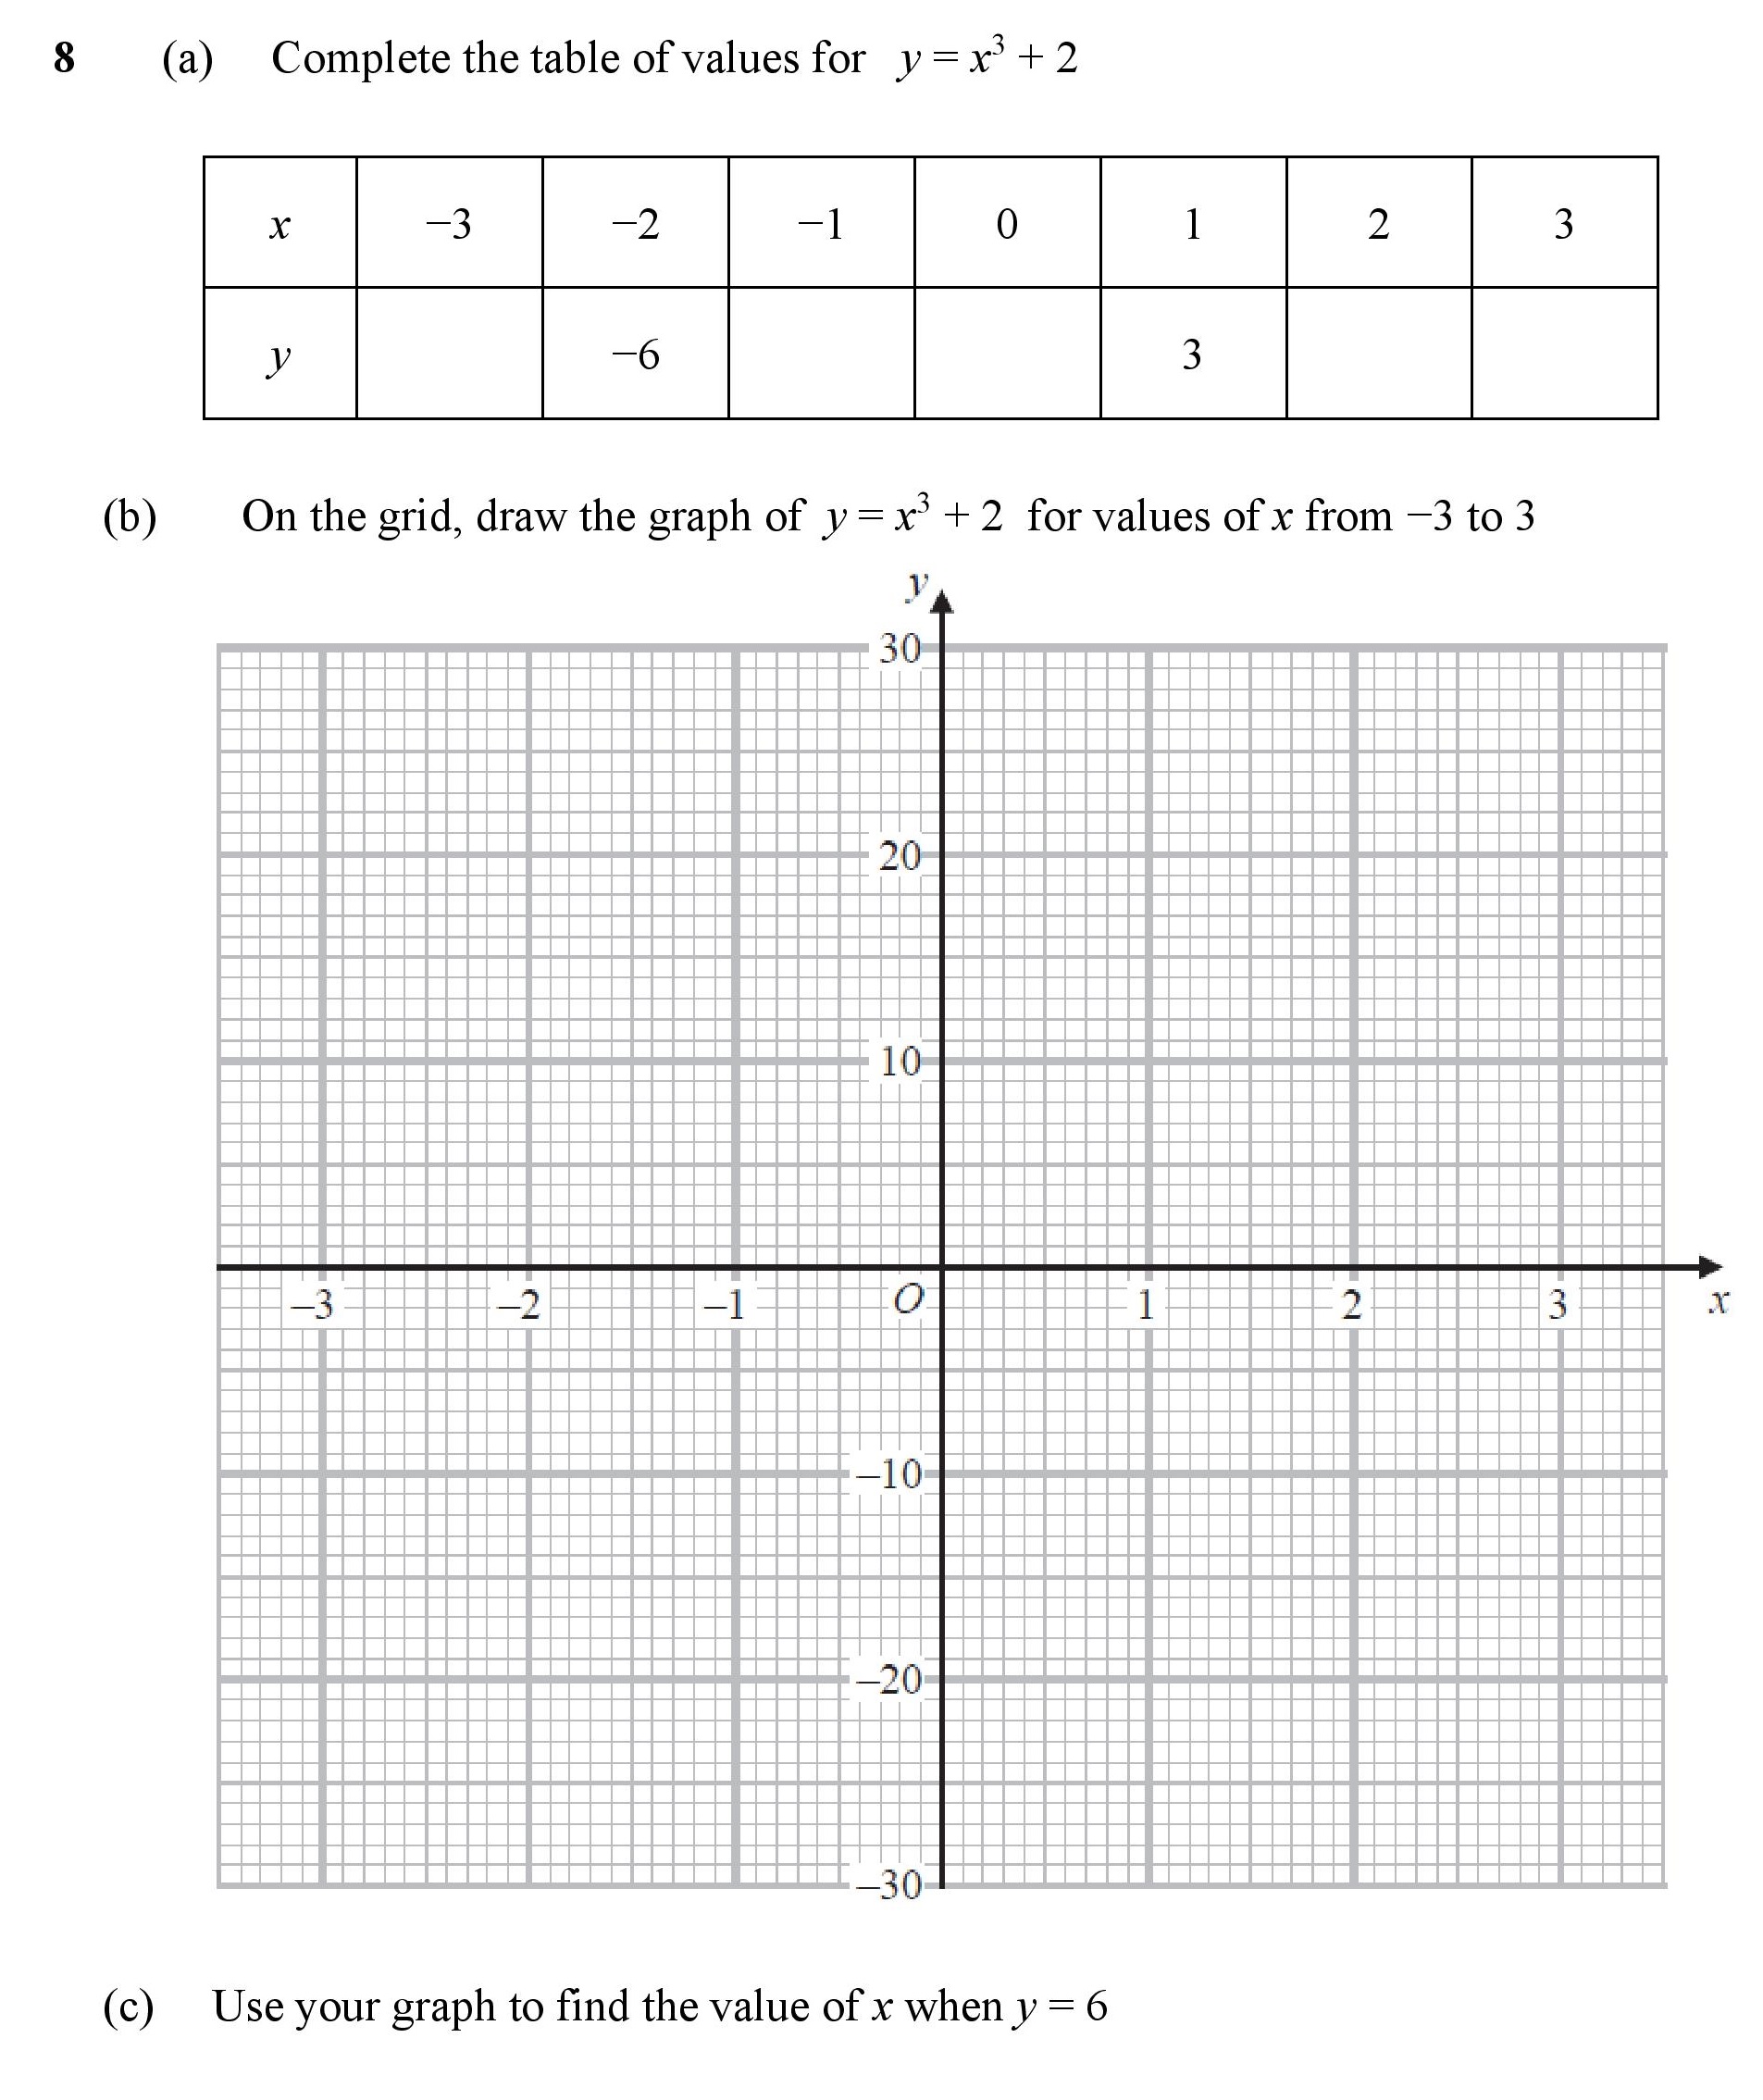
| Table of Values | 1 | 2 | 0.75 | 0.9 | -0.15 | |
| Draw a Cubic Graph | 1 | 2 | 0.5 | 0.79 | -0.29 | |
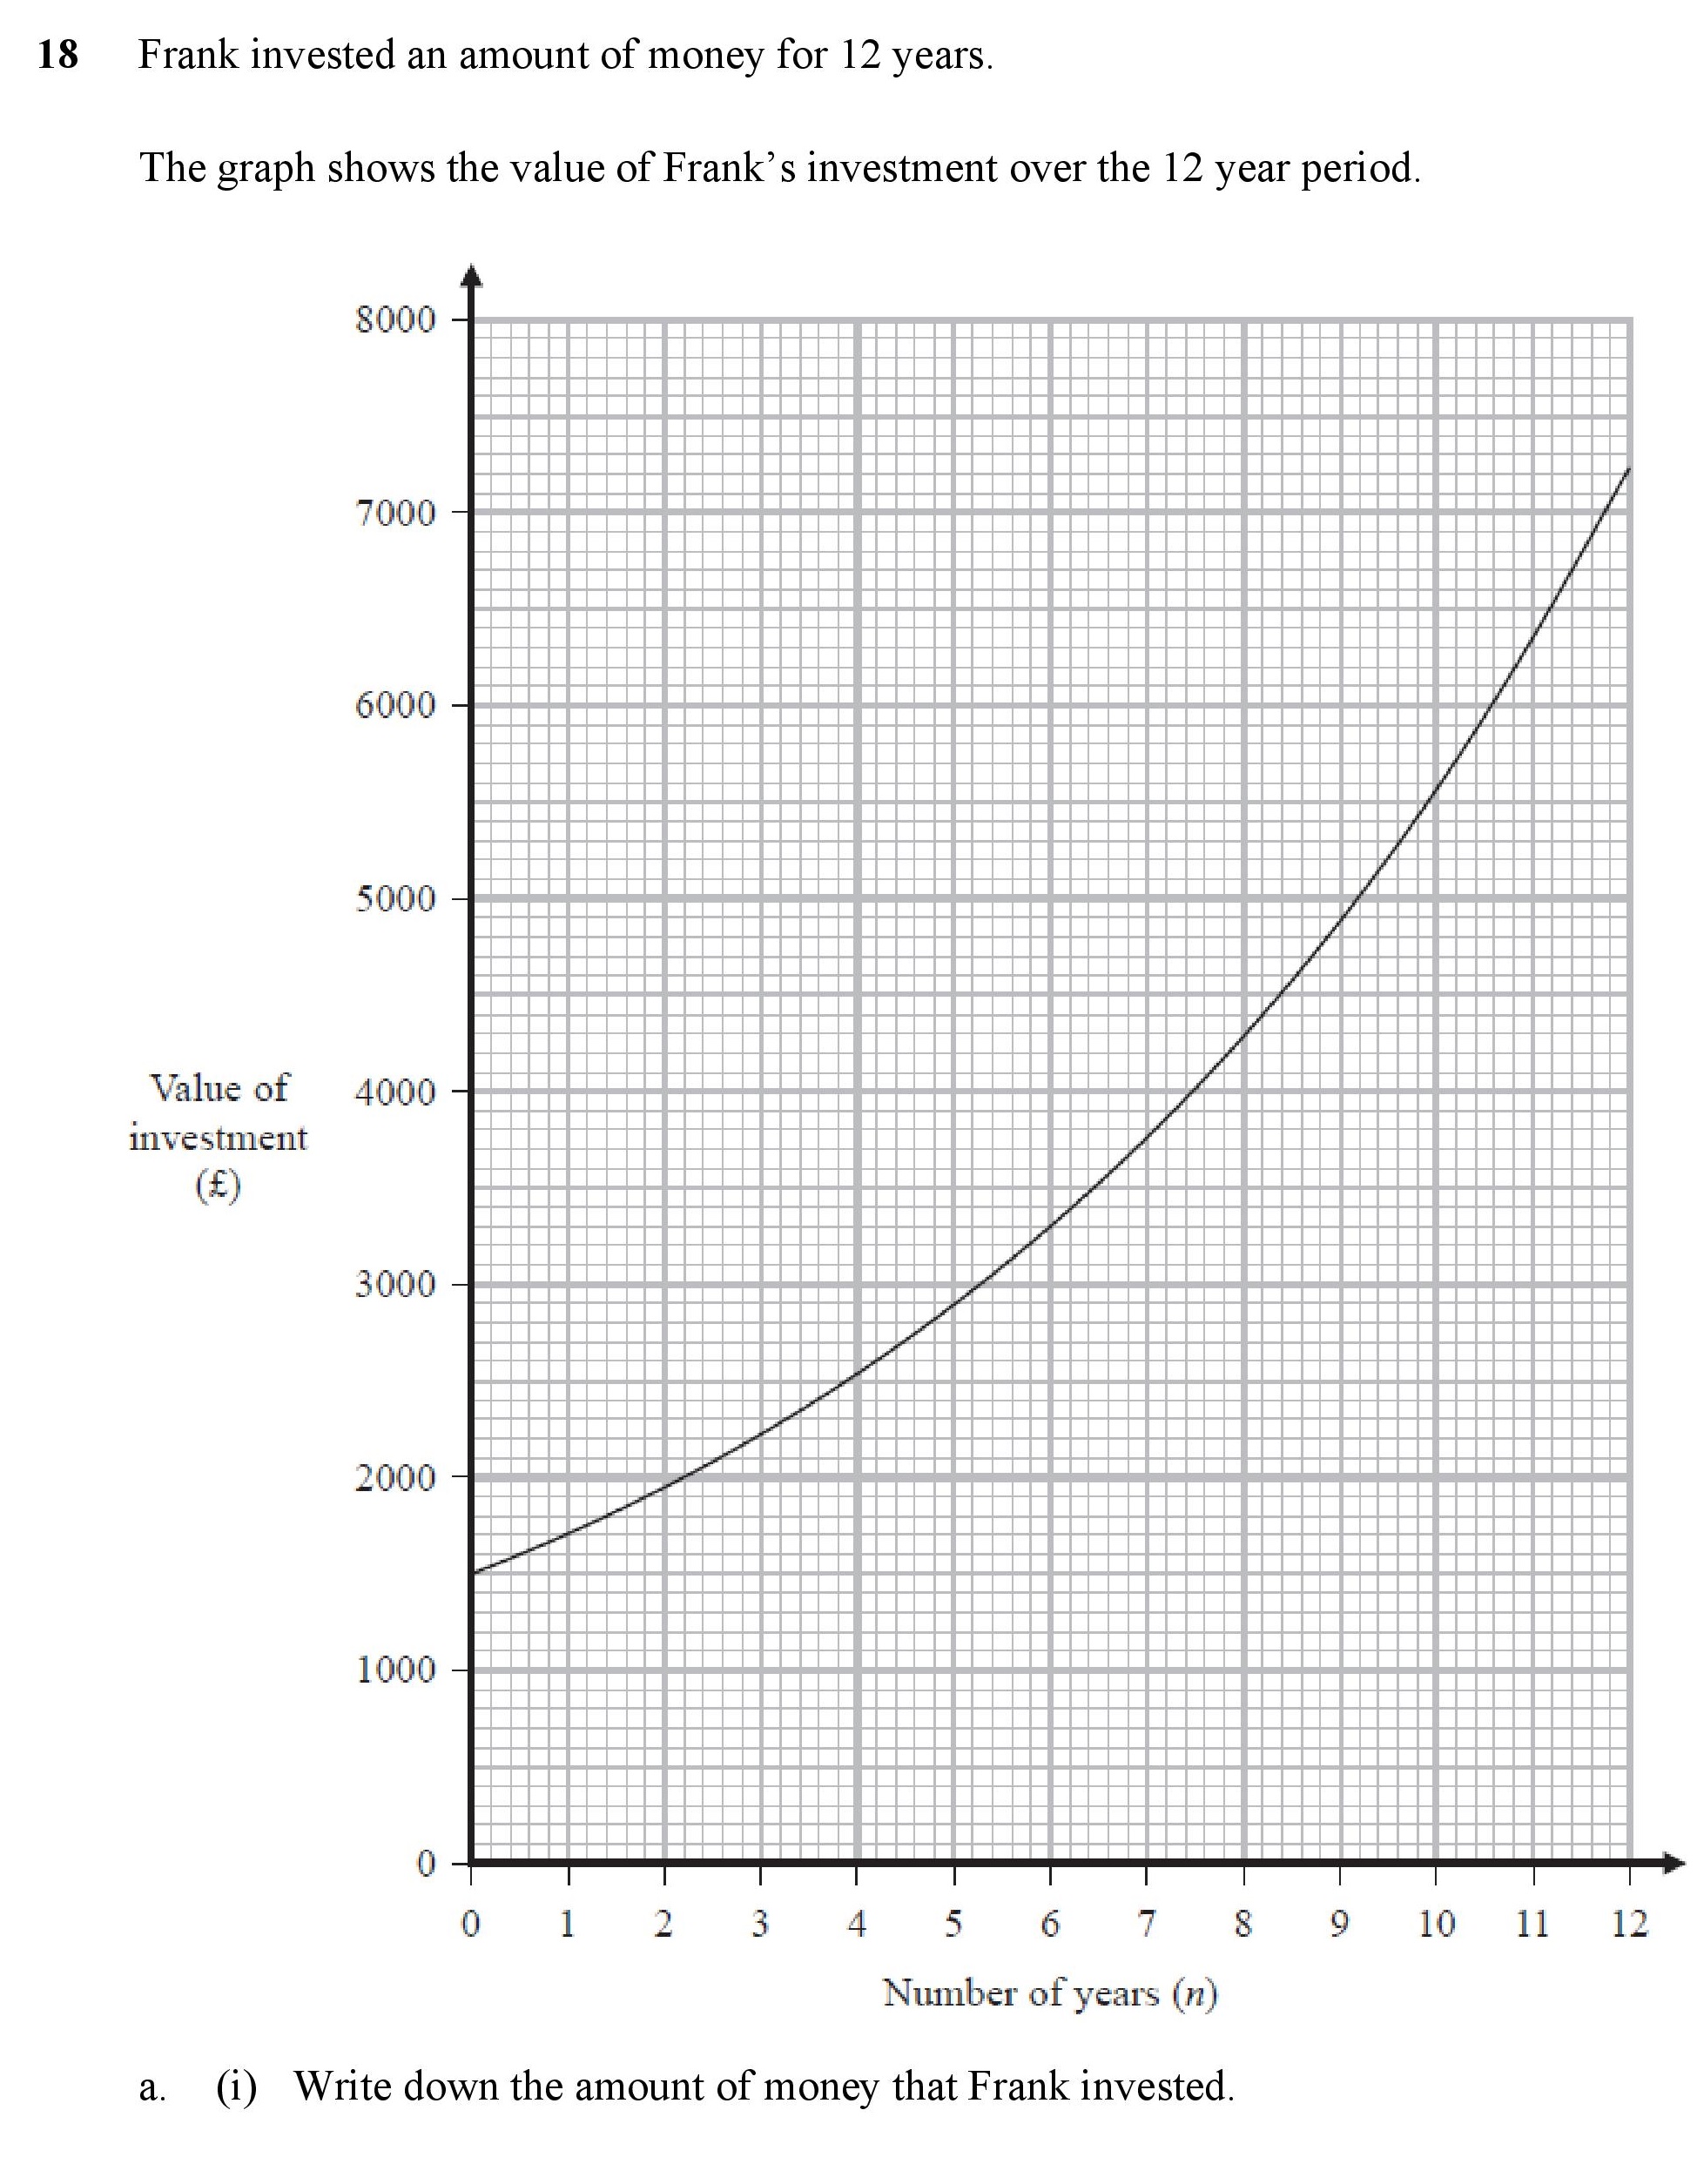
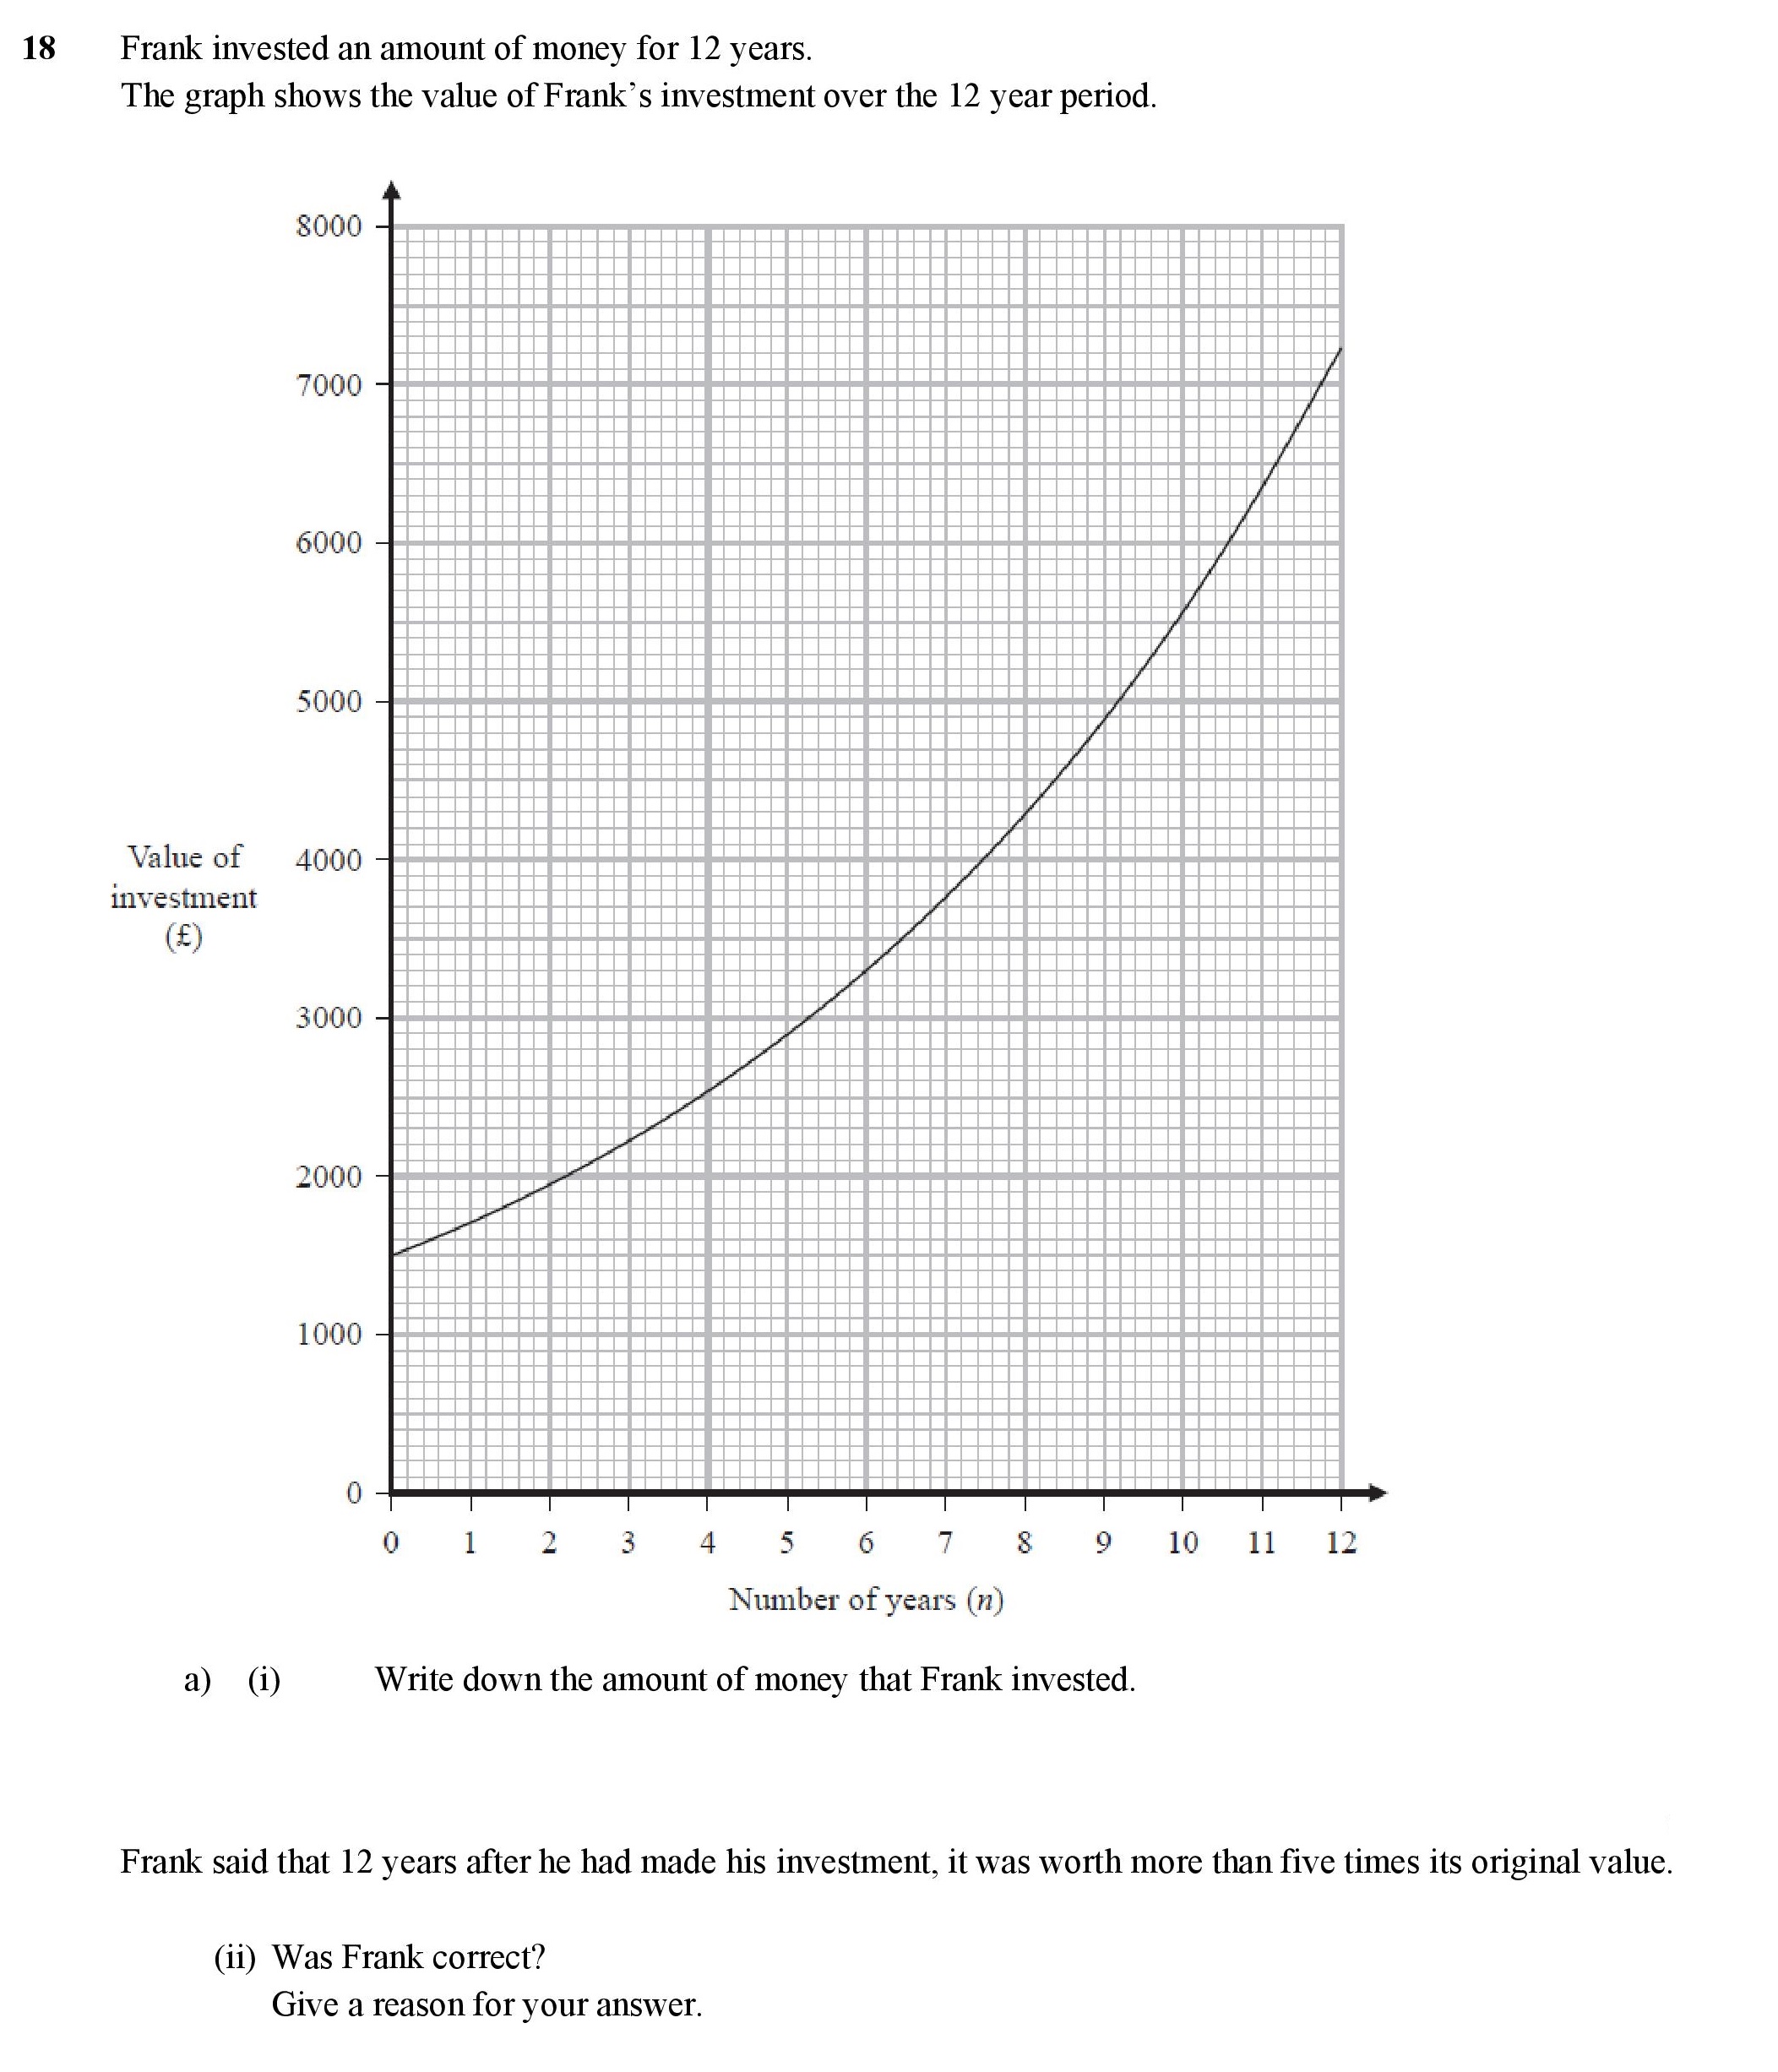
| Estimate Value from a Graph | 1 | 1 | 1.5 | 0.71 | 0.79 | |
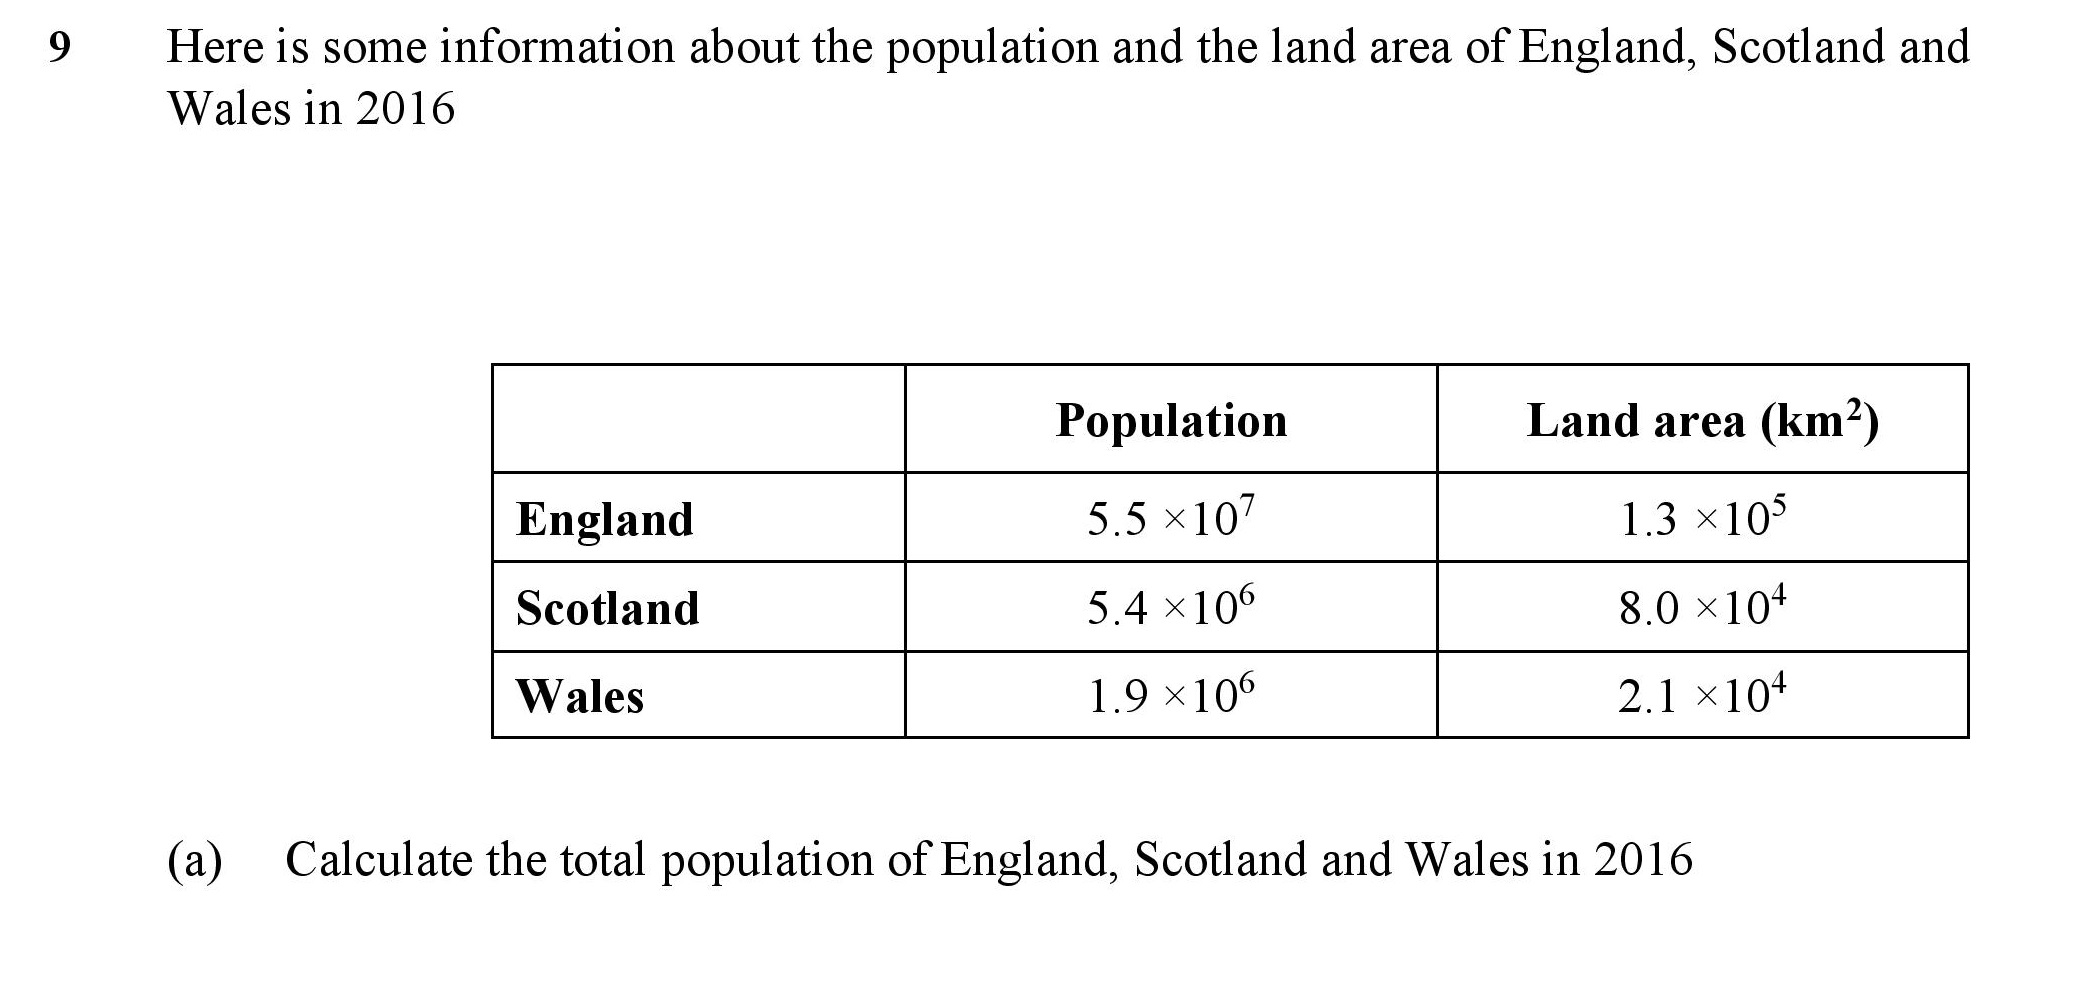
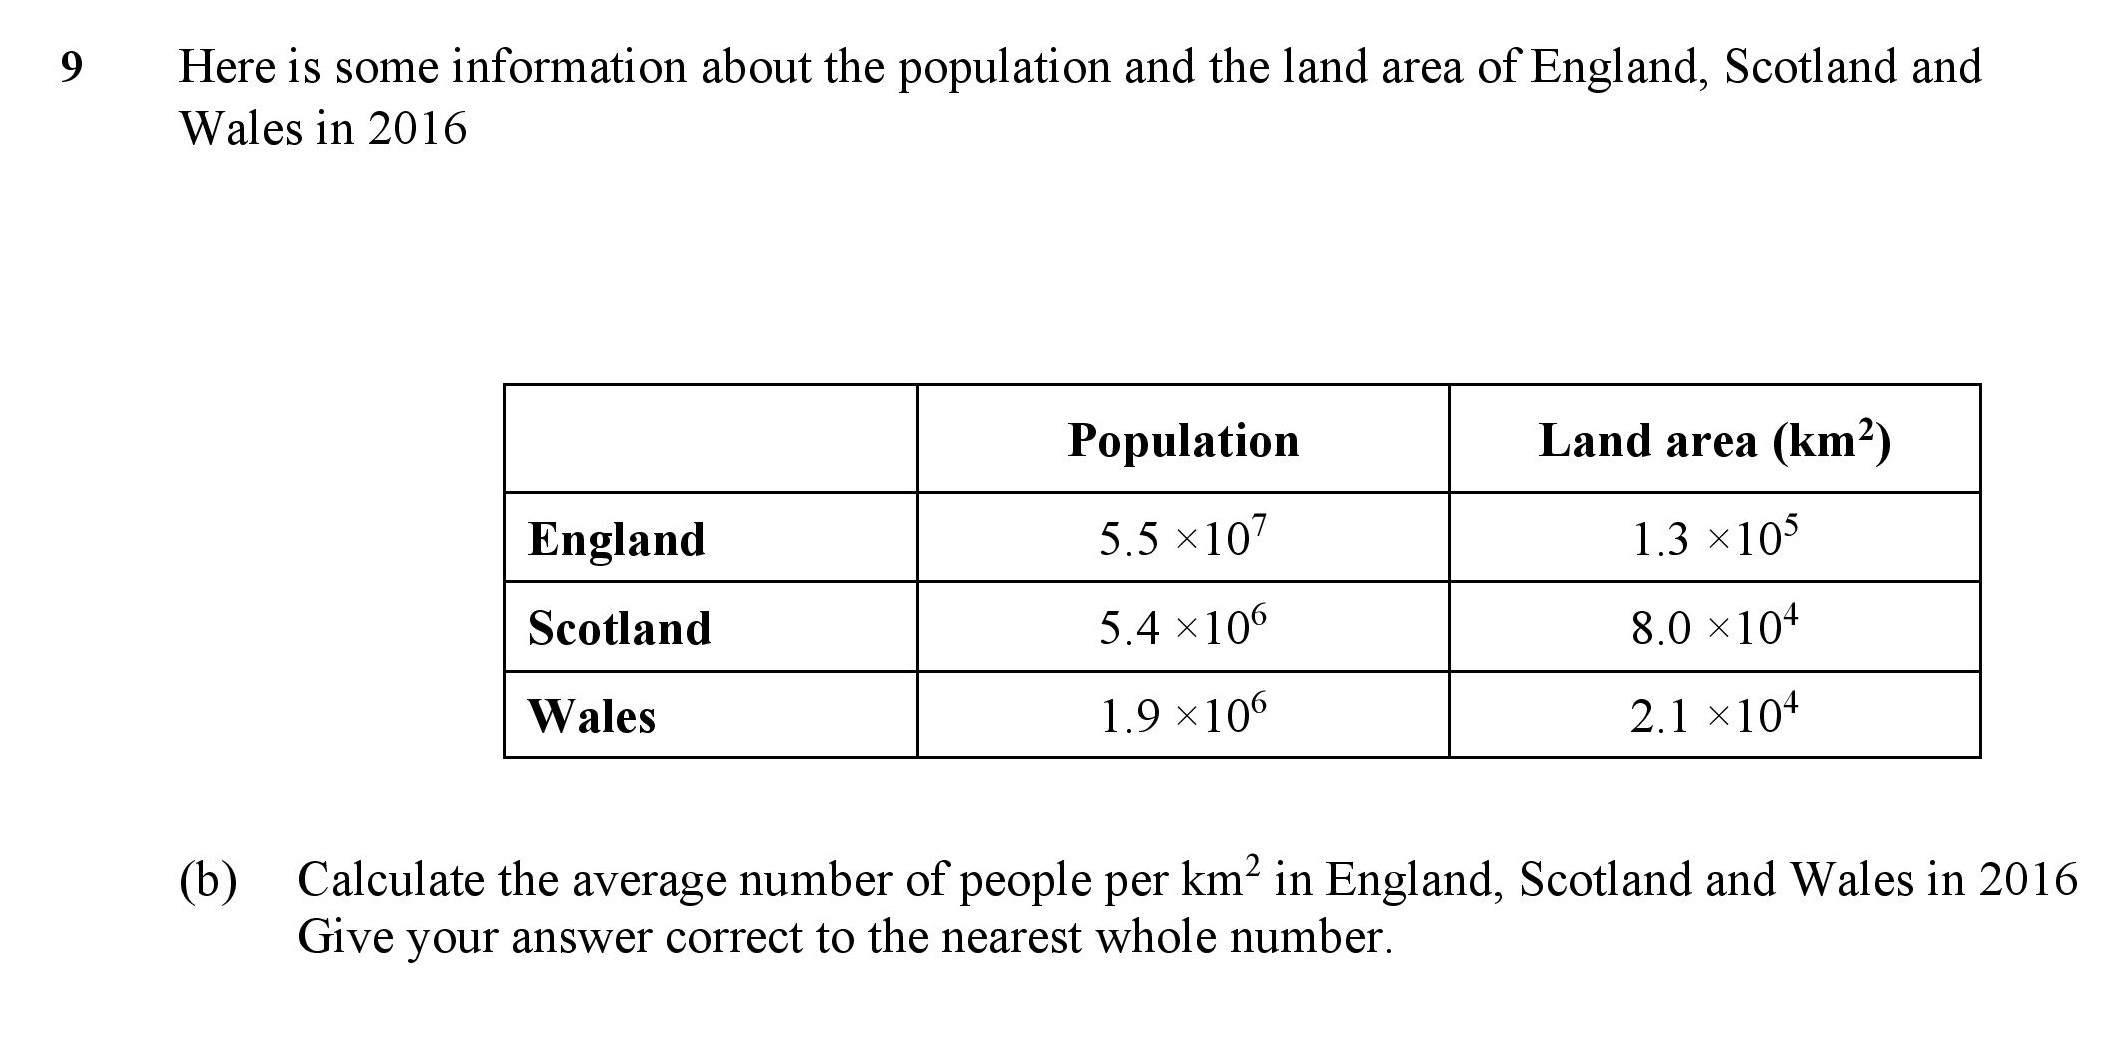
| Standard Form Calc | 1 | 1 | 1 | 0.85 | 0.15 | |
| Standard Form With A Calculator | 1 | 3 | 0.5 | 0.5 | 0 | |
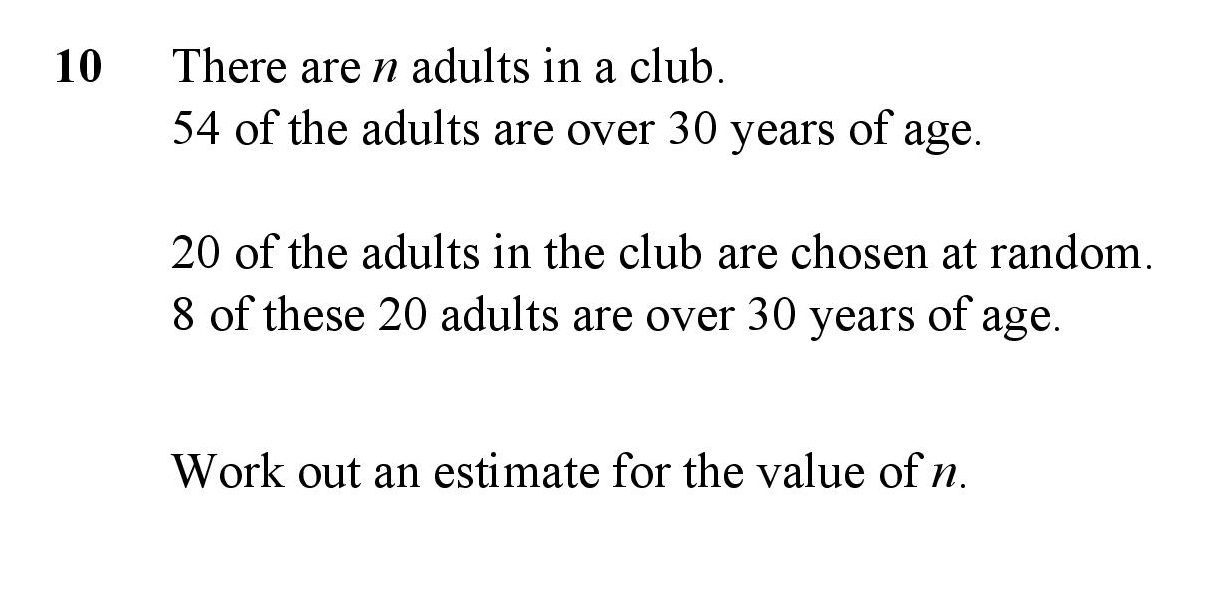
| Capture Recapture | 1 | 2 | 0.5 | 0.41 | 0.09 | |
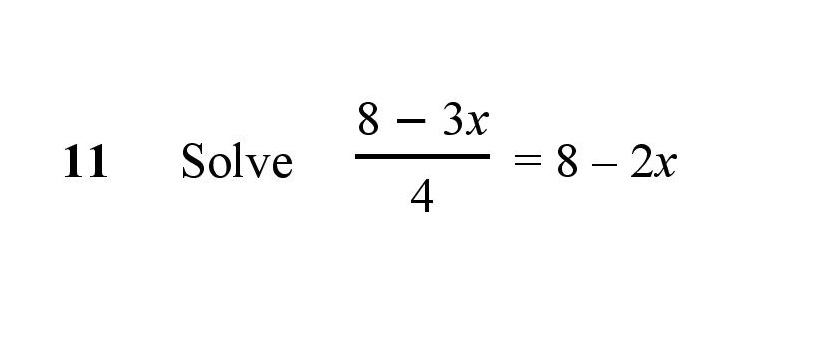
| Solving Equations Involving Fractions | 1 | 3 | 0.5 | 0.58 | -0.08 | |
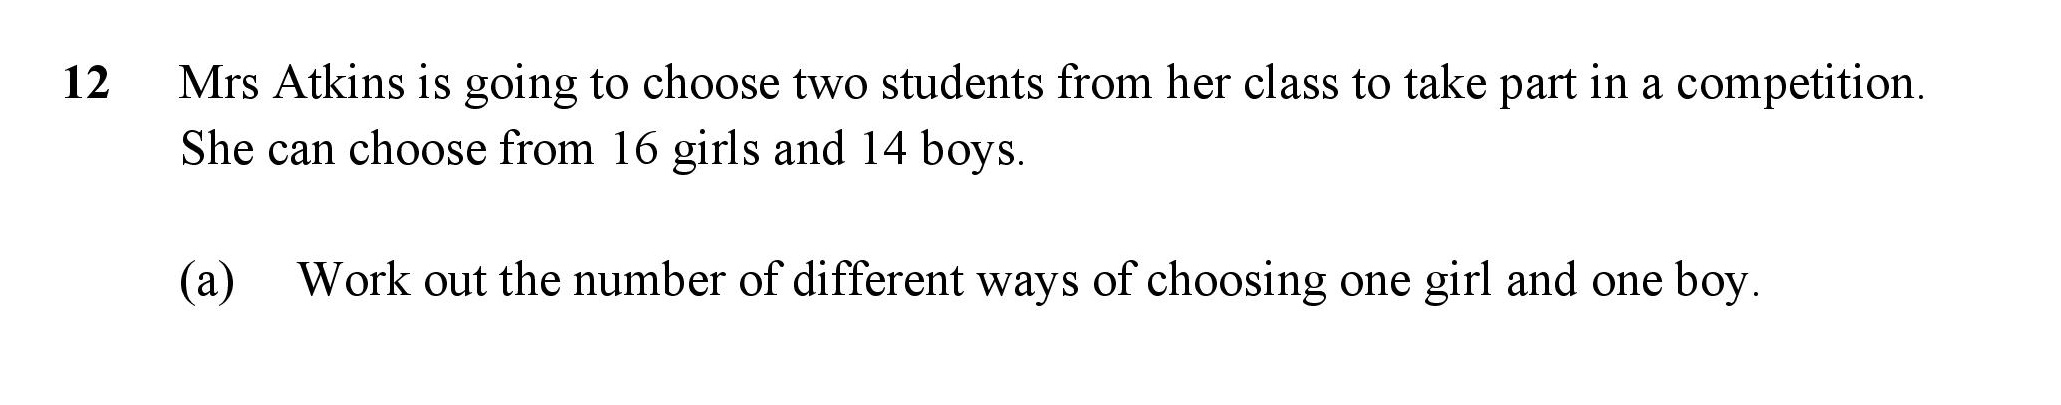
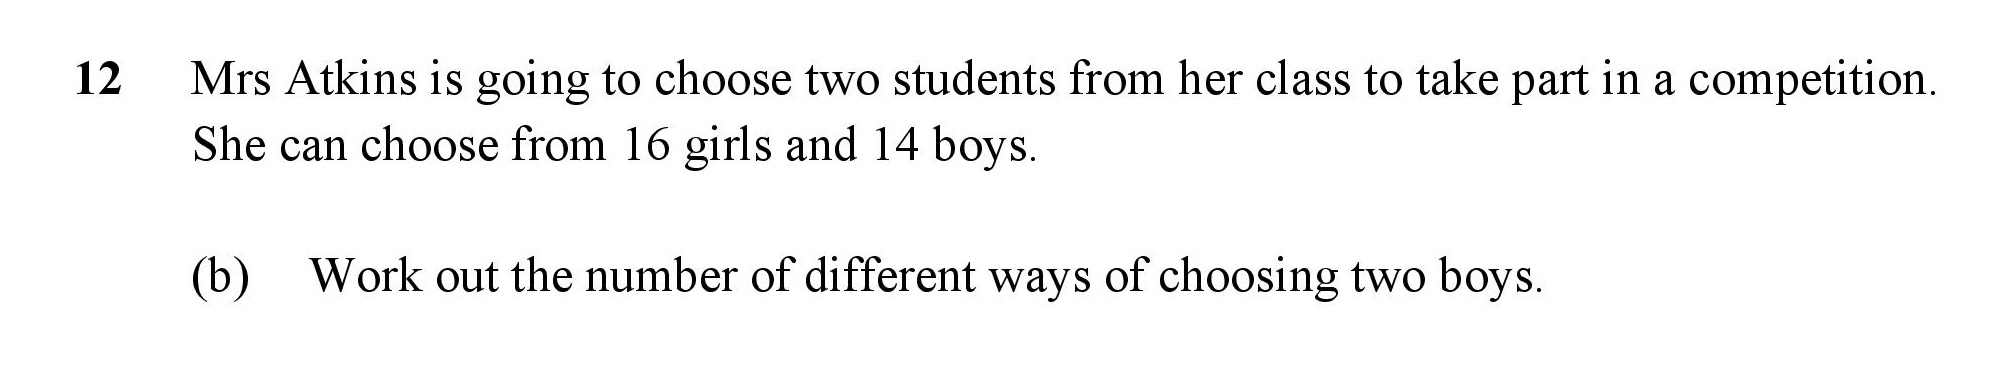
| Counting Methods | 1 | 1 | 1 | 0.46 | 0.54 | |
| Product Rule for Counting with Halving | 1 | 2 | 0.75 | 0.18 | 0.57 | |
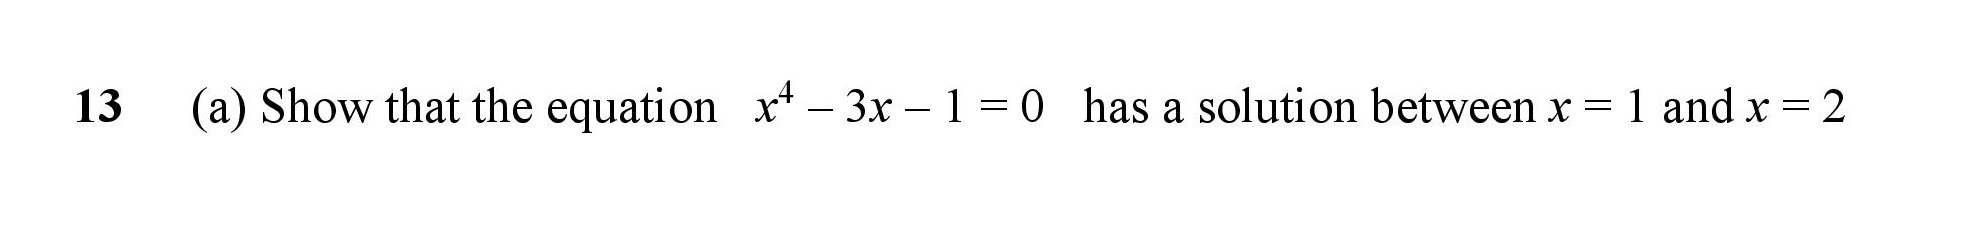
| Iterative processes | 1 | 2 | 0.5 | 0.25 | 0.25 | |
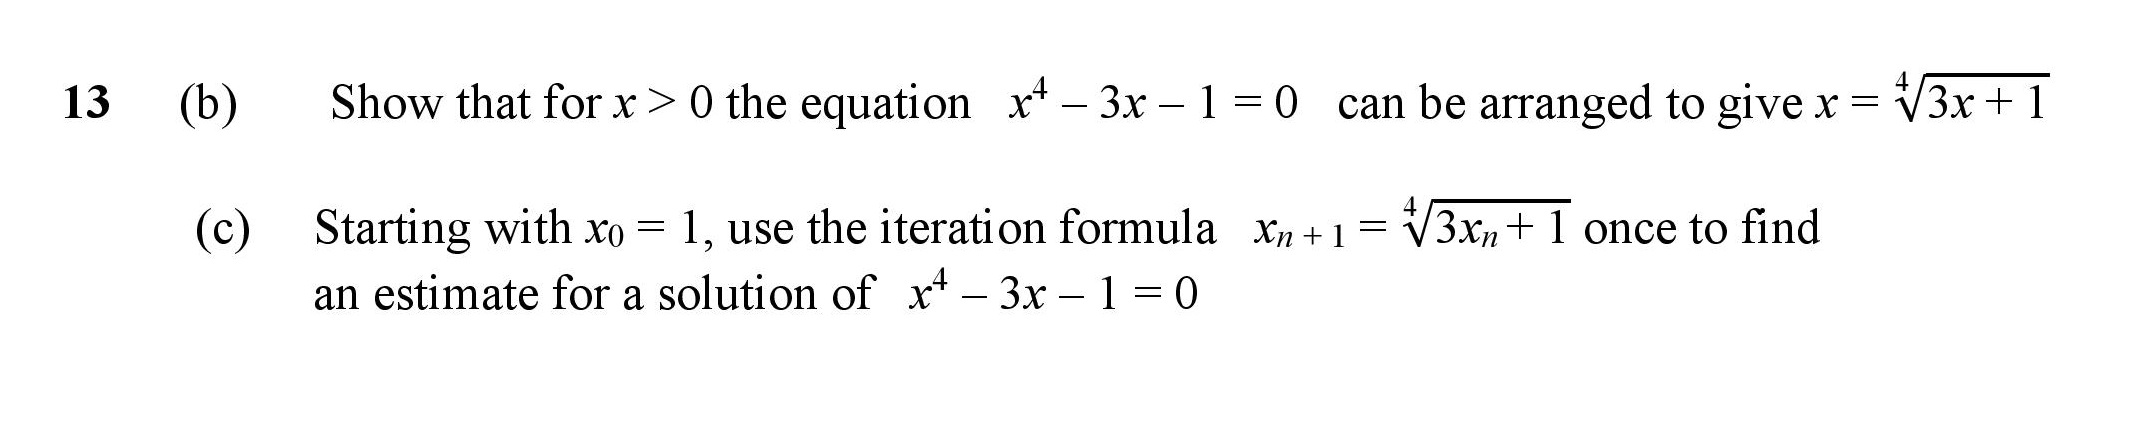
| Rearrange Equation to form an Iterative Formu | 2 | 1 | 1.5 | 0.49 | 1.01 | |
| Use an Iterative Formula | 1 | 1 | 1 | 0.26 | 0.74 | |
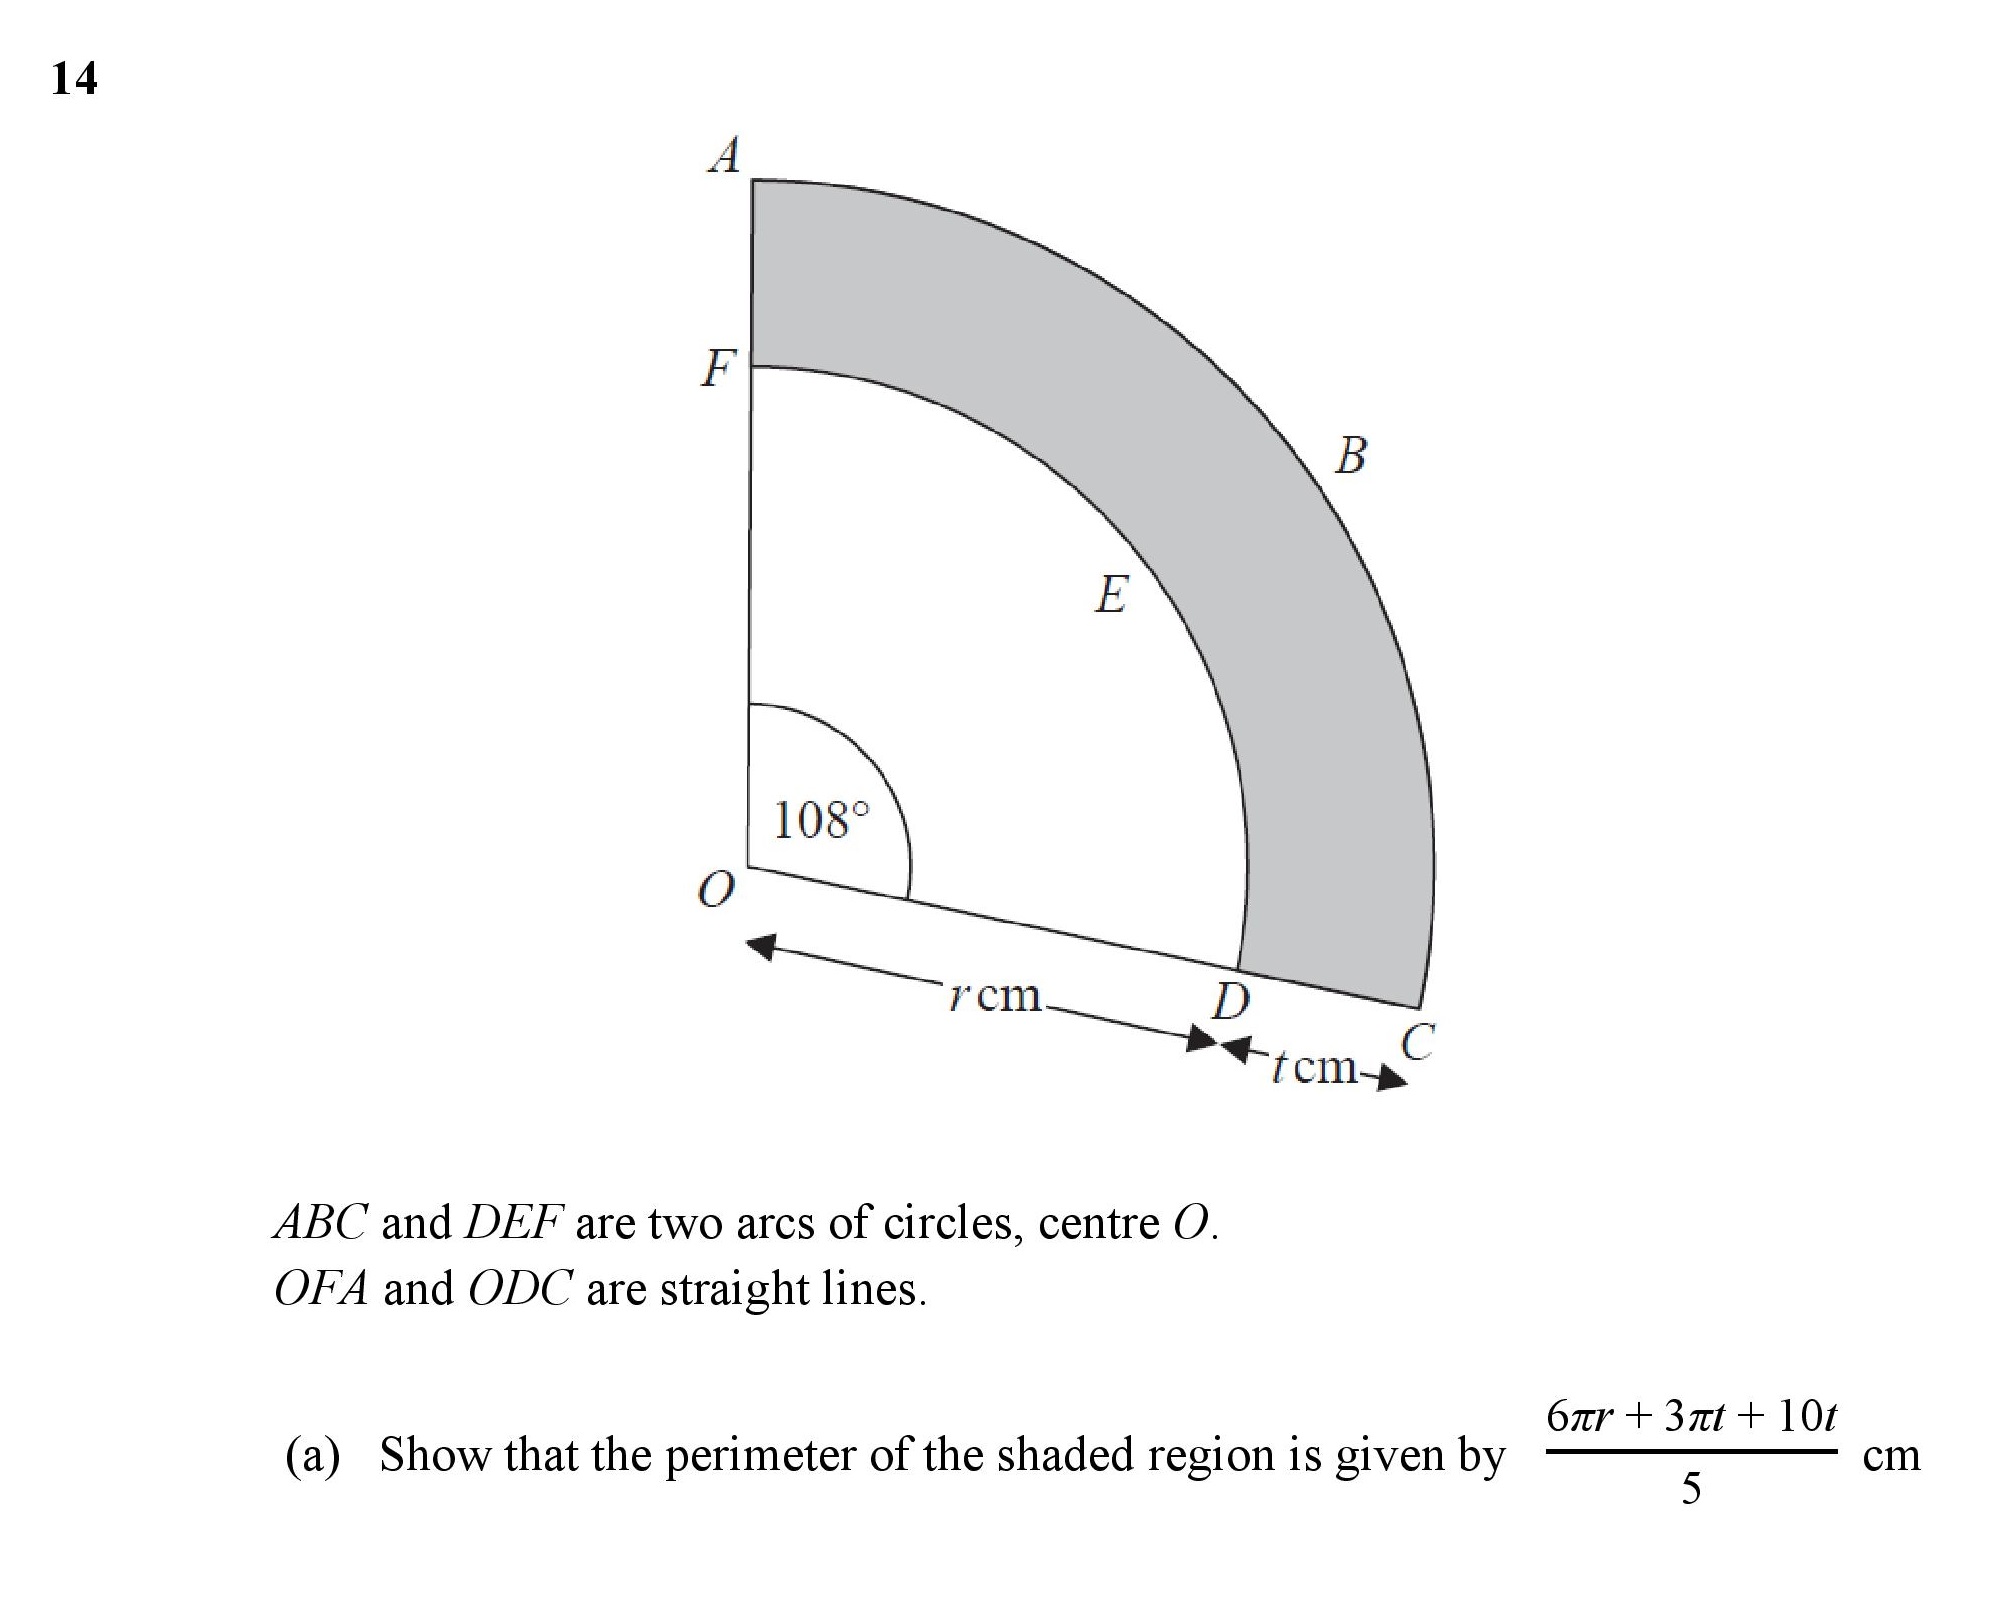
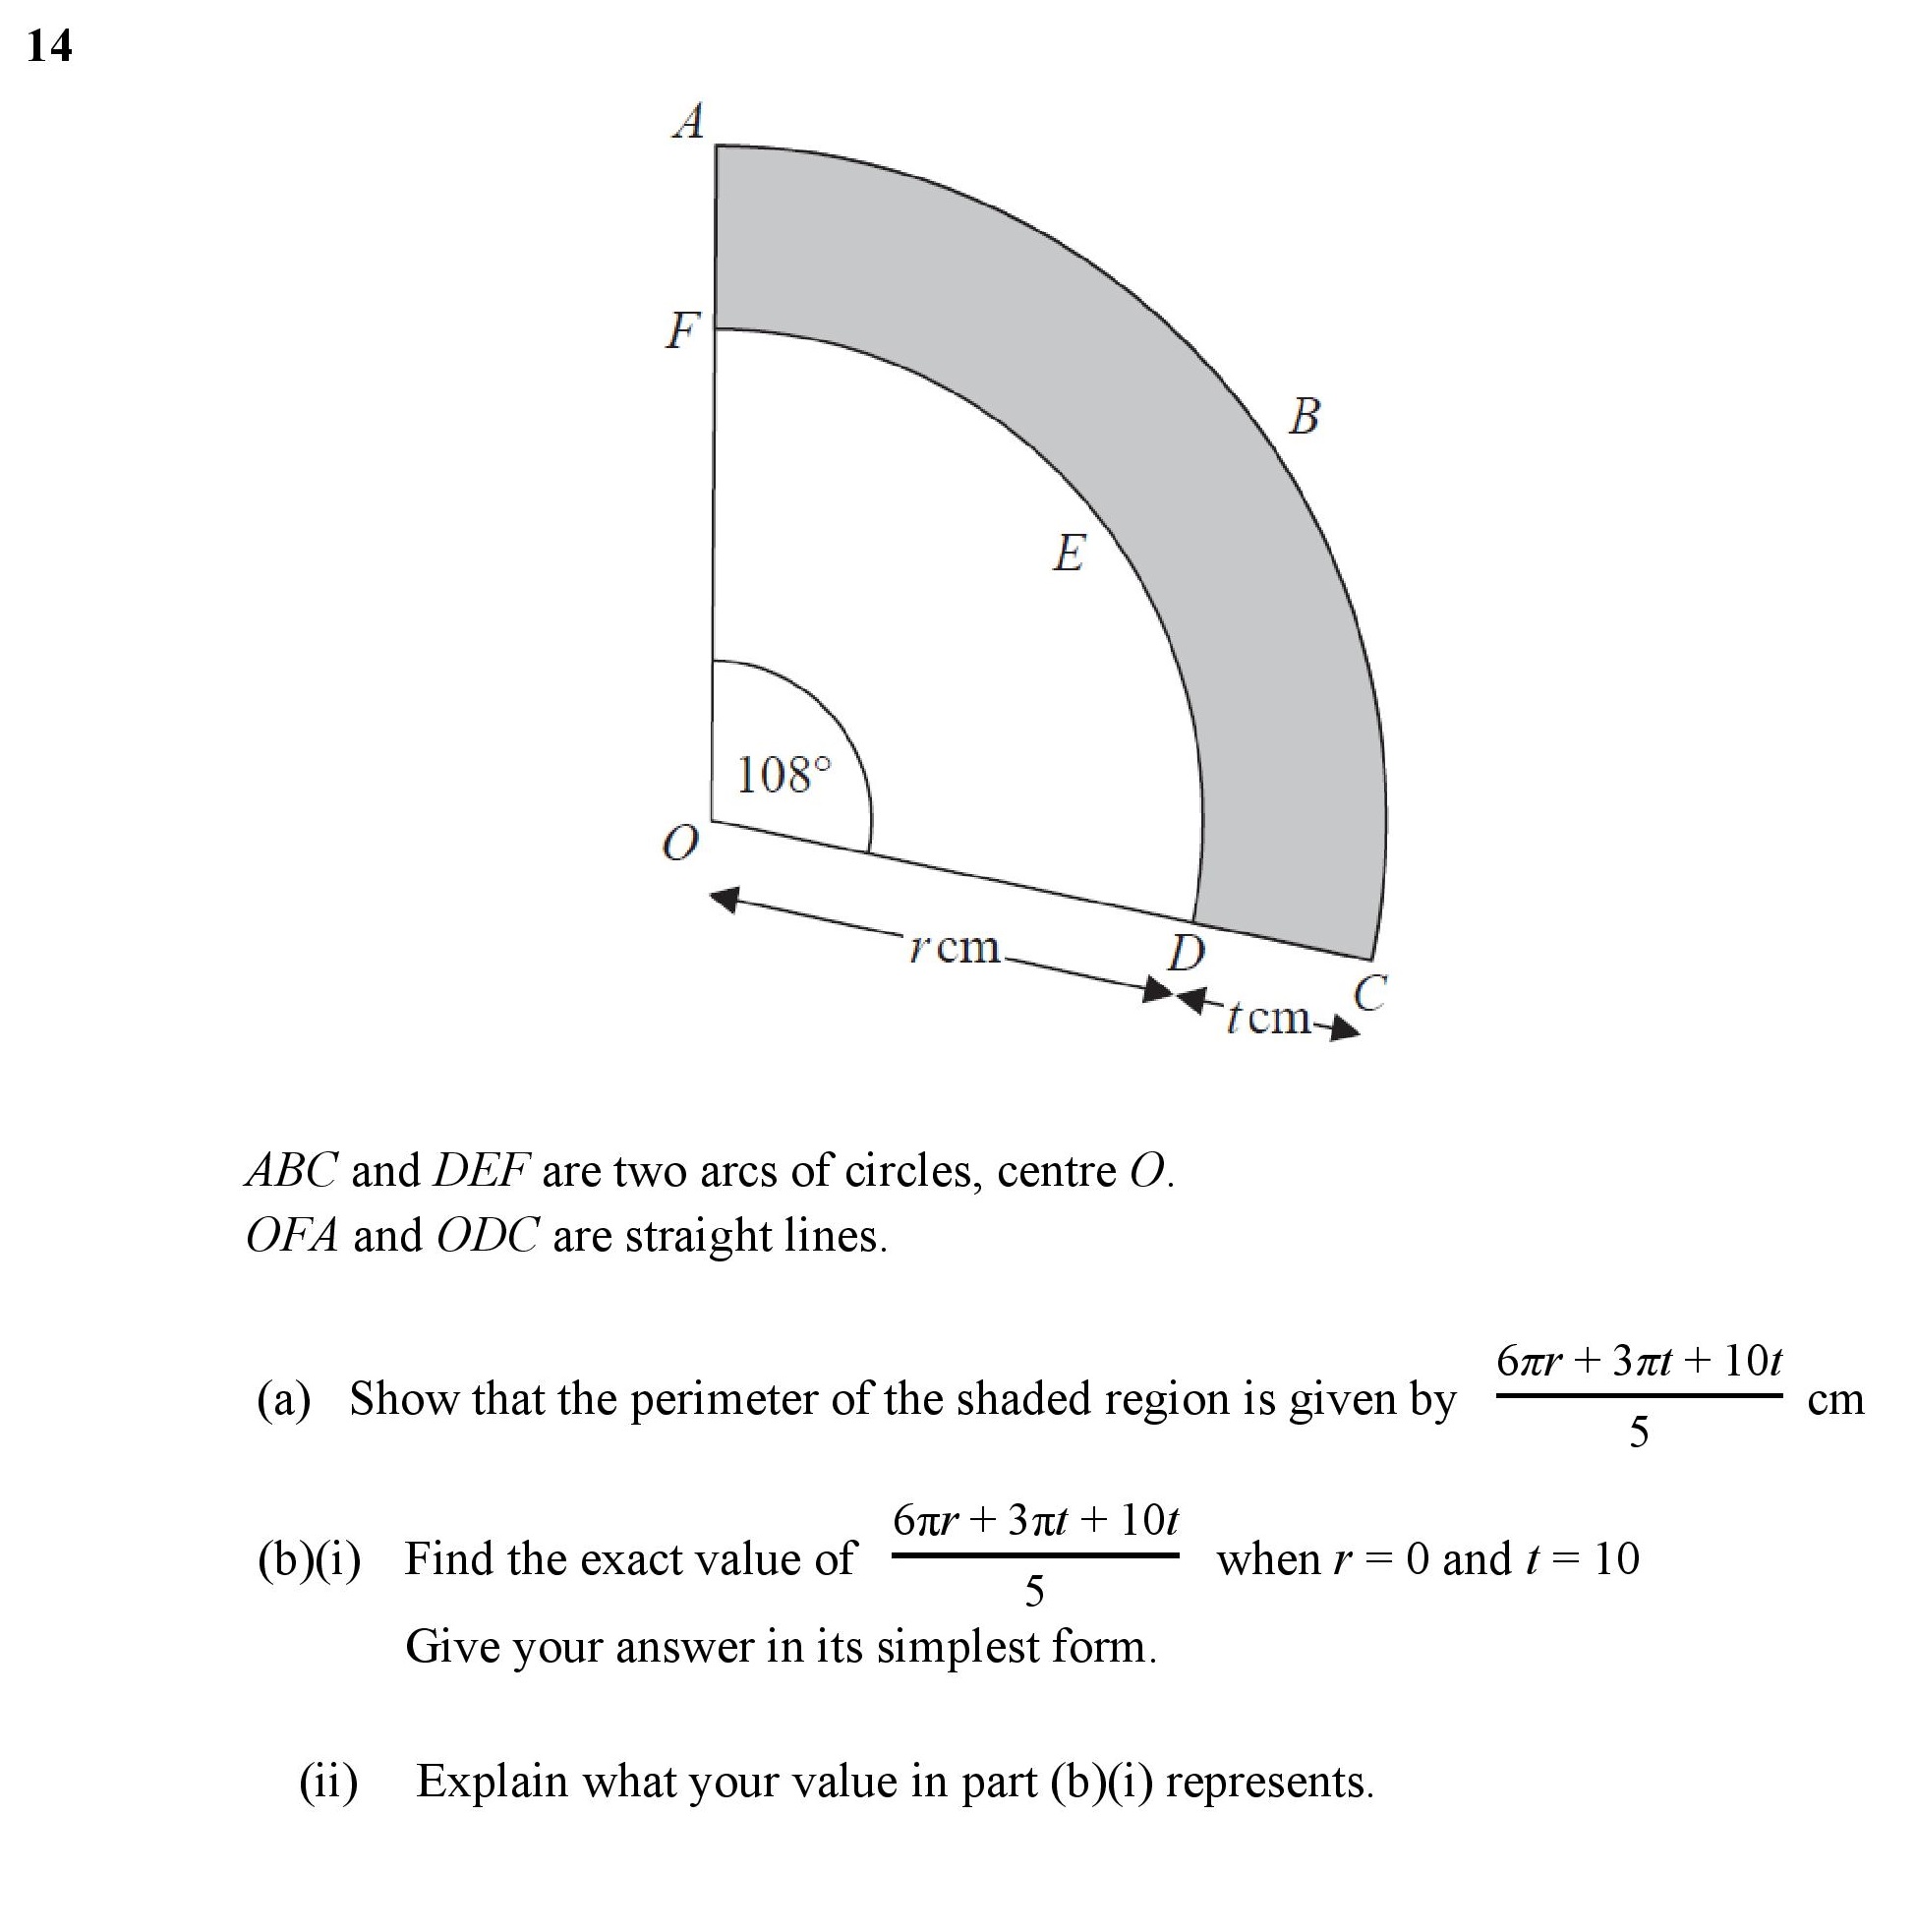
| Form an Expression for perimeter of a Sector | 2 | 5 | 0.3 | 0.13 | 0.17 | |
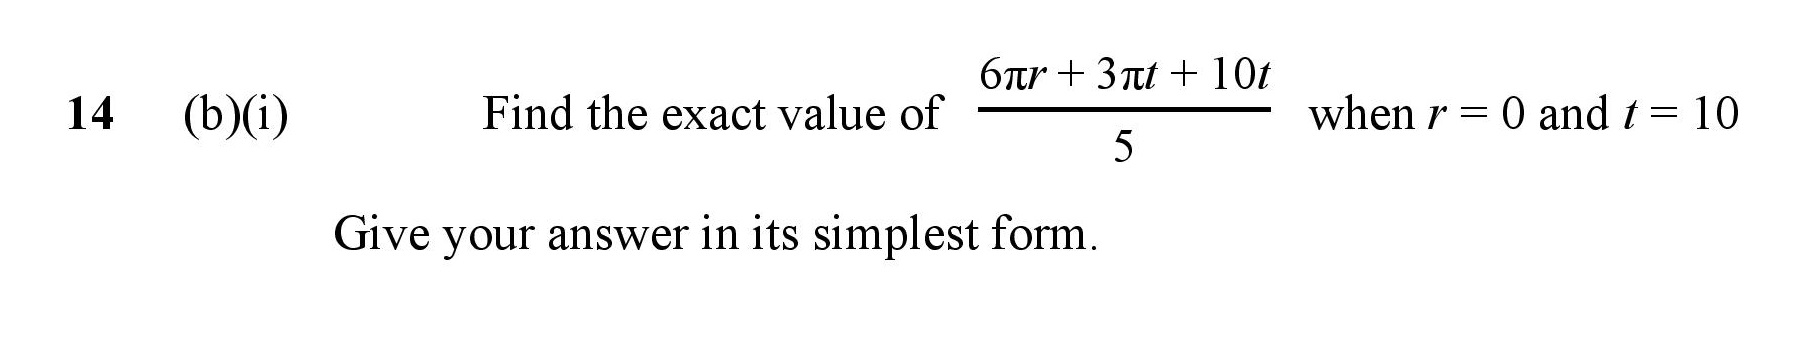
| Simplify Exact Form of an Expression | 1 | 1 | 1 | 0.16 | 0.84 | |
| Evaluate Meaning of a Value | 2 | 1 | 1.5 | 0.13 | 1.37 | |
| Direct and Inverse Proportion | 1 | 3 | 0.33 | 0.42 | -0.09 | |
| Ratio, Fractions and Percentage Problems | 3 | 4 | 0.38 | 0.15 | 0.23 | |
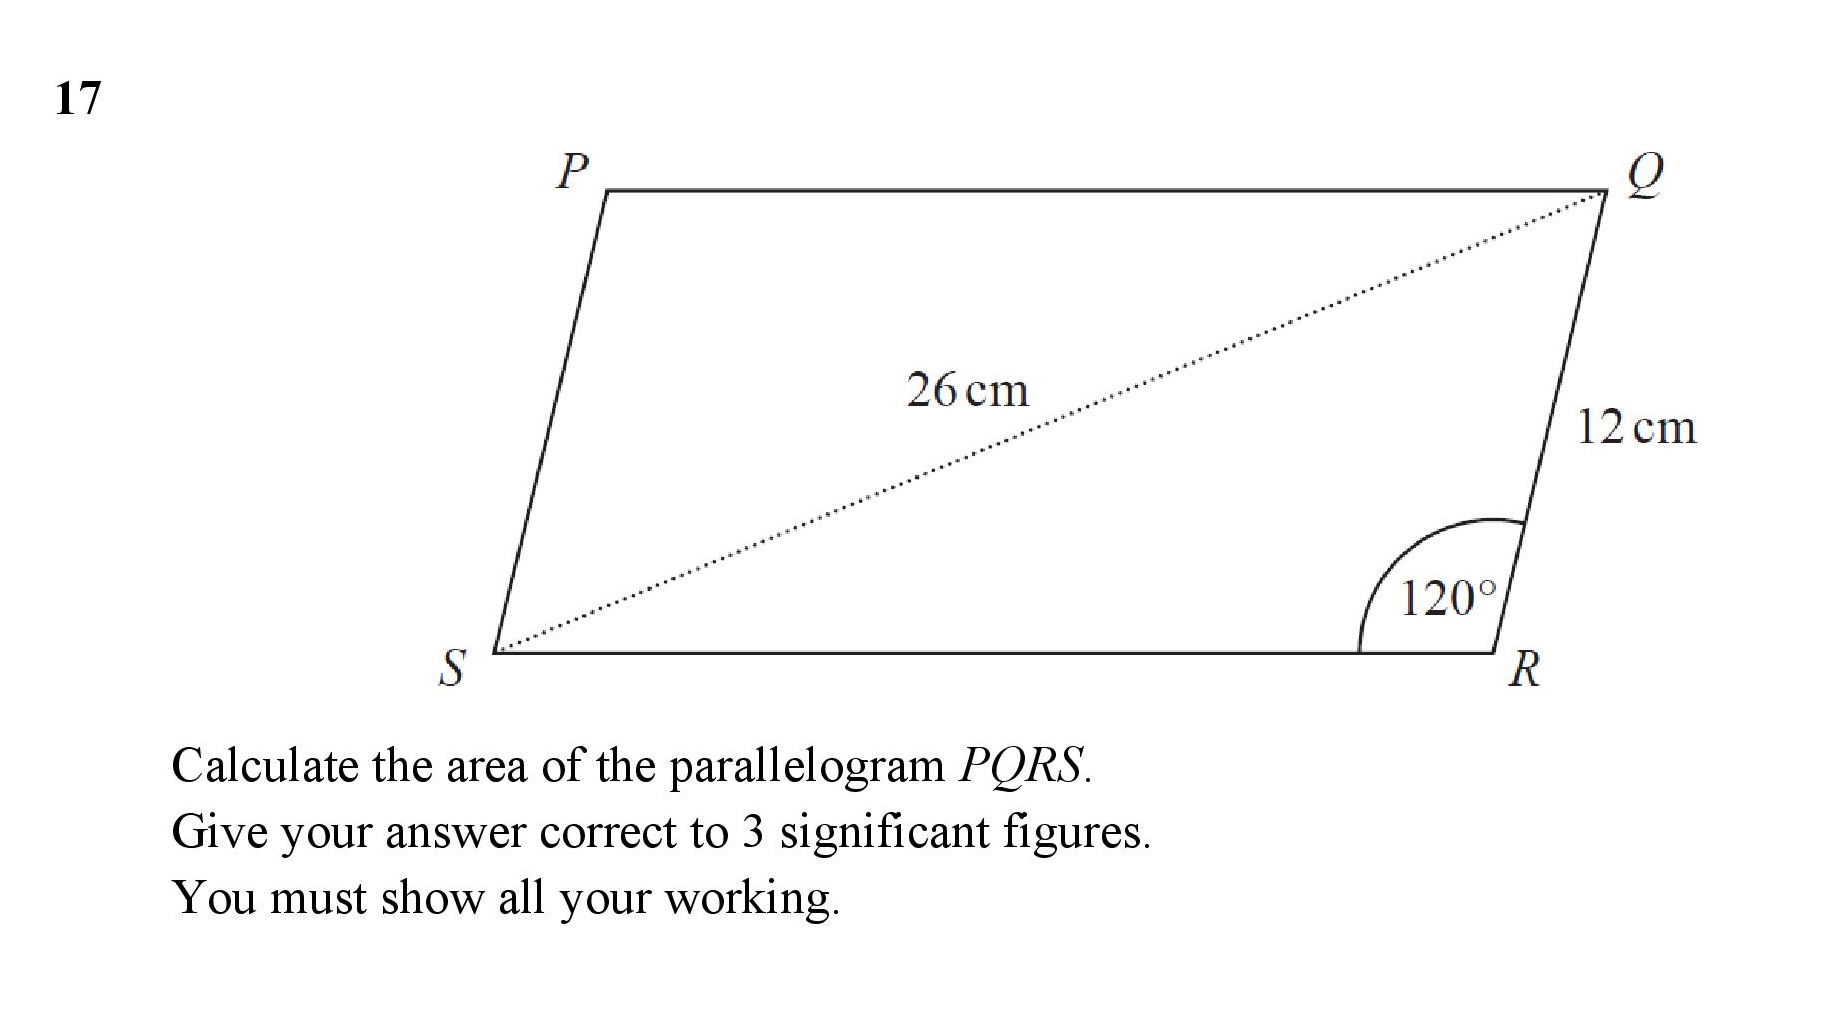
| Combined Sine and Cosine Rules | 1 | 5 | 0.2 | 0.14 | 0.06 | |
| y-intercept of a Real Life Graph | 1 | 1 | 1.5 | 0.65 | 0.85 | |
| Using a Real-Life Graph | 2 | 1 | 1 | 0.7 | 0.3 | |
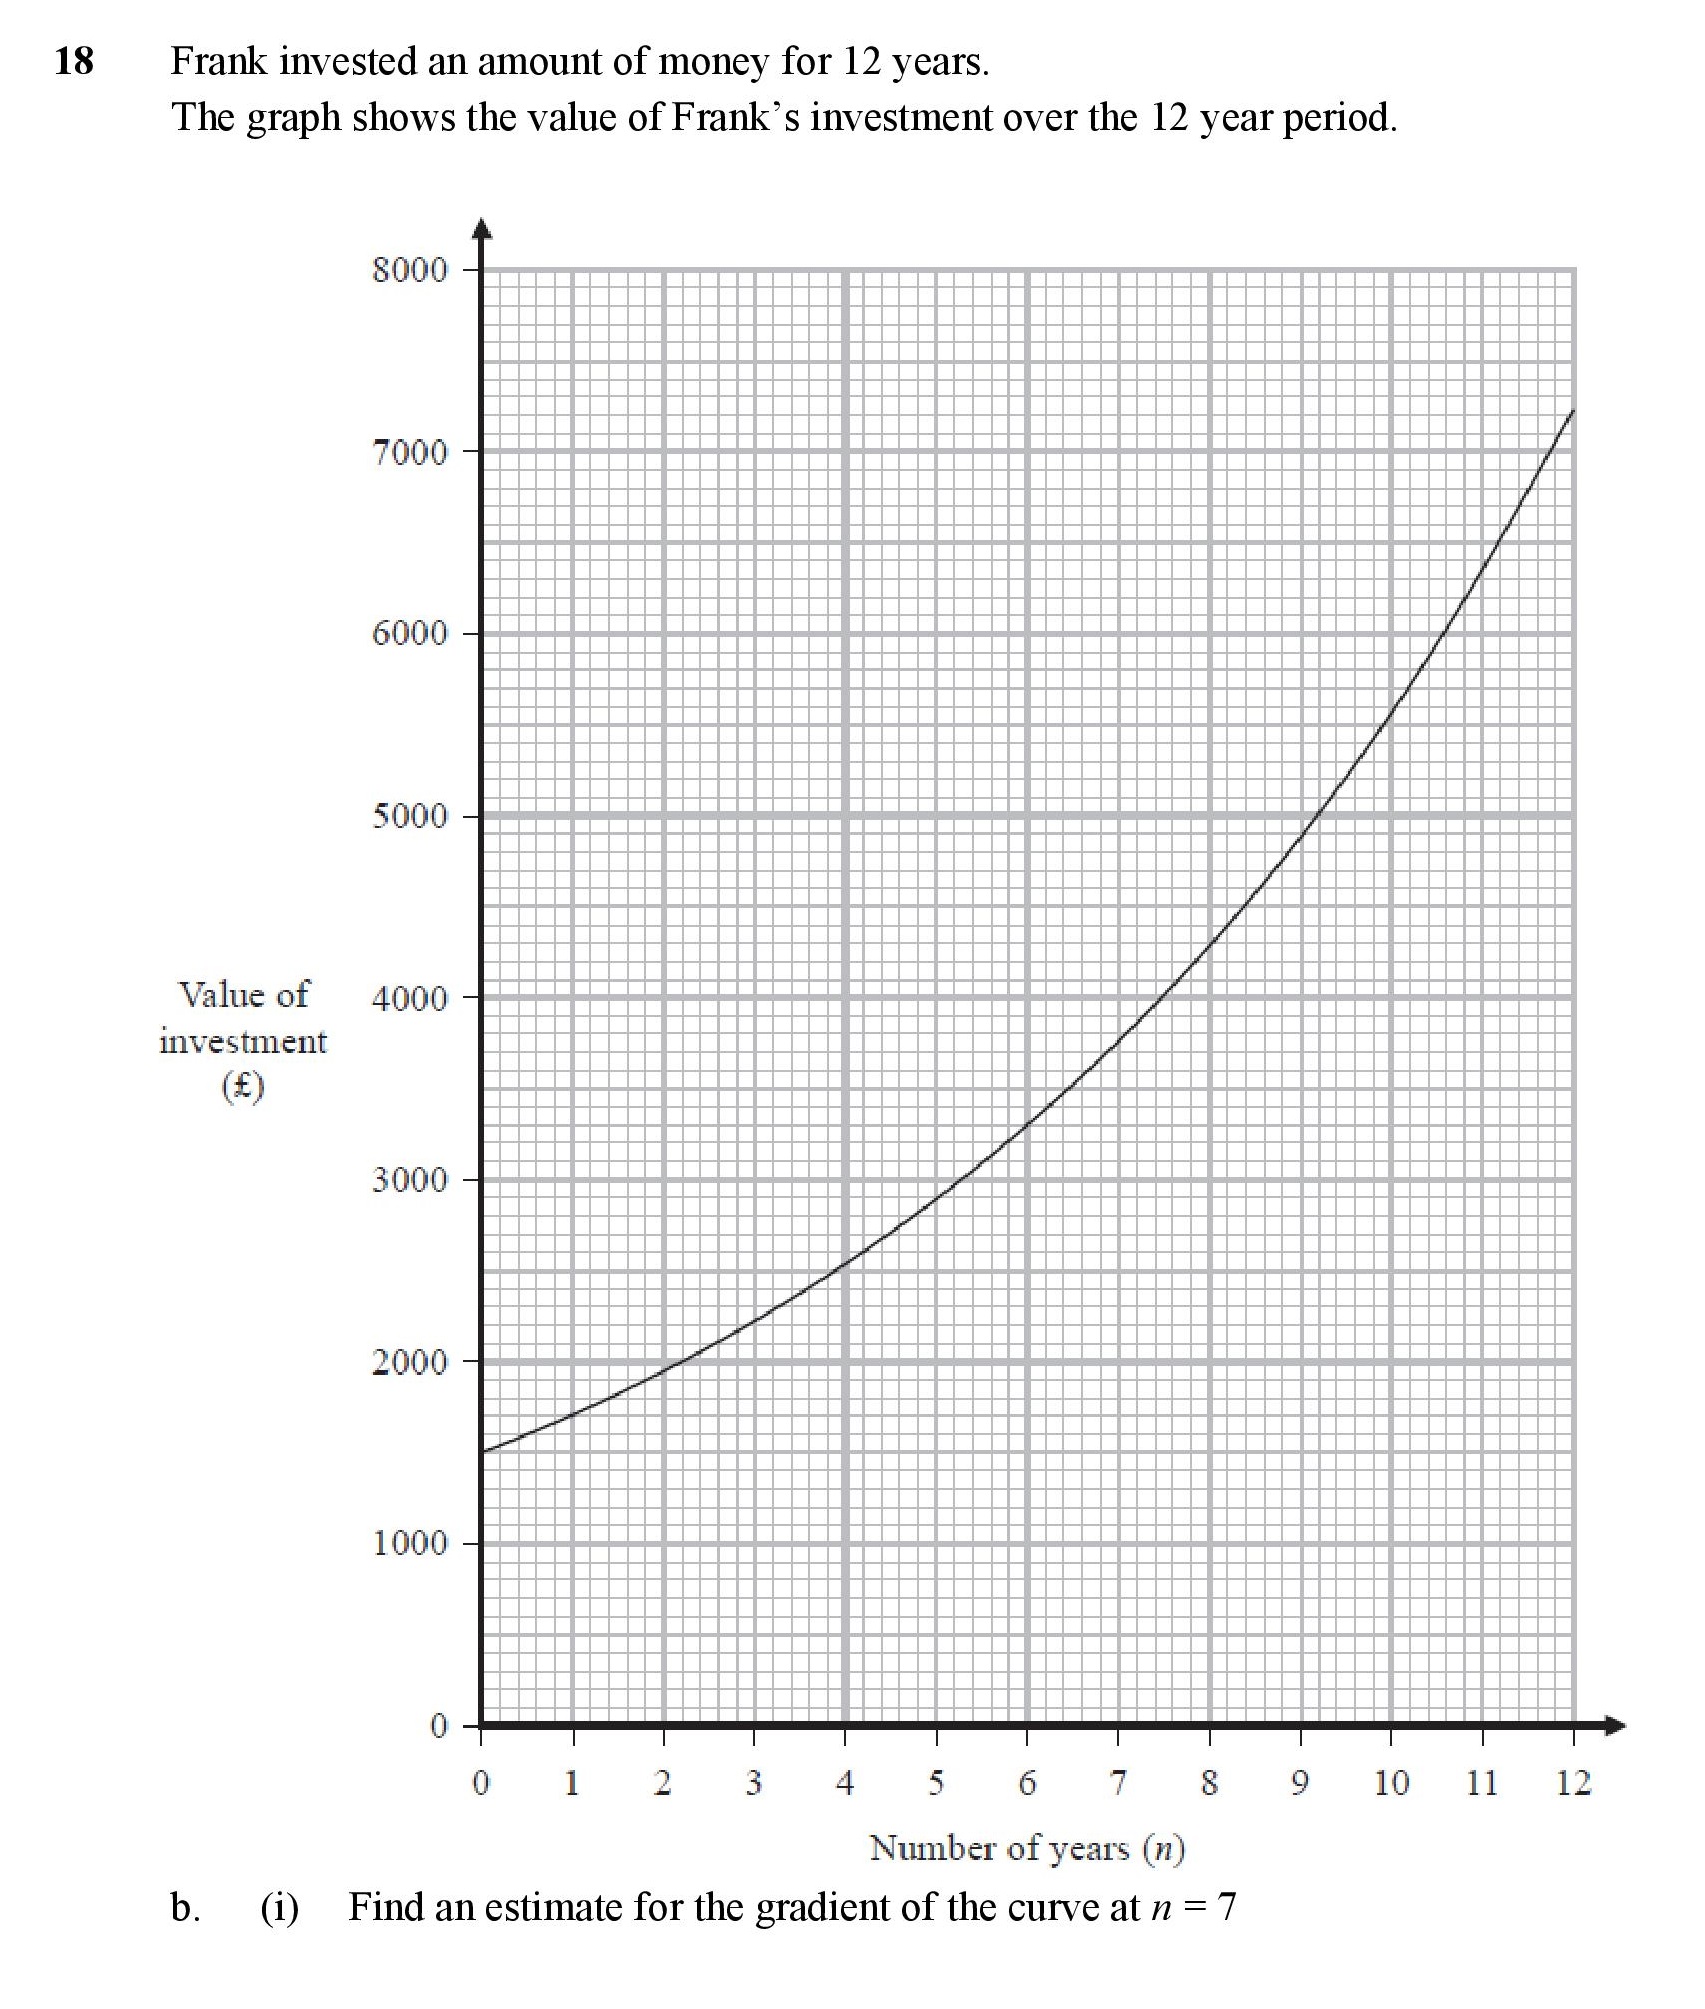
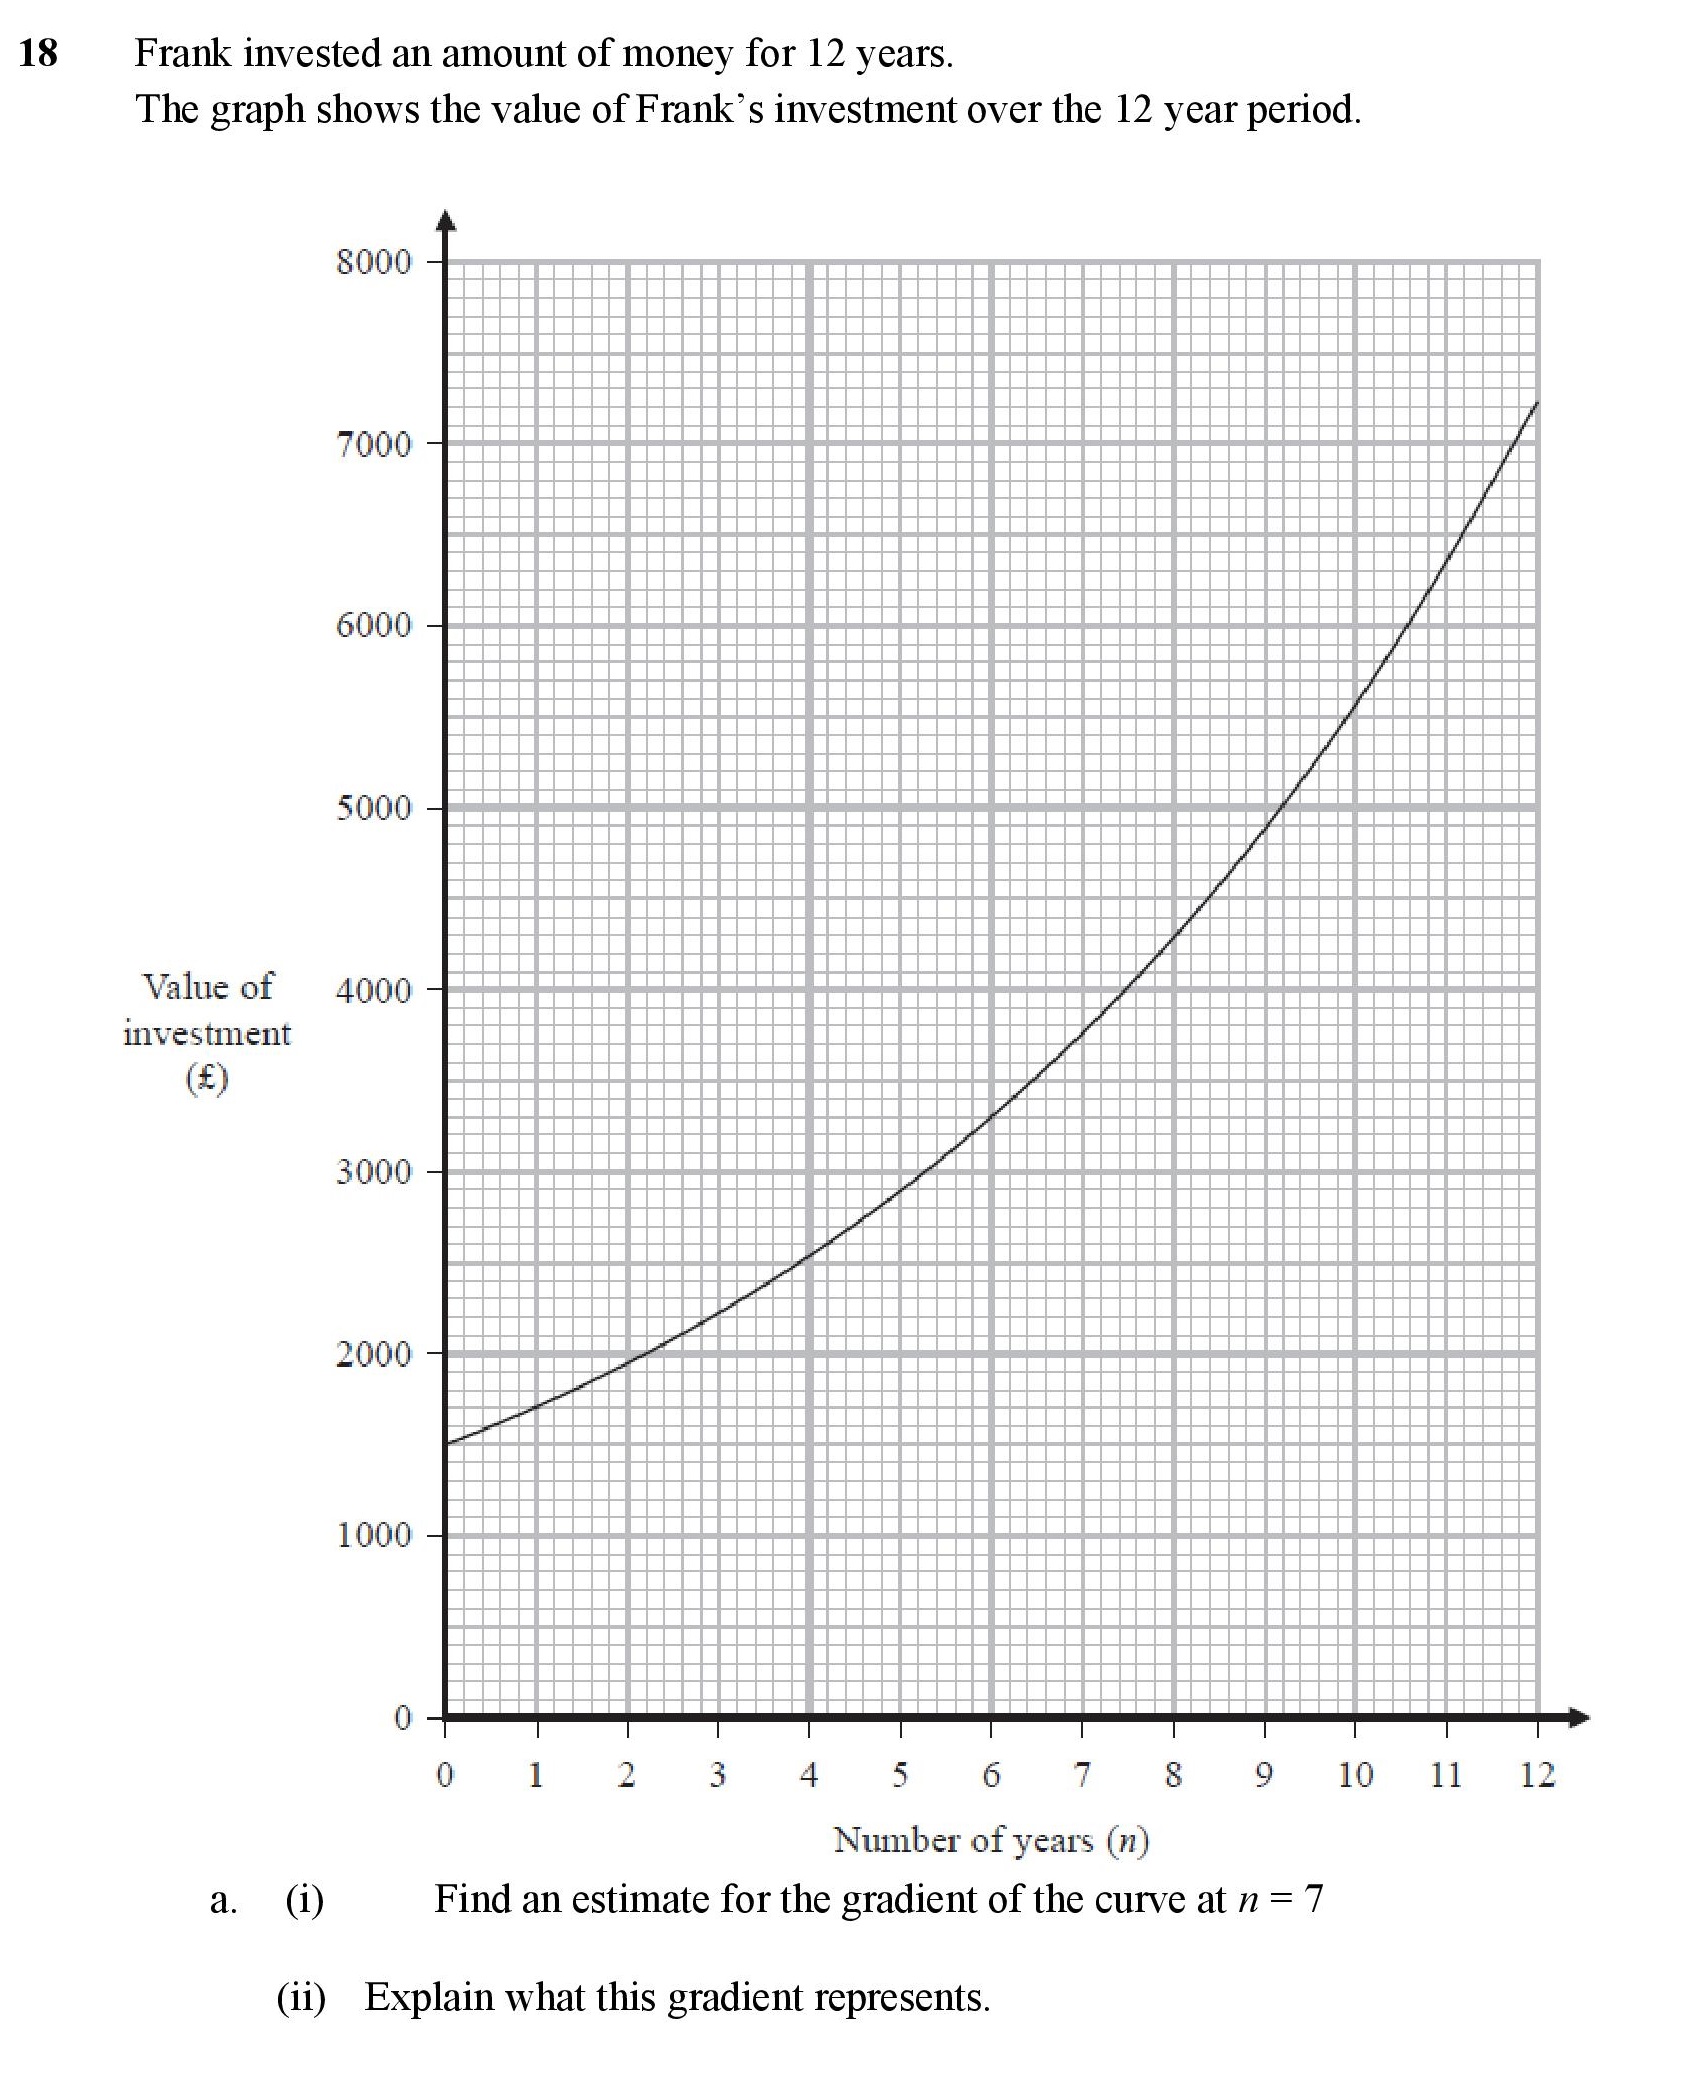
| Estimating Gradient from Speed Time Graph | 1 | 3 | 0.5 | 0.2 | 0.3 | |
| Evaluate Meaning of Gradient | 2 | 1 | 1 | 0.22 | 0.78 | |
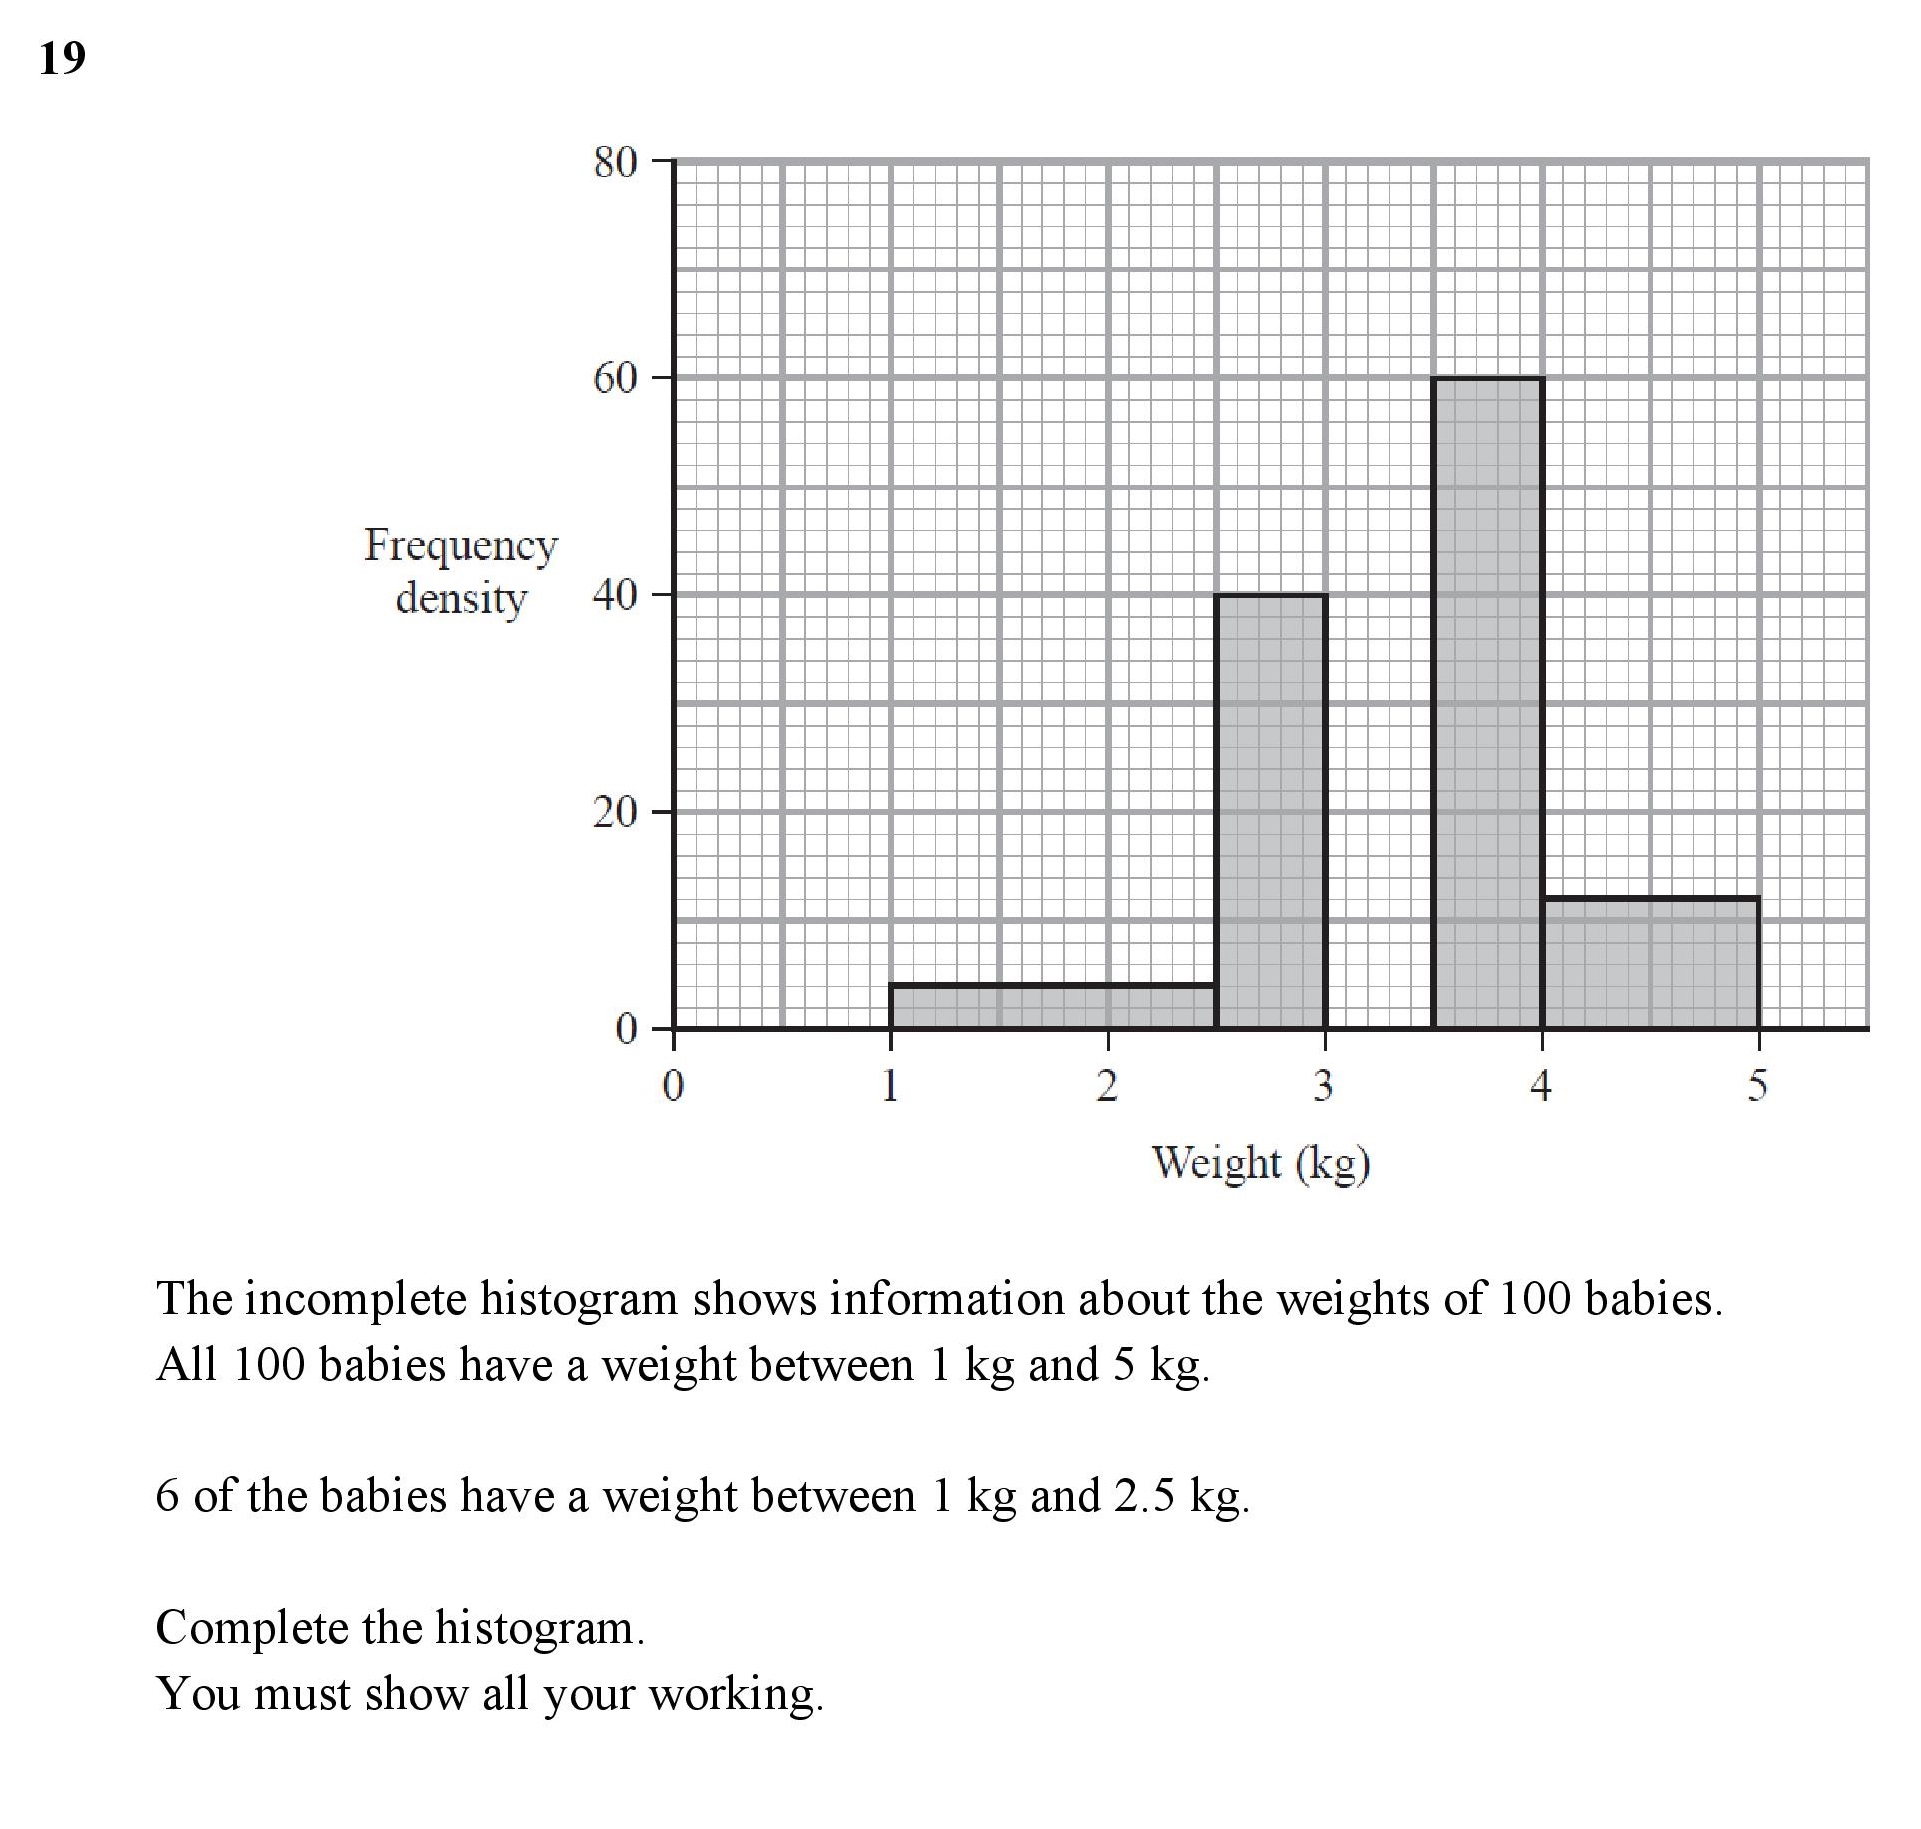
| Histograms | 2 | 4 | 0.38 | 0.28 | 0.1 | |
| Tree Diagram Problems | 3 | 4 | 0.25 | 0.21 | 0.04 | |
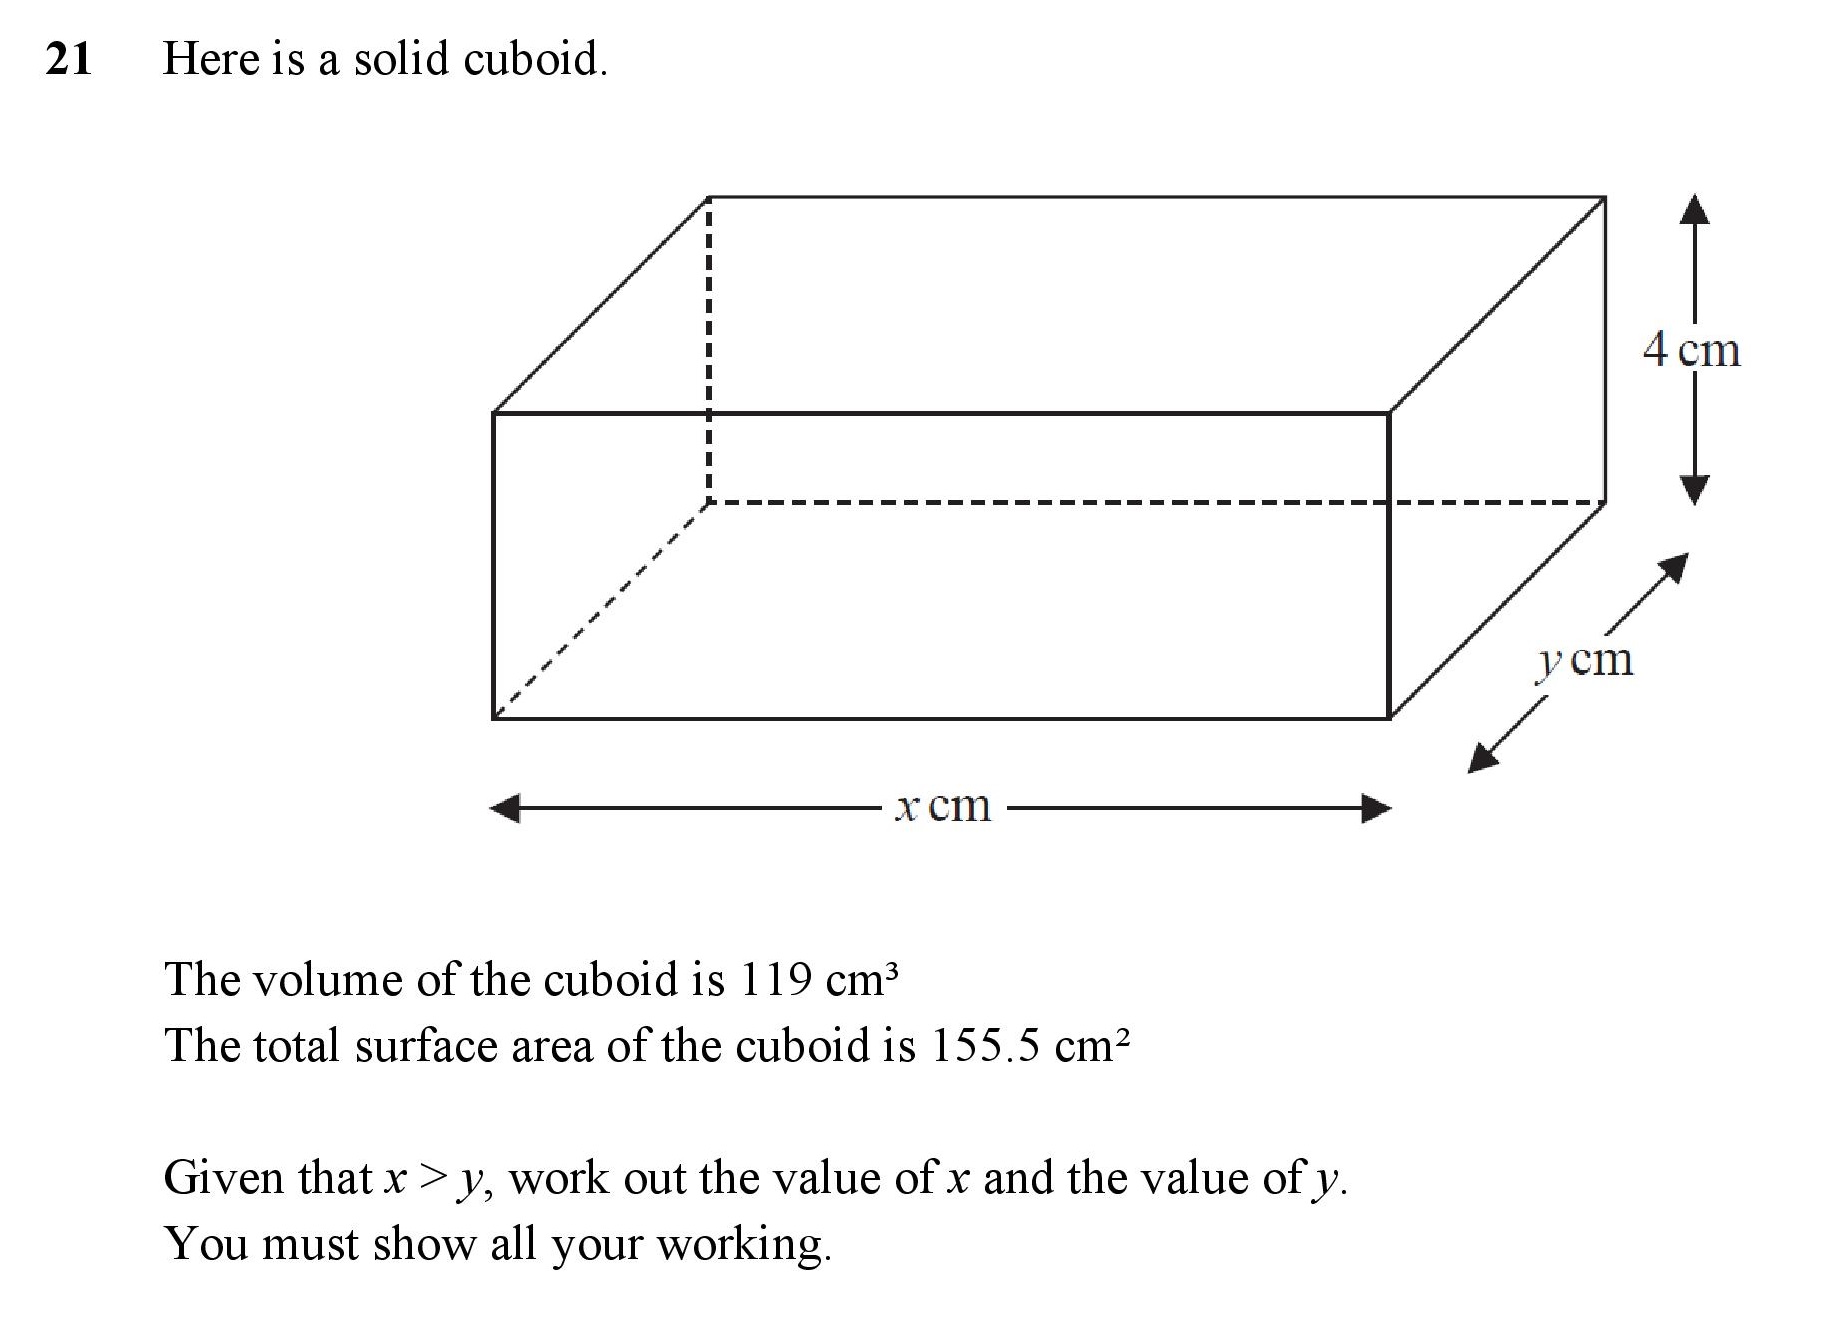
| Volume and Surface Area Problems | 3 | 5 | 0.3 | 0.17 | 0.13 |