Einstein QLA: Its all relative!
Average marks for your class or department are compared to all the other pinpoint schools
who have uploaded for this test.
Average marks for your class or department are compared to all the other pinpoint schools
who have uploaded for this test.
| Question | Topic | AO Strand | Max Mark | SetA Average per mark | Pinpoint Average | Average Difference |
|---|---|---|---|---|---|---|
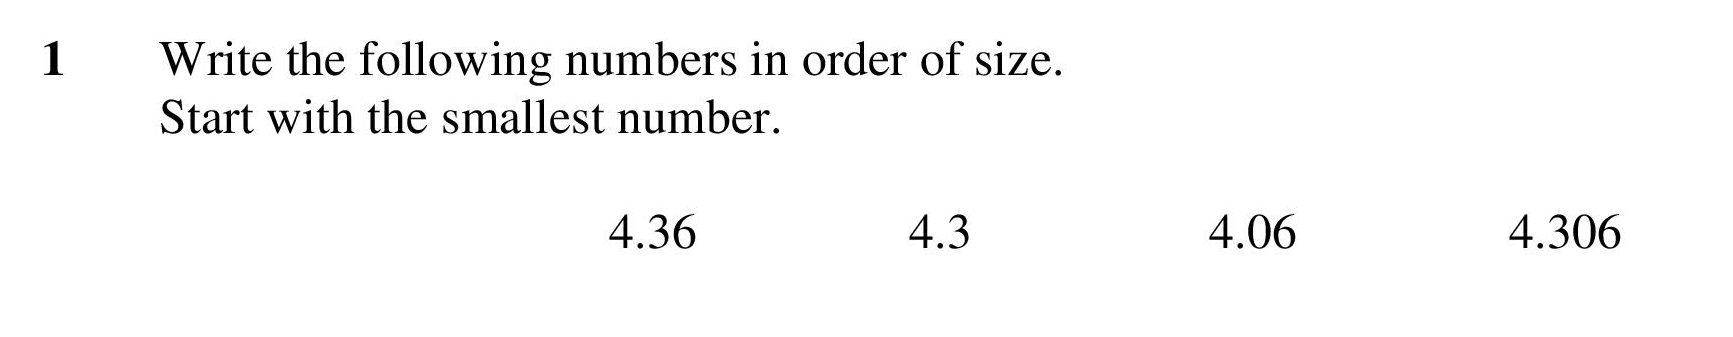
| Ordering Numbers | 1 | 1 | 1 | 0.59 | 0.41 | |
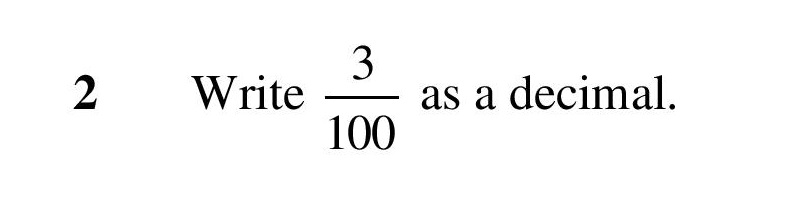
| Fraction to DecimalTopics lack hundreths exam | 1 | 1 | 0.5 | 0.68 | -0.18 | |
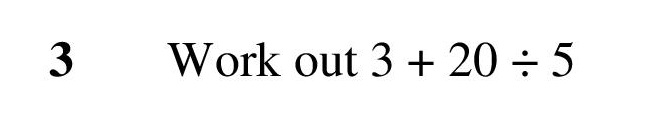
| Powers, Roots and BIDMAS | 1 | 1 | 1 | 0.77 | 0.23 | |
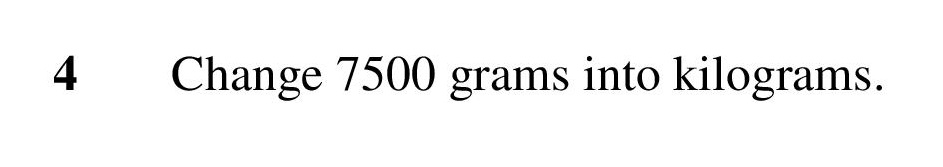
| Metric Conversions | 1 | 1 | 0.5 | 0.62 | -0.12 | |
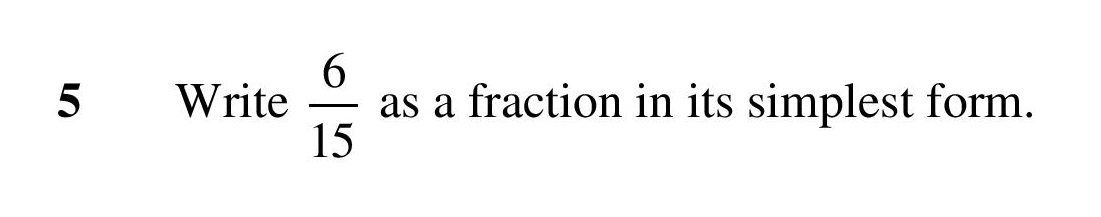
| Equivalent Fractions | 1 | 1 | 1 | 0.64 | 0.36 | |
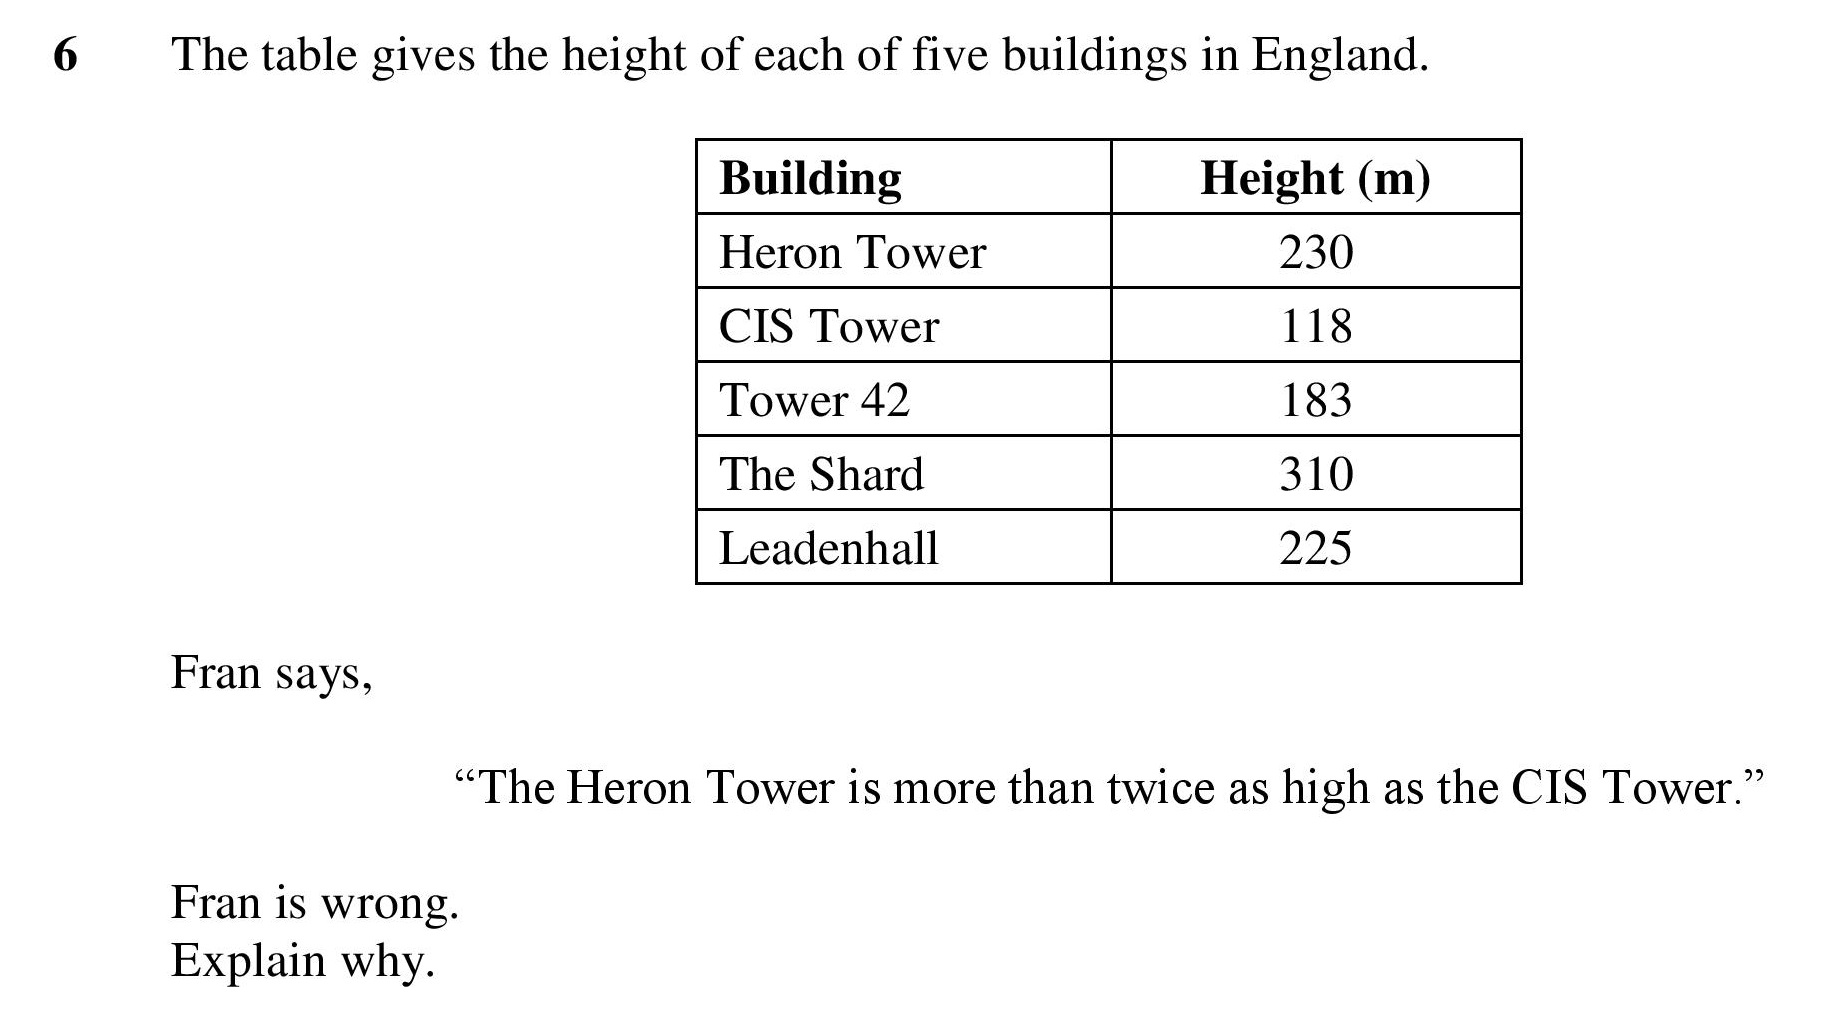
| Calculations From Tables | 1 | 1 | 1 | 0.76 | 0.24 | |
| Averages and Range | 1 | 1 | 1.5 | 0.71 | 0.79 | |
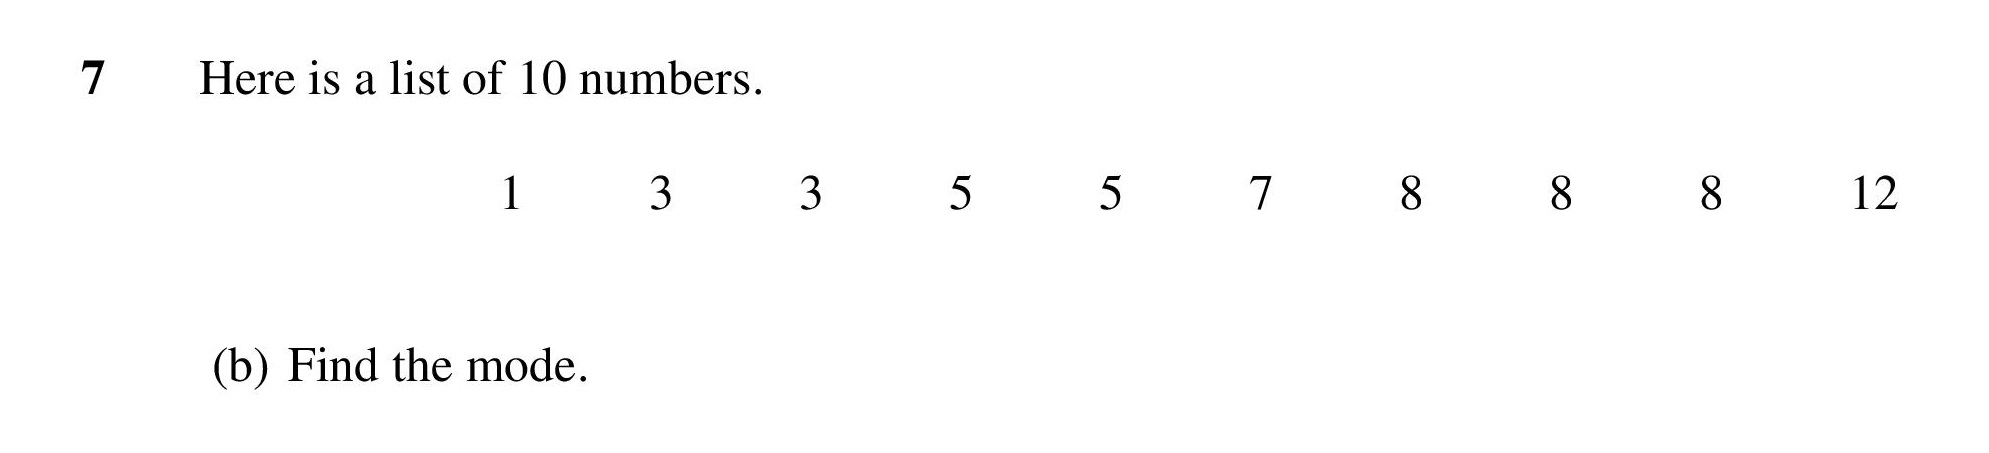
| Finding the Mode | 1 | 1 | 1 | 0.77 | 0.23 | |
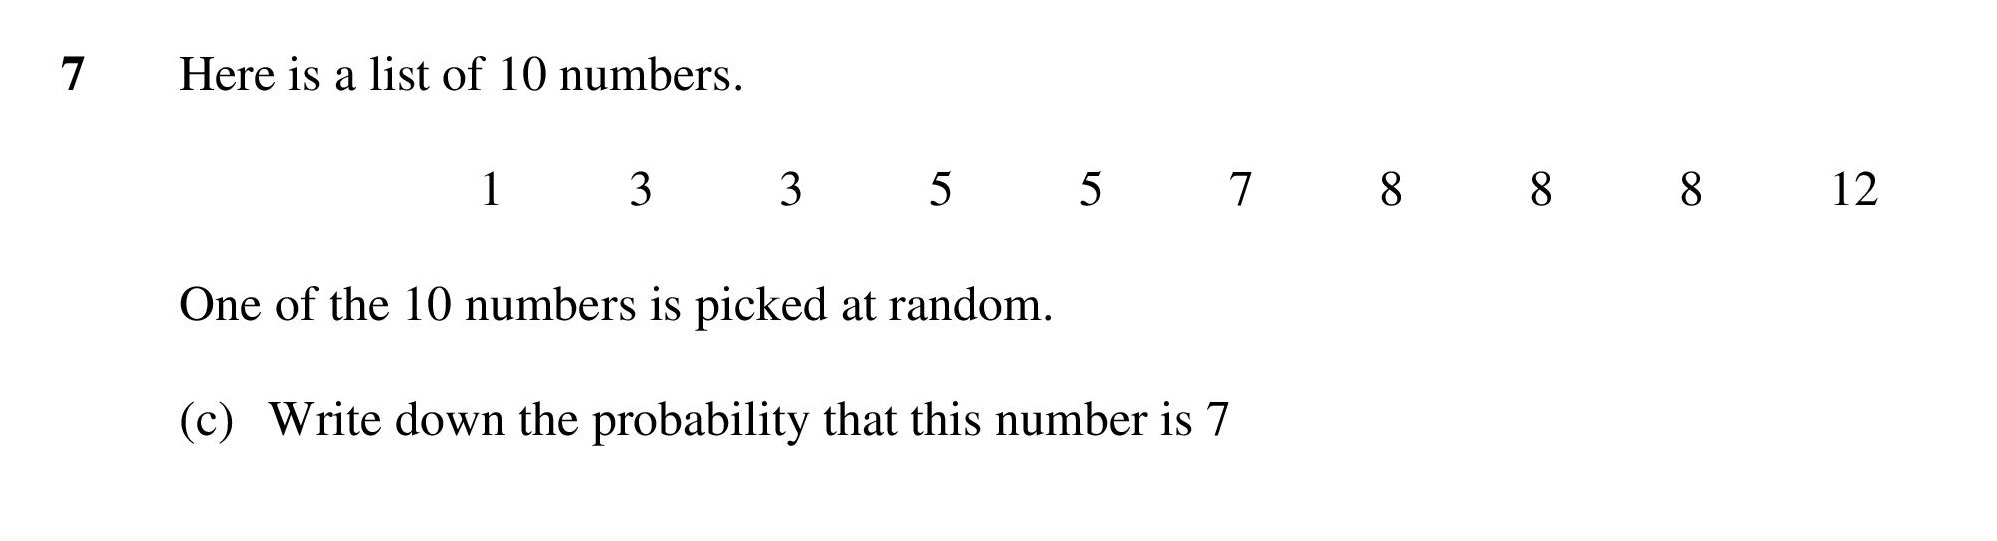
| Simple Probability | 1 | 1 | 1.5 | 0.78 | 0.72 | |
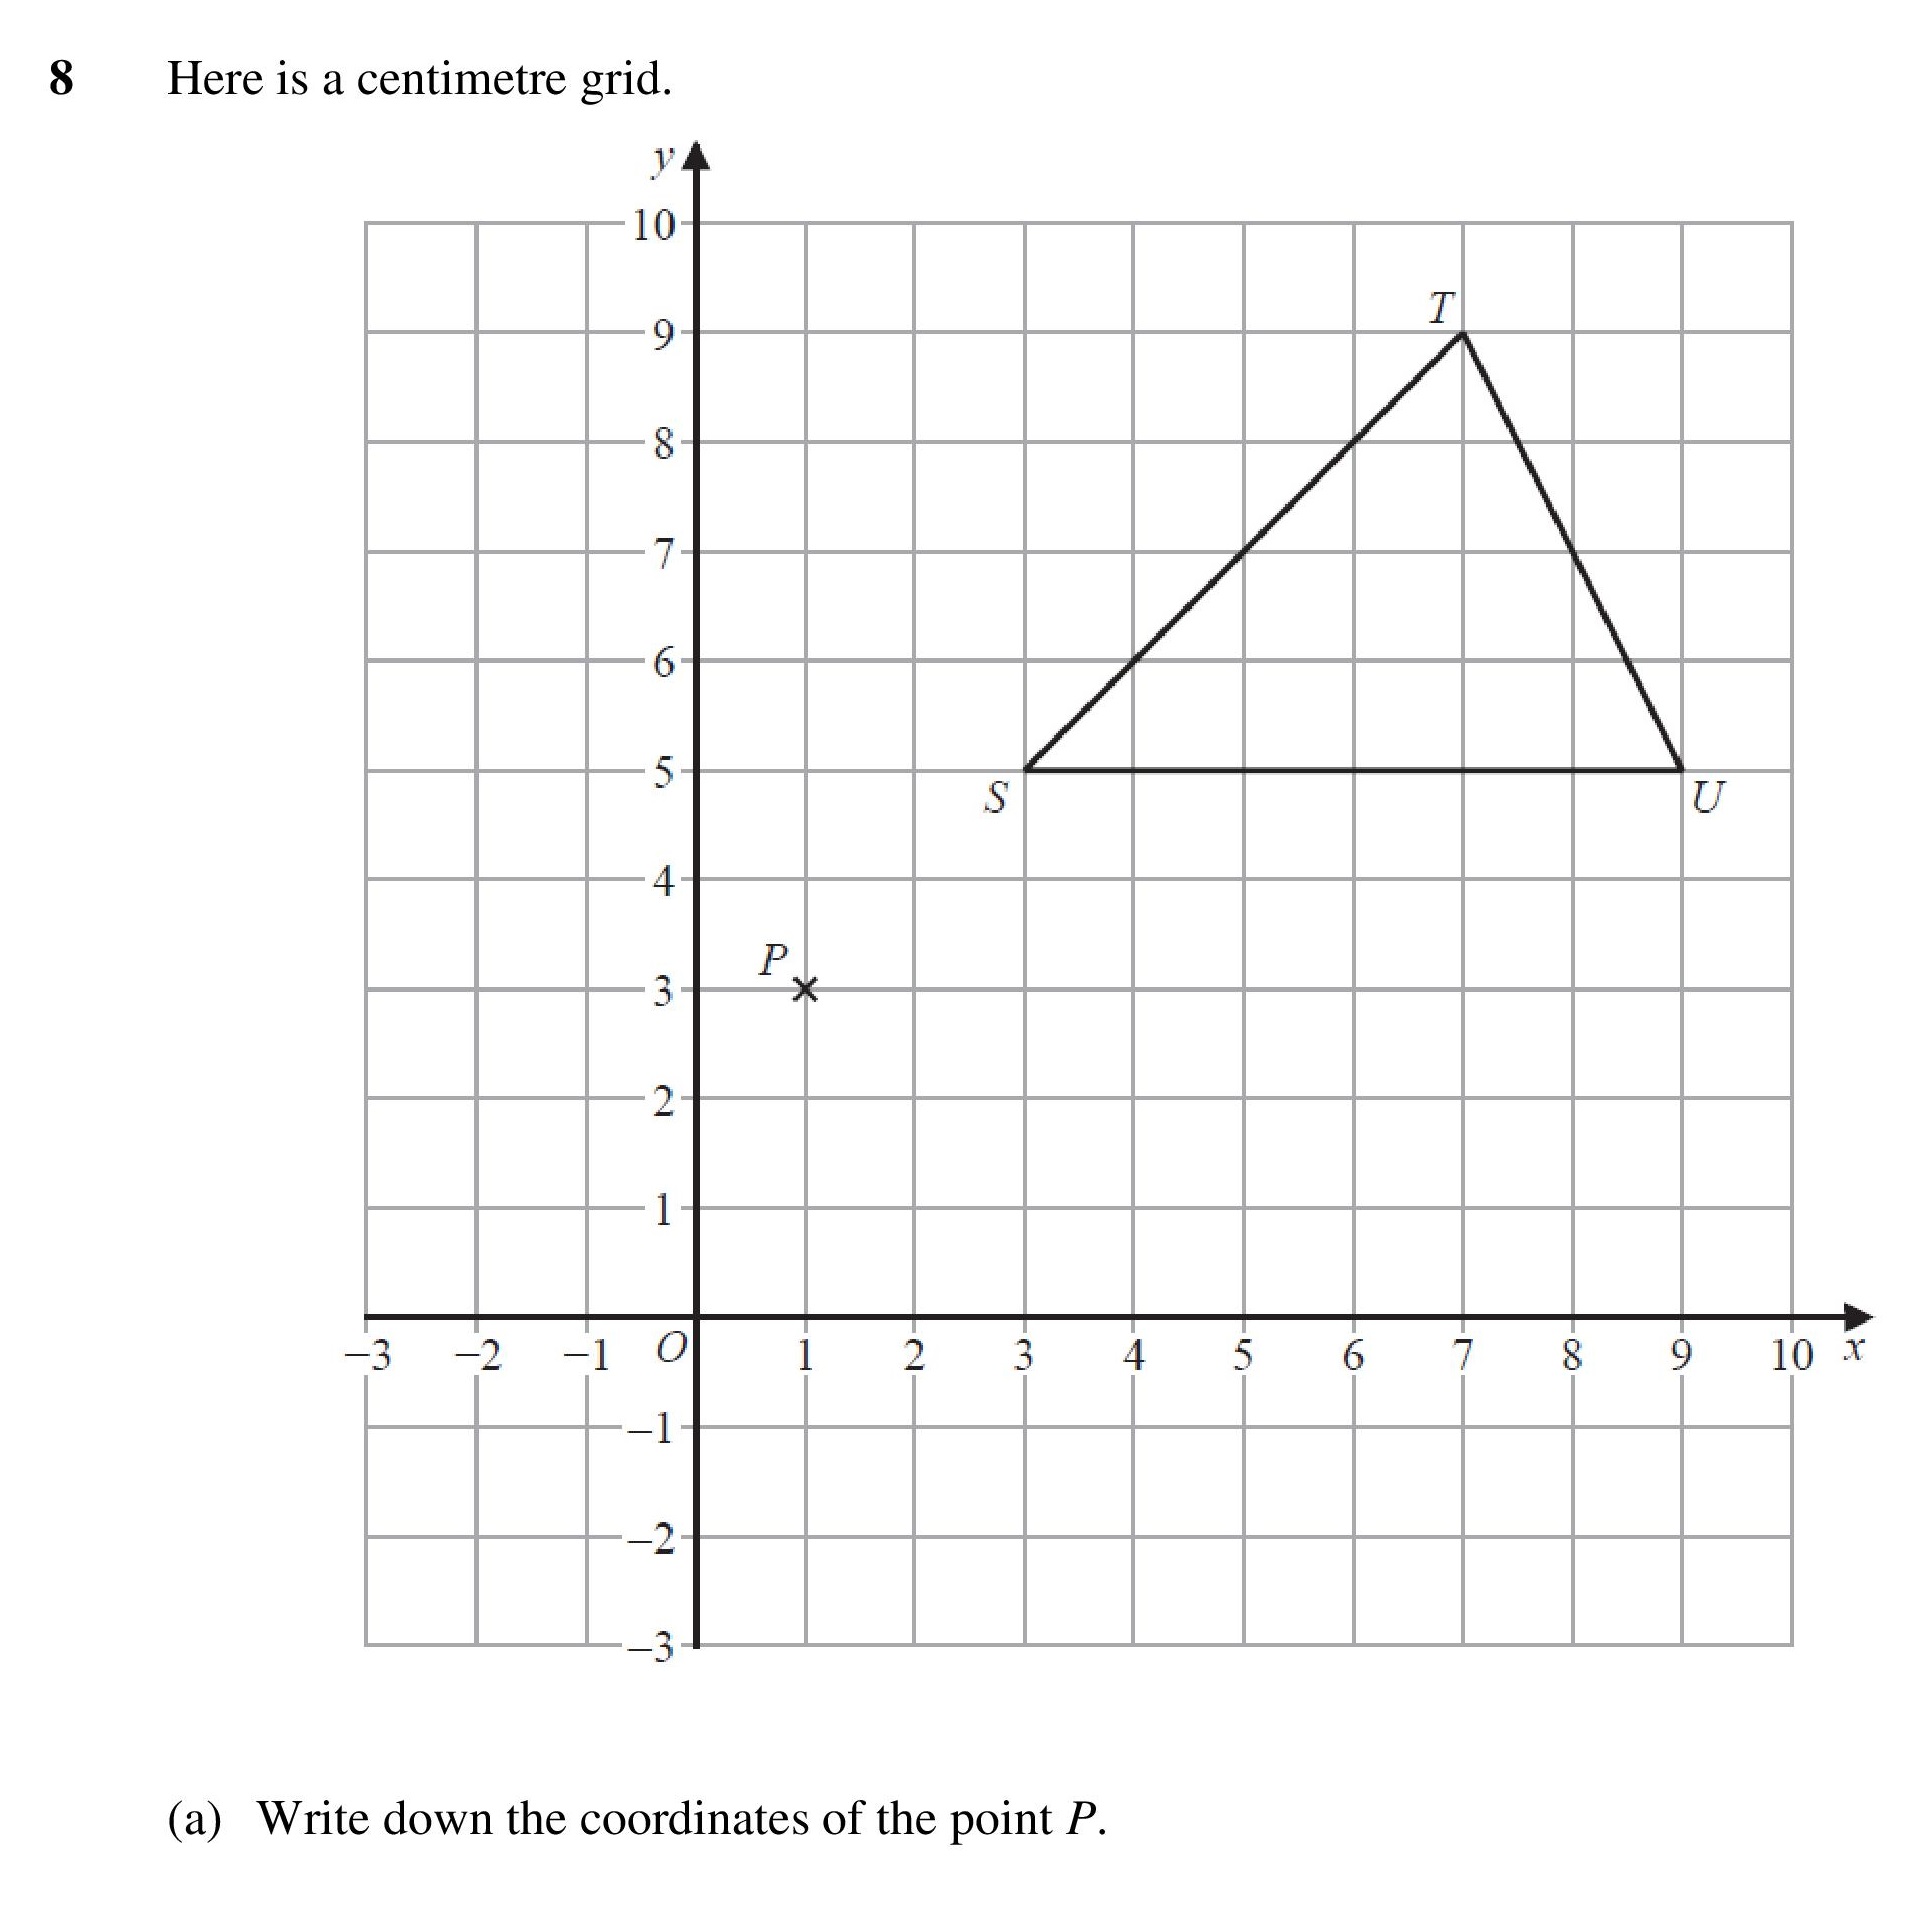
| State a Coordinate | 1 | 1 | 1 | 0.9 | 0.1 | |
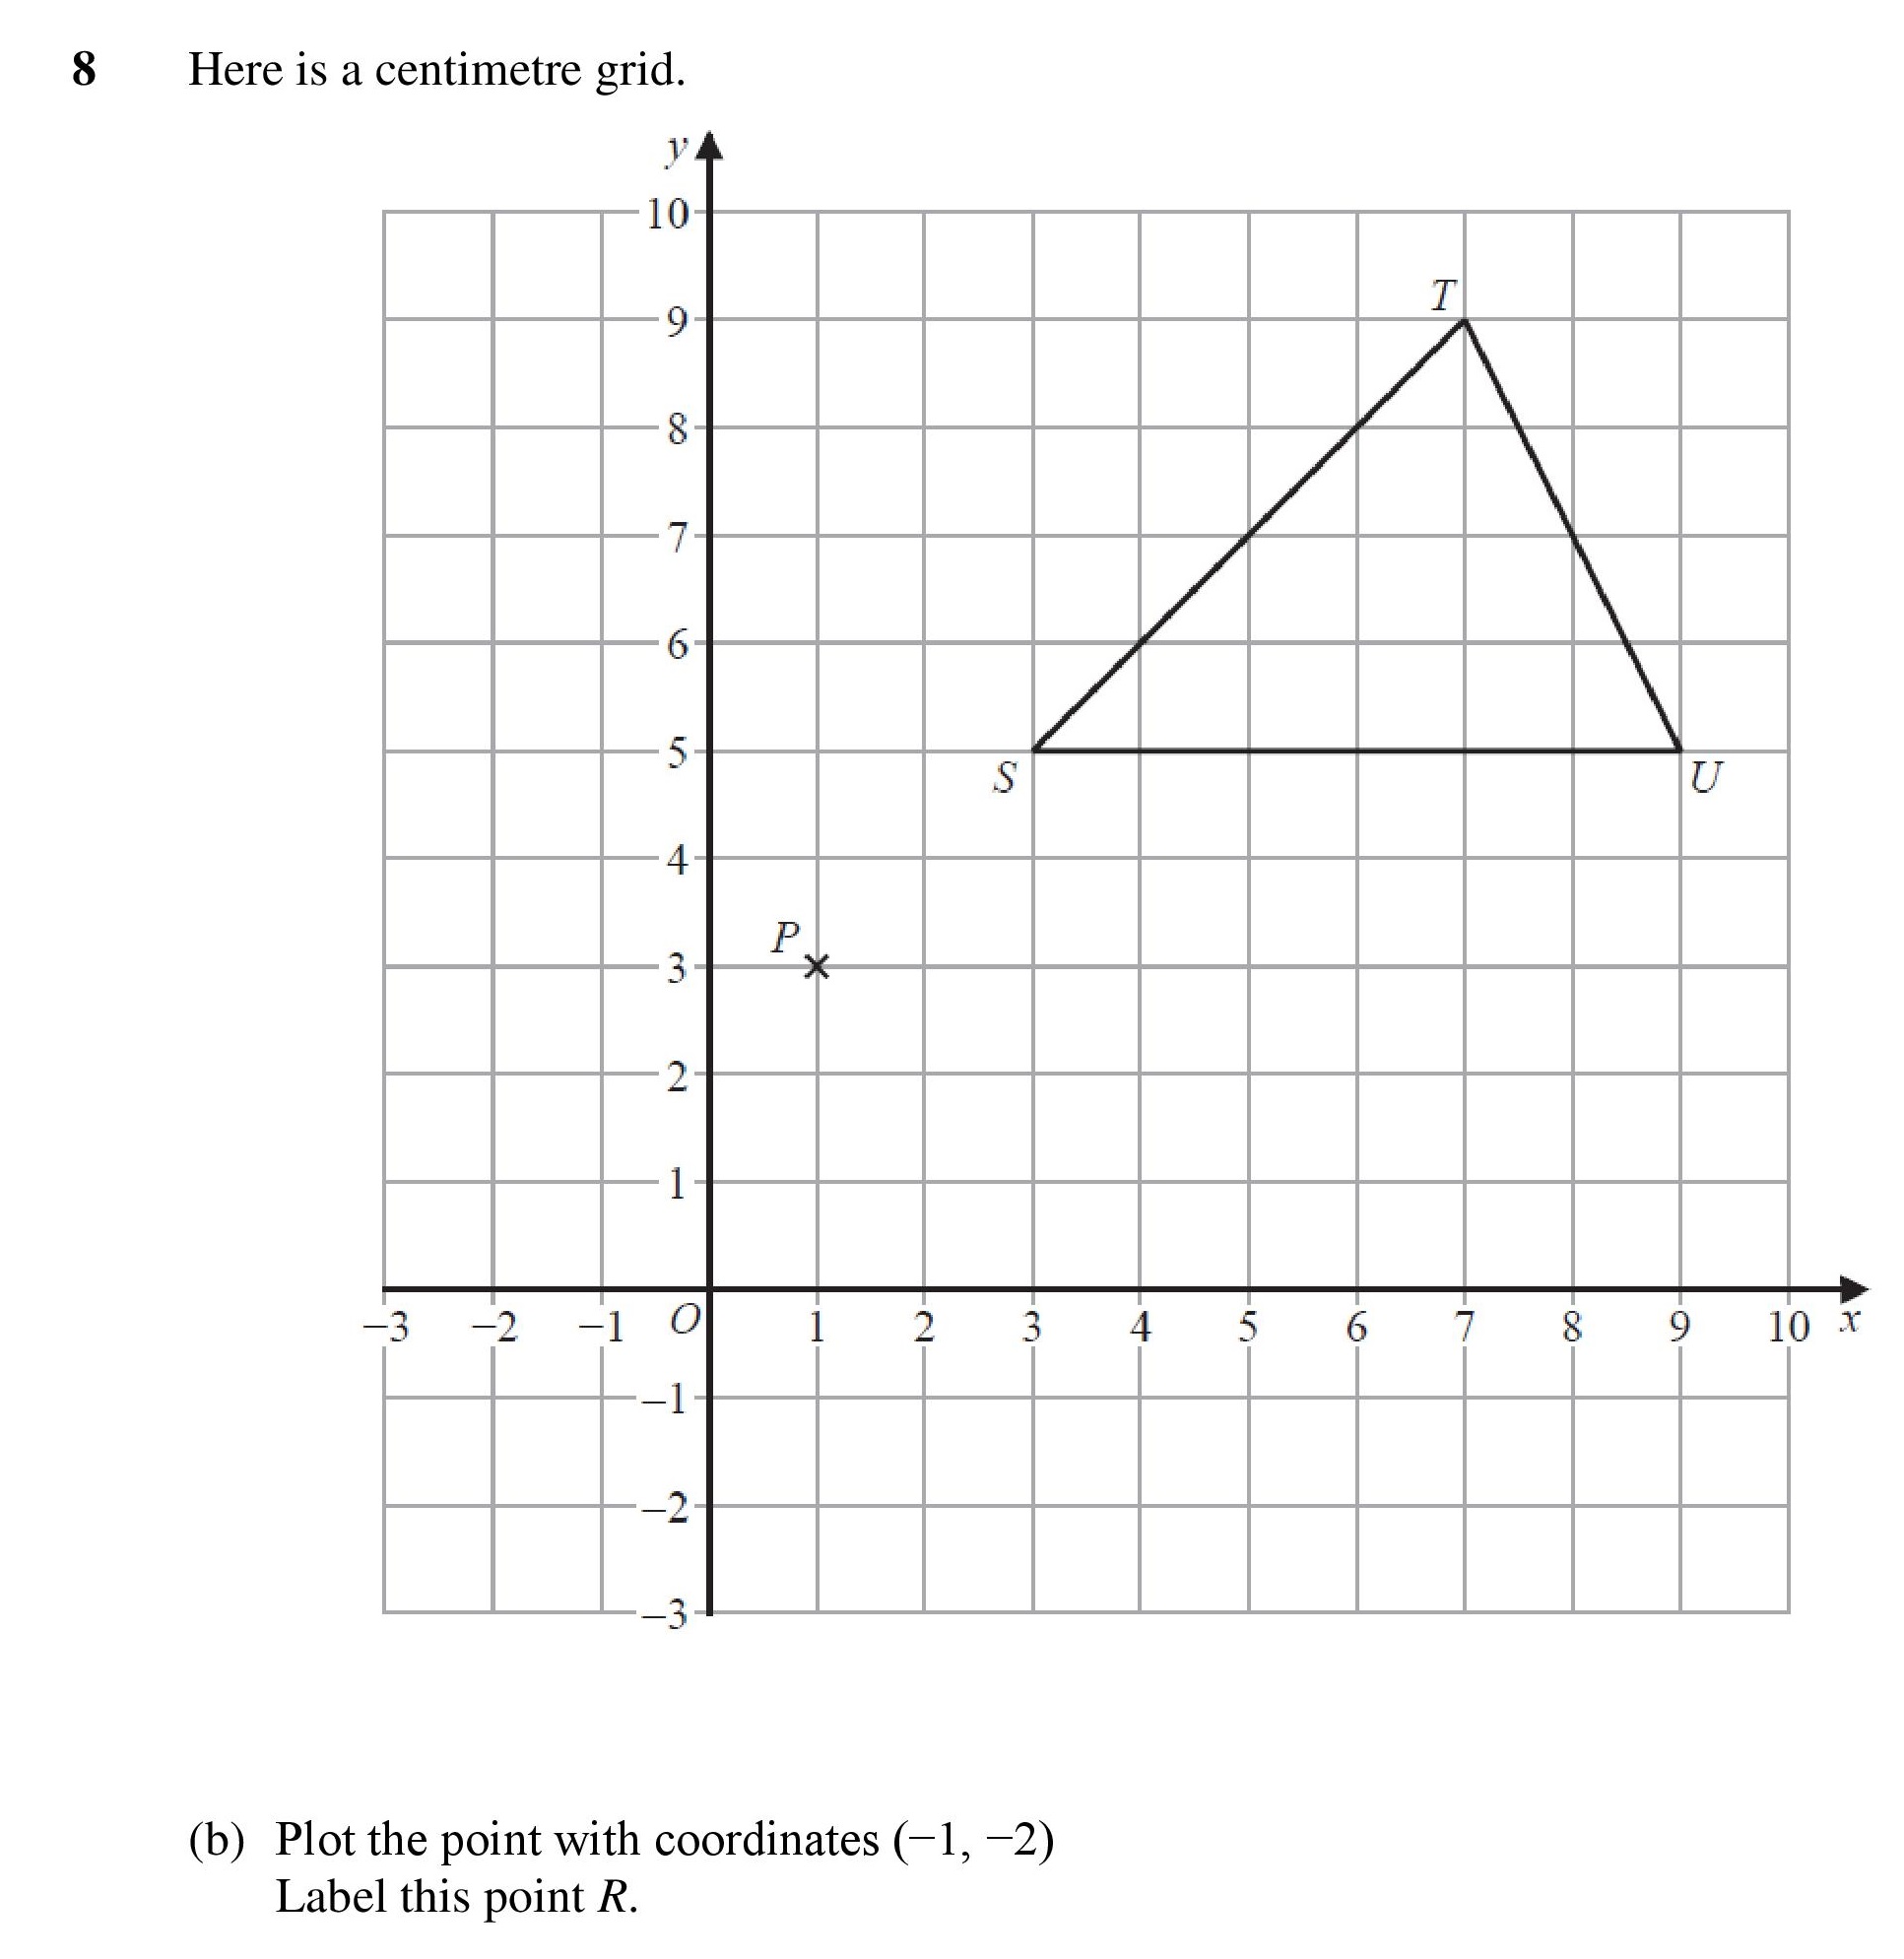
| Coordinates | 1 | 1 | 1.5 | 0.79 | 0.71 | |
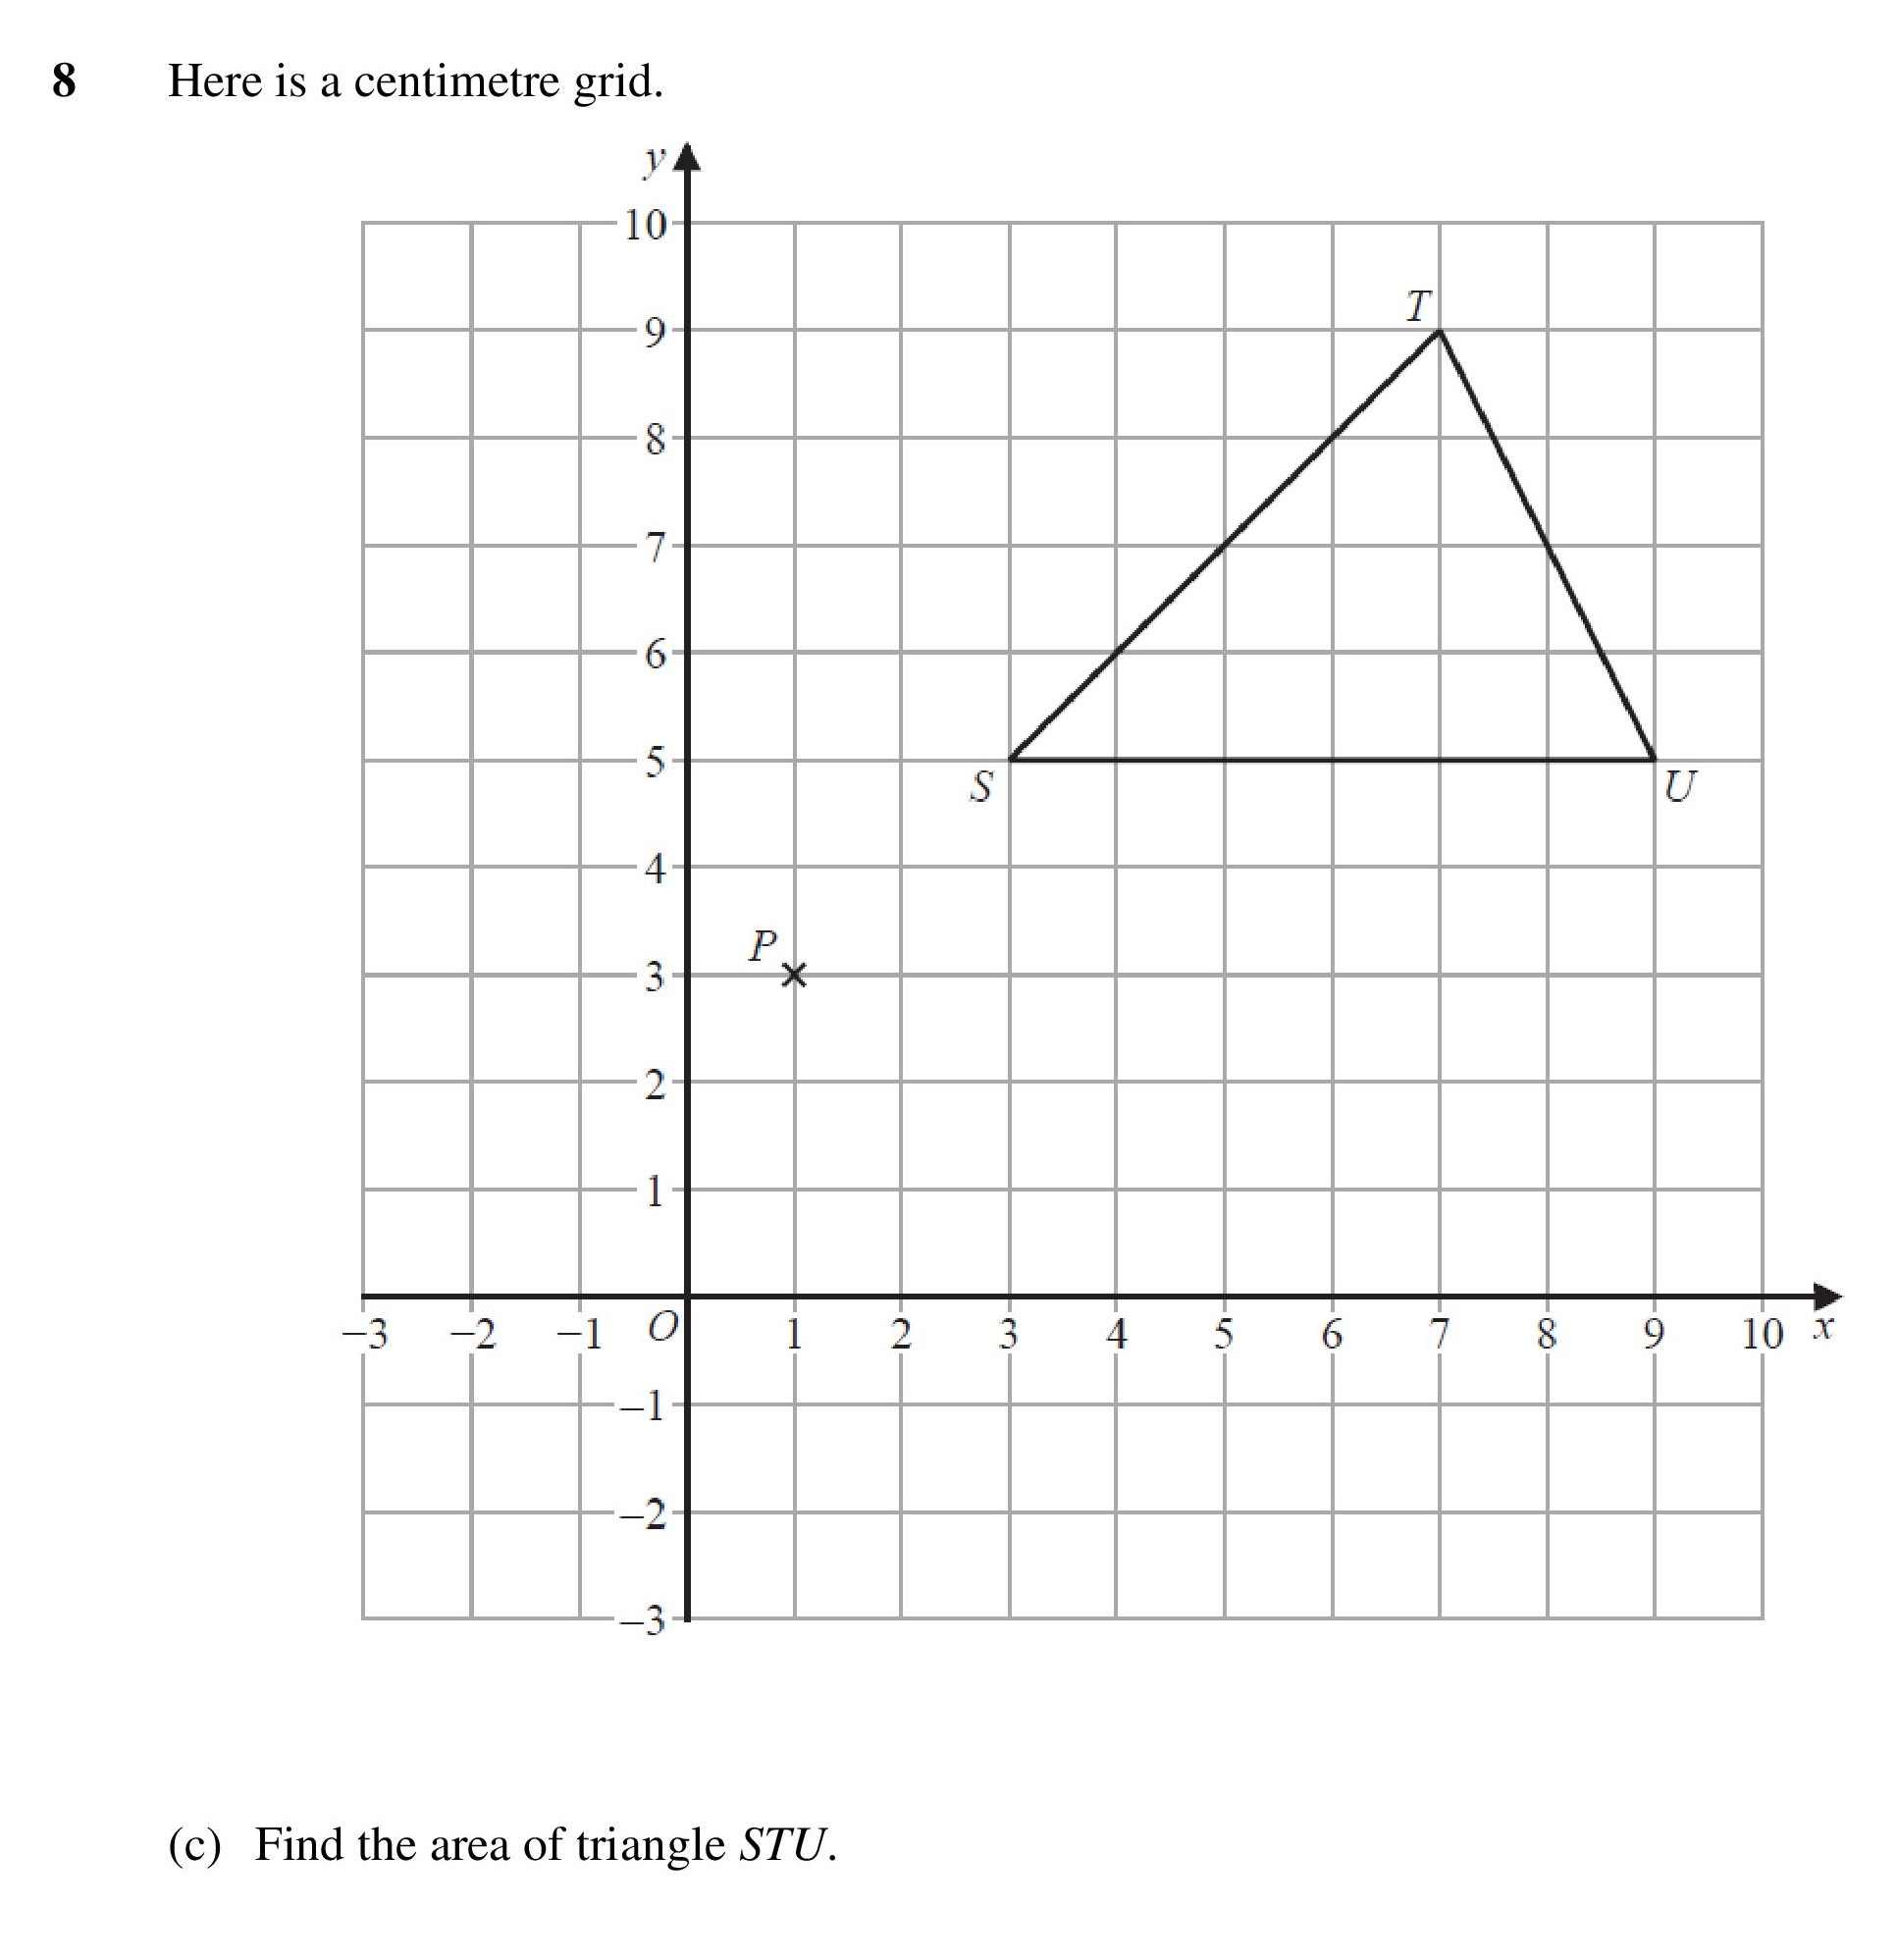
| Area of a Triangle | 1 | 2 | 0.5 | 0.44 | 0.06 | |
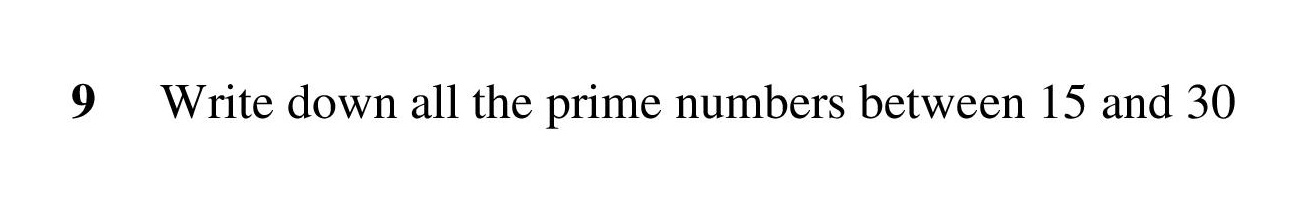
| Finding Primes | 1 | 2 | 0.75 | 0.52 | 0.23 | |
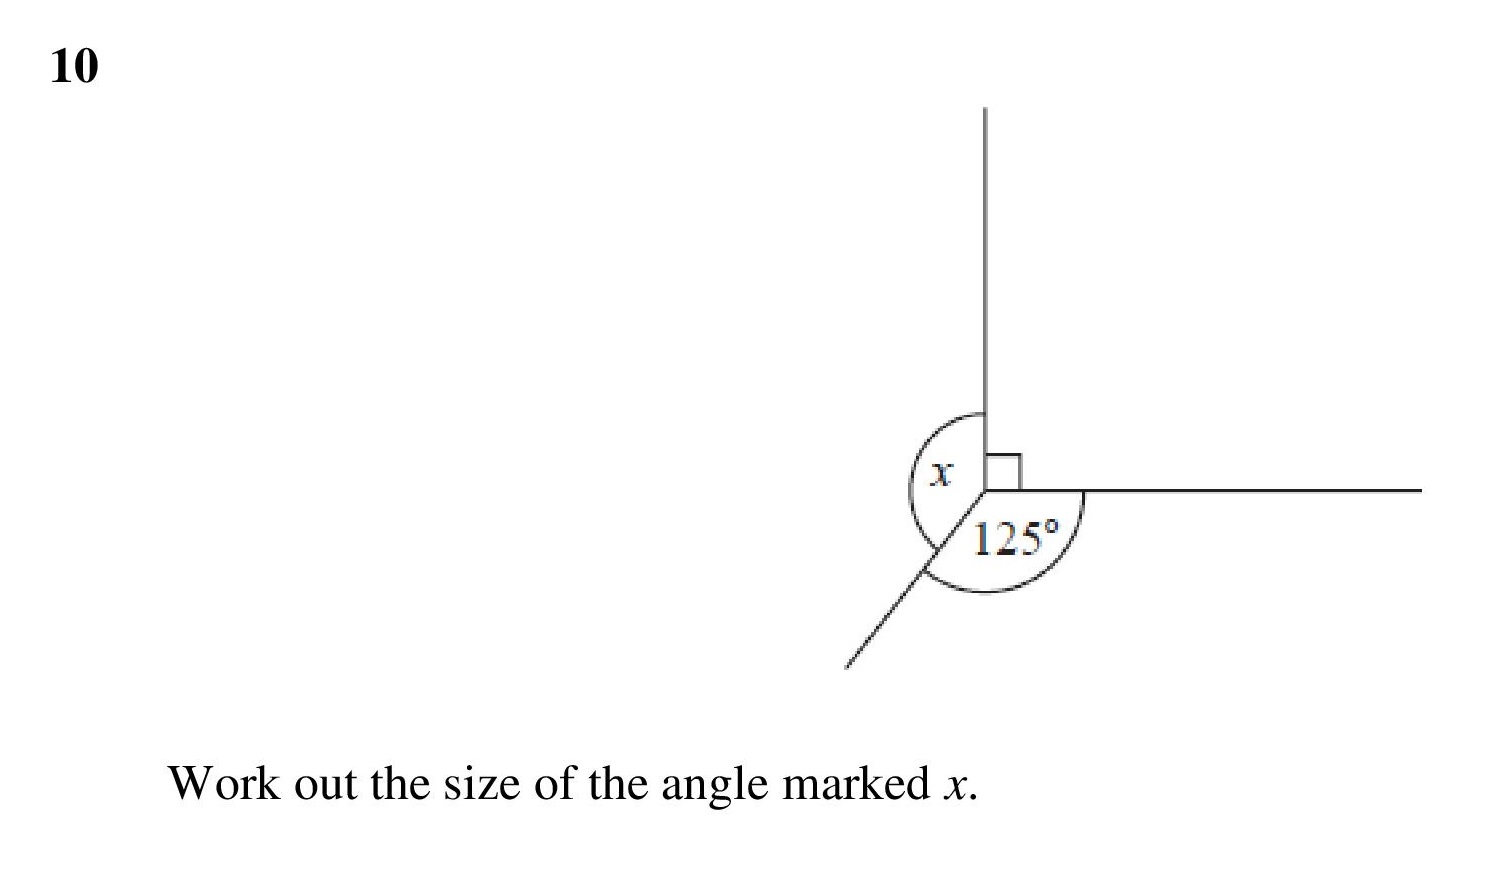
| Simple Angles | 1 | 2 | 0.5 | 0.69 | -0.19 | |
| Scales Diagrams | 1 | 3 | 0.5 | 0.22 | 0.28 | |
| Money Problems | 1 | 3 | 0.33 | 0.77 | -0.44 | |
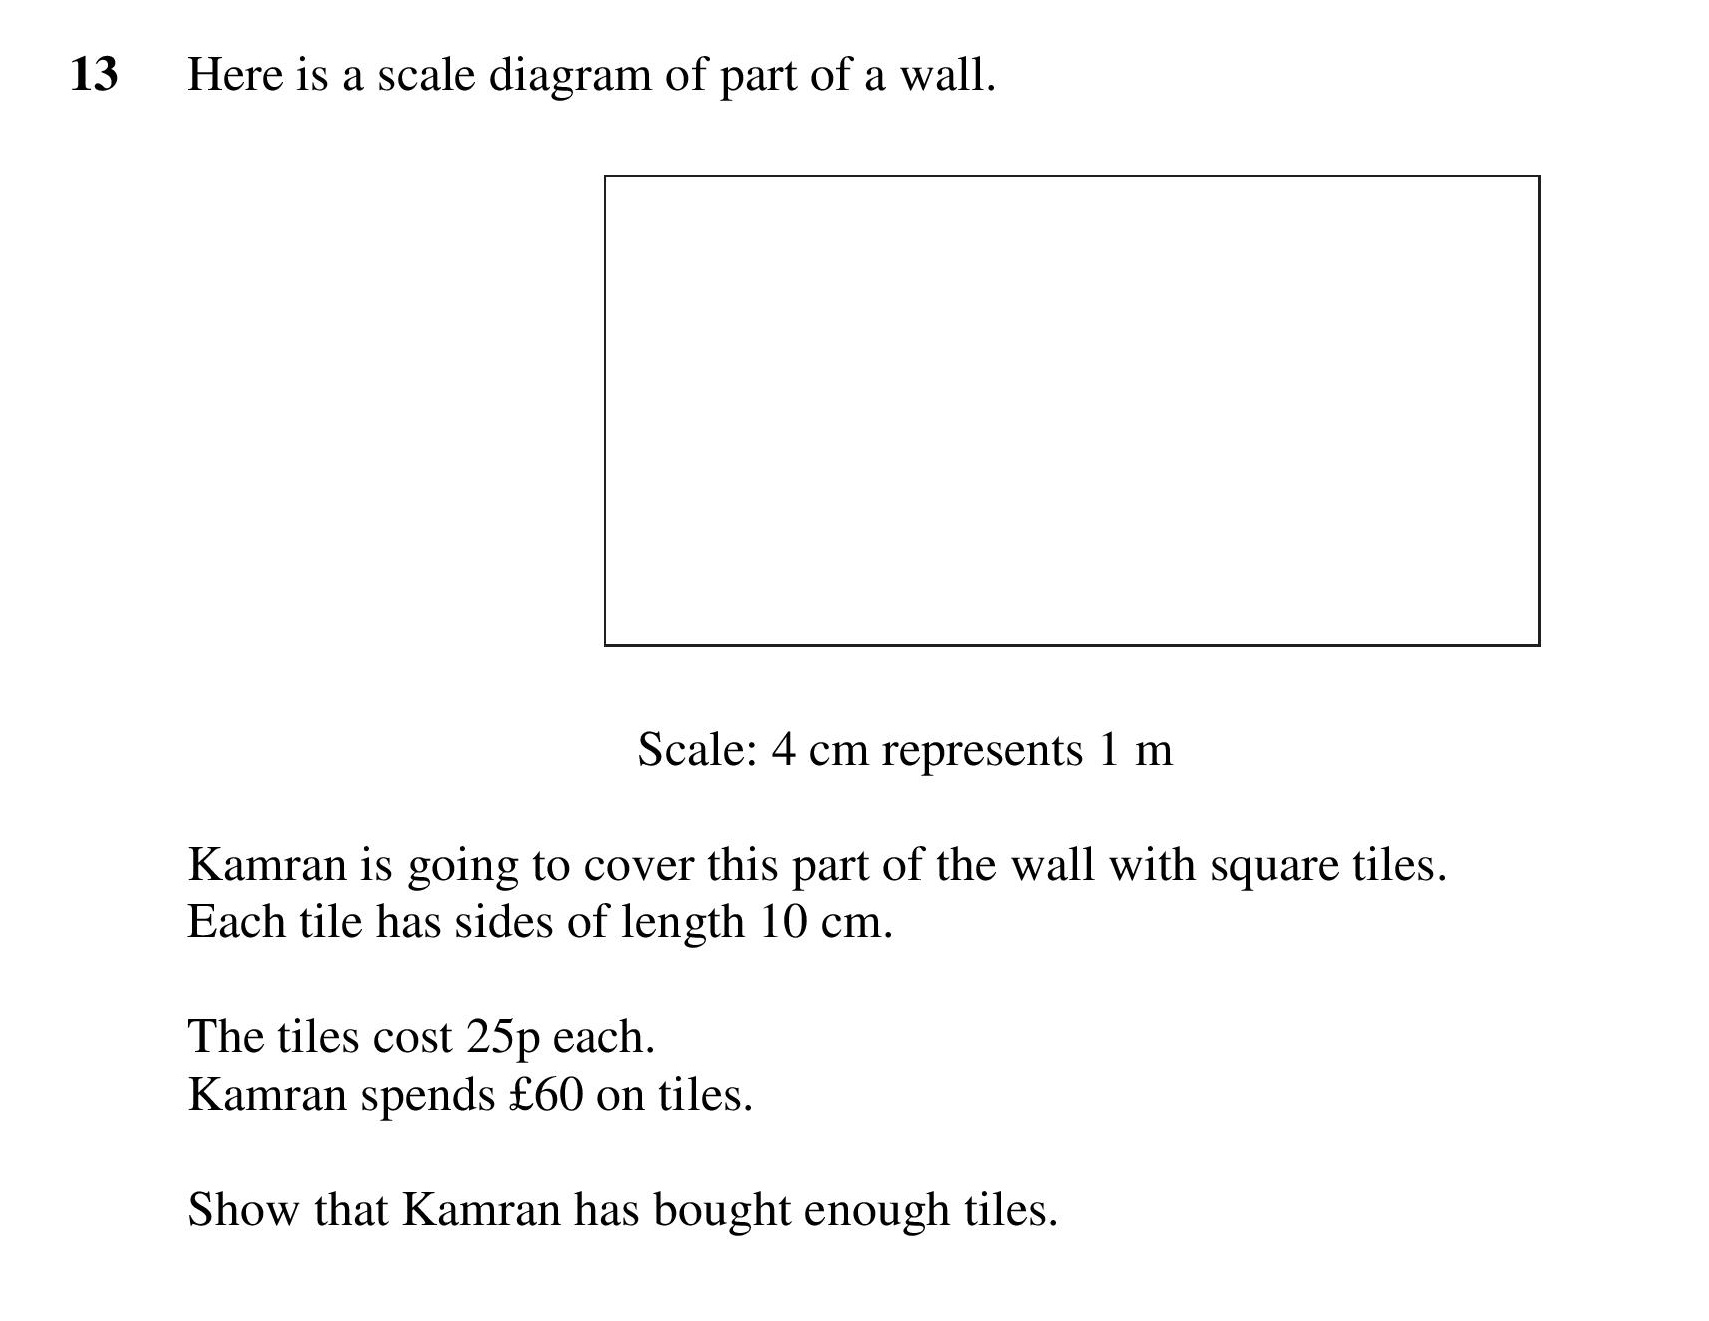
| Functional Maths with Scale Diagram | 2 | 4 | 0.38 | 0.15 | 0.23 | |
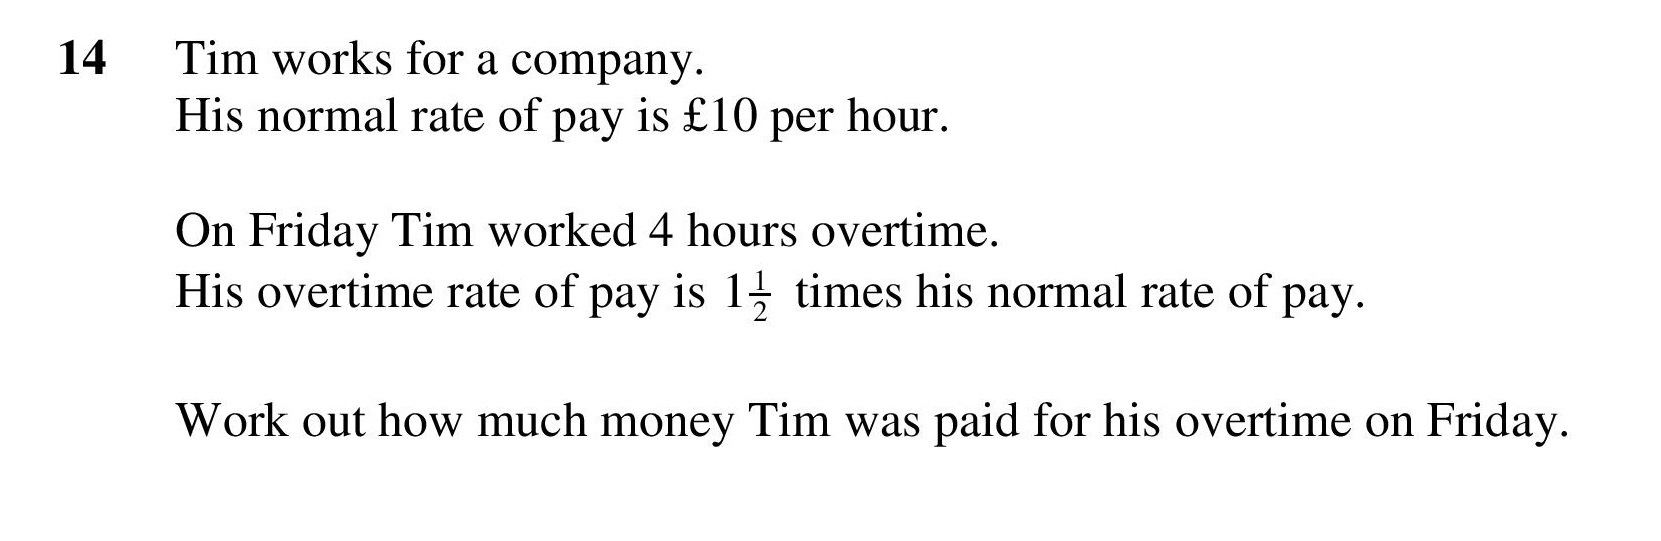
| Rate of Pay | 1 | 3 | 0.33 | 0.43 | -0.1 | |
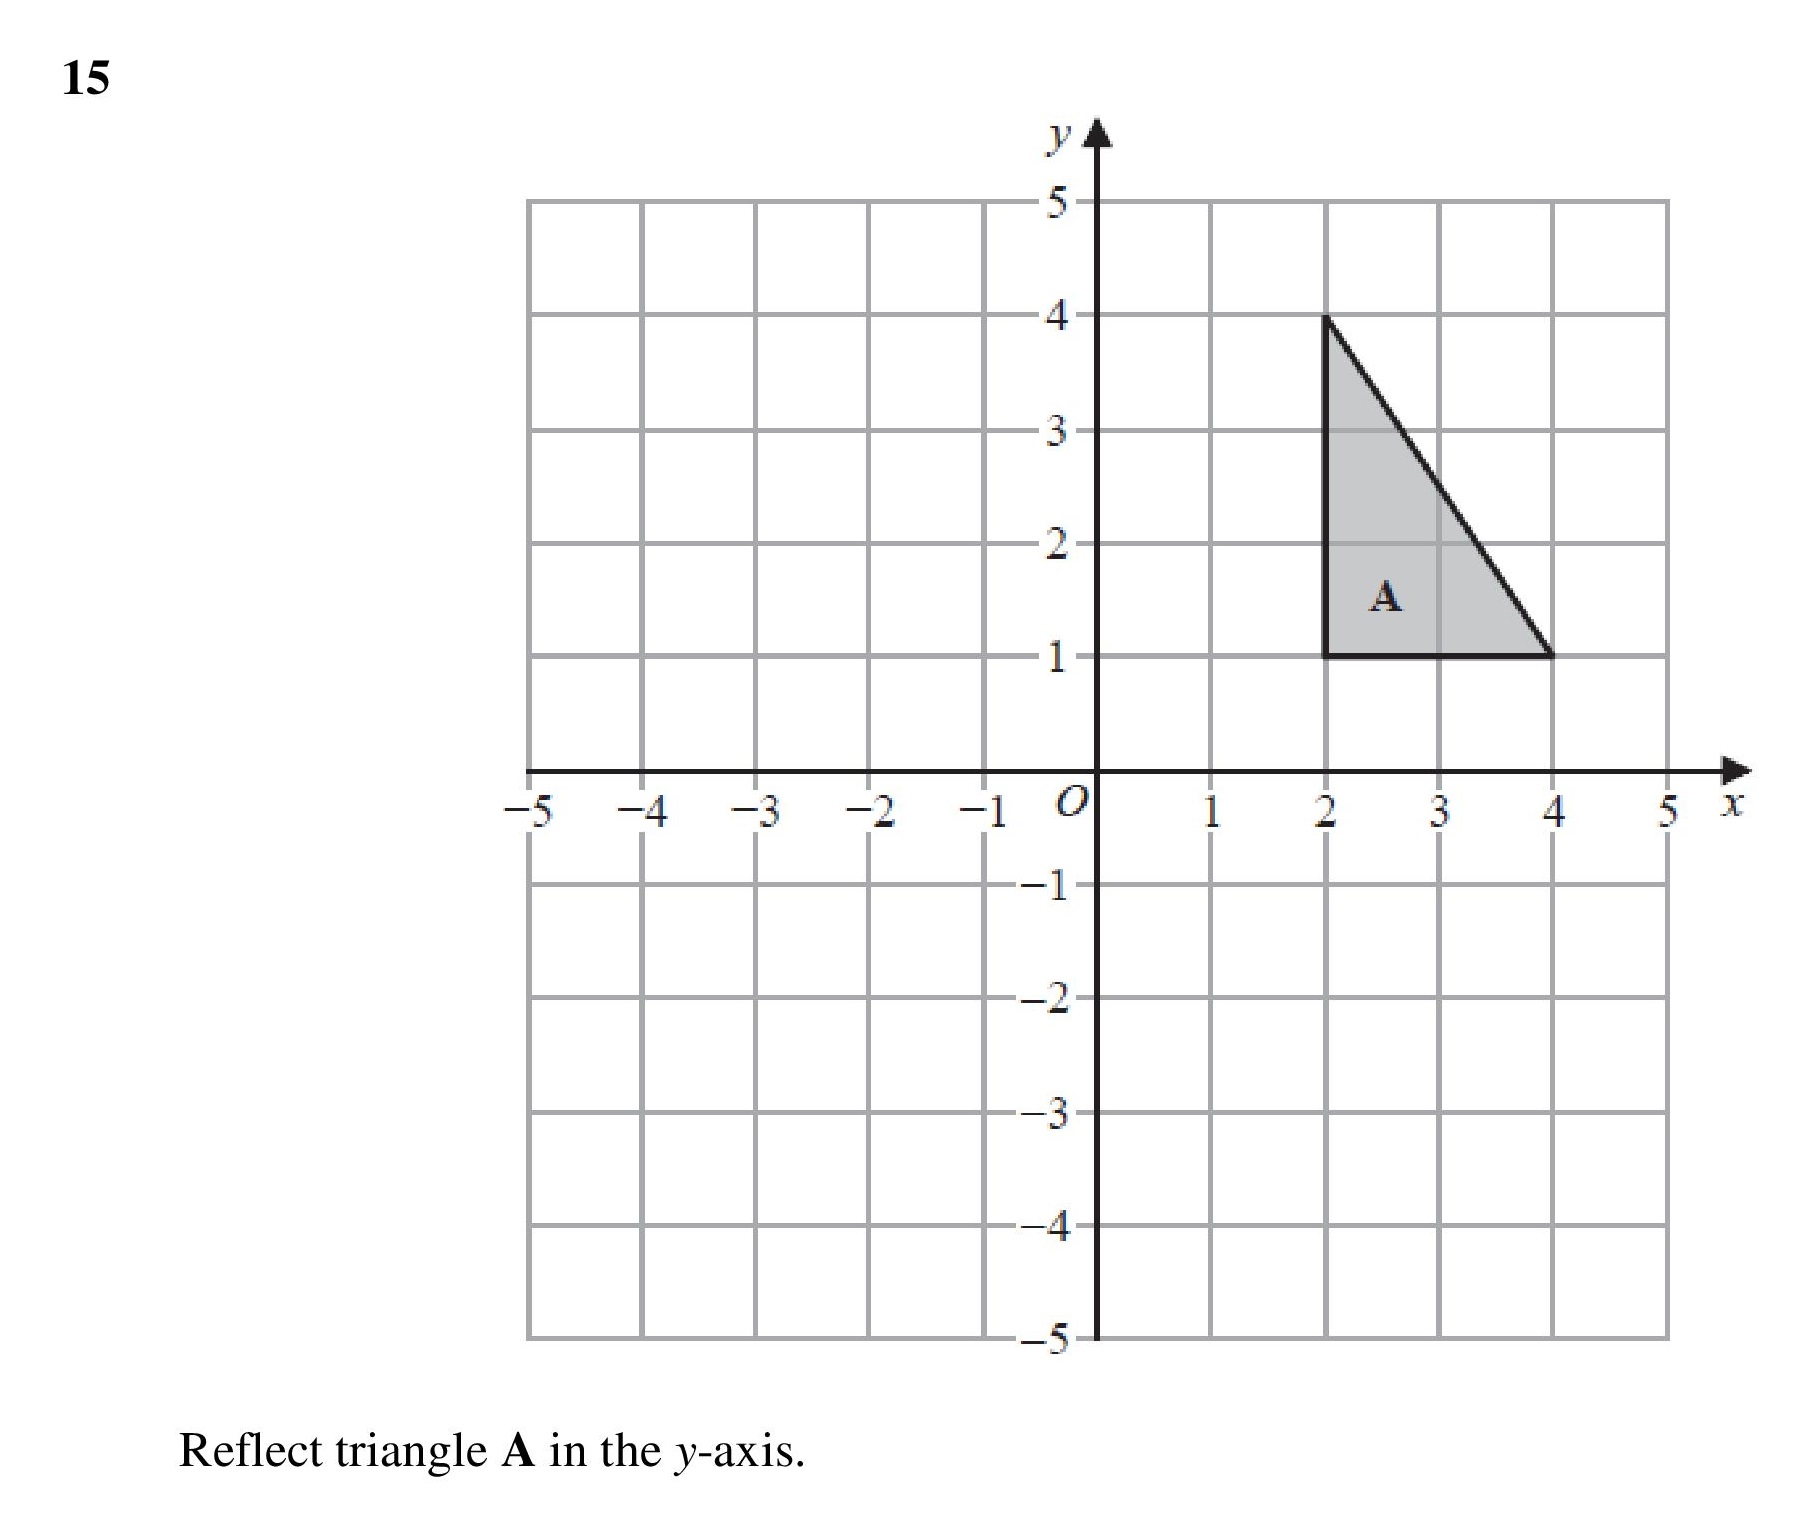
| Reflections | 1 | 2 | 0.75 | 0.72 | 0.03 | |
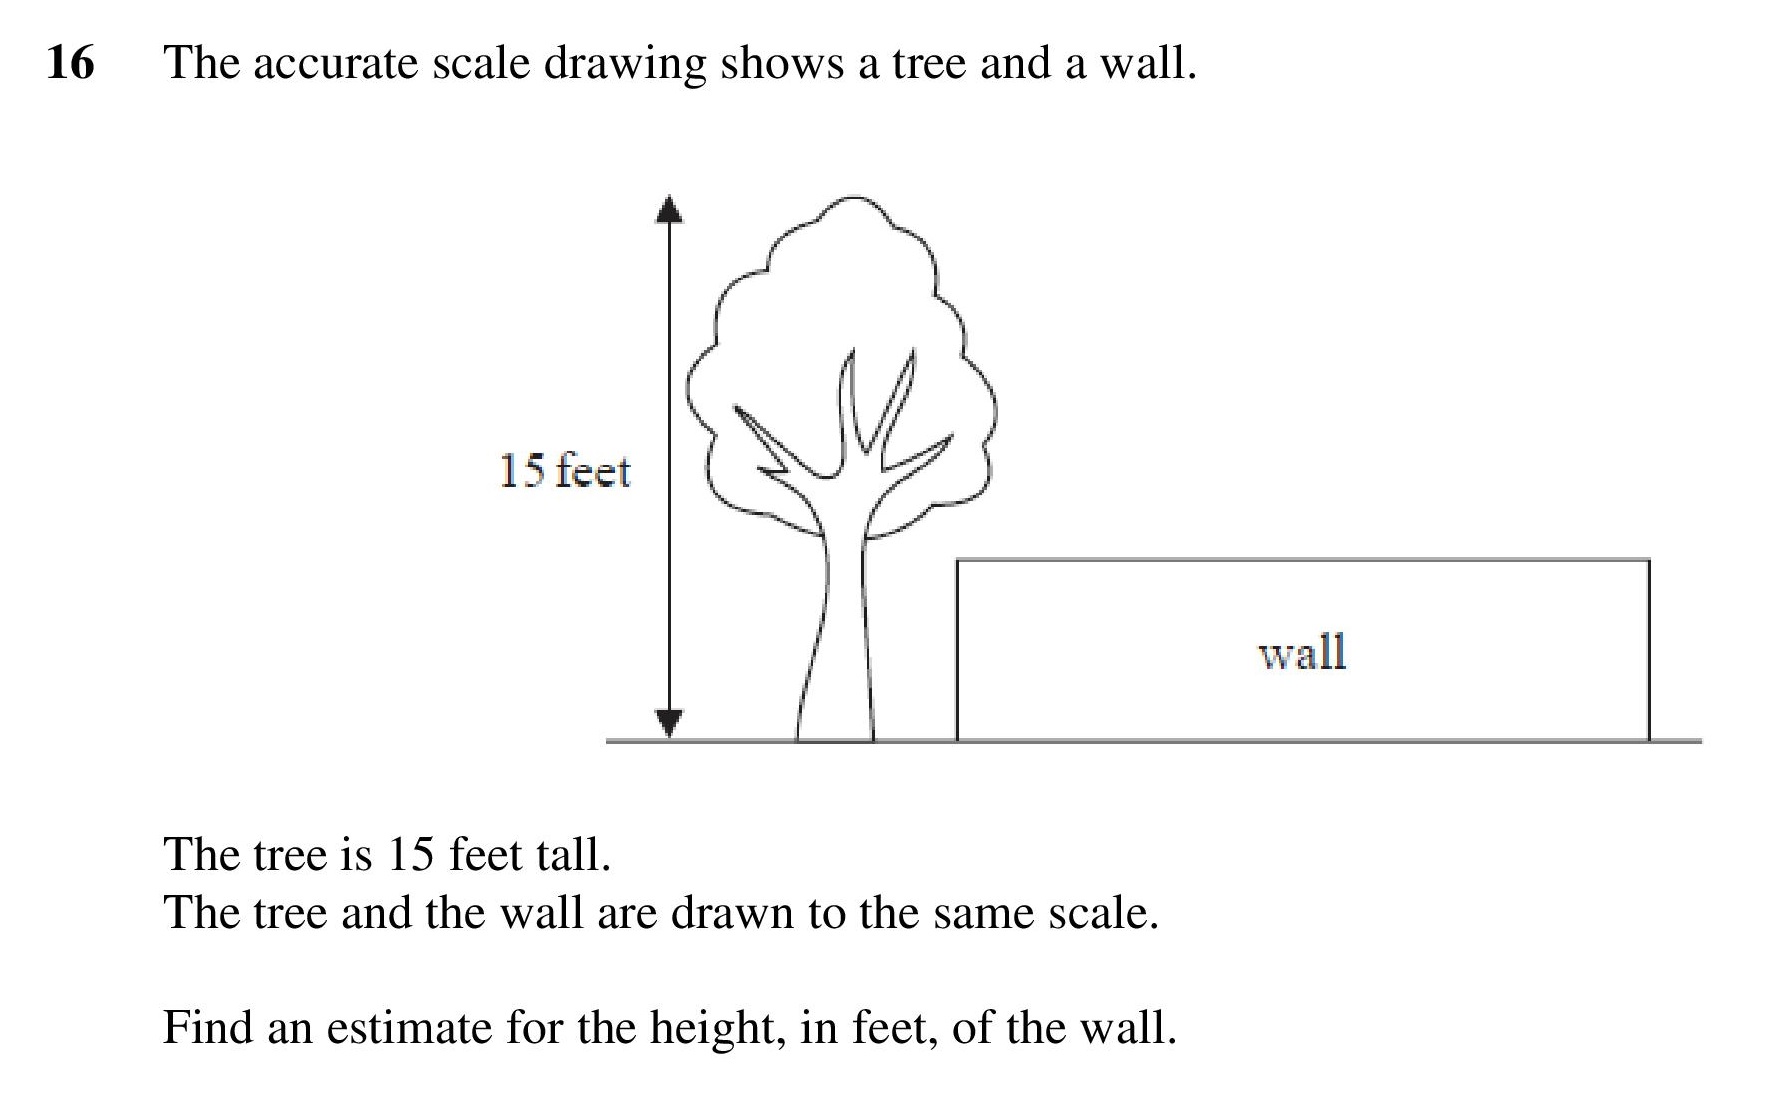
| Estimateing Measuresthis one uses division | 1 | 2 | 0.5 | 0.42 | 0.08 | |
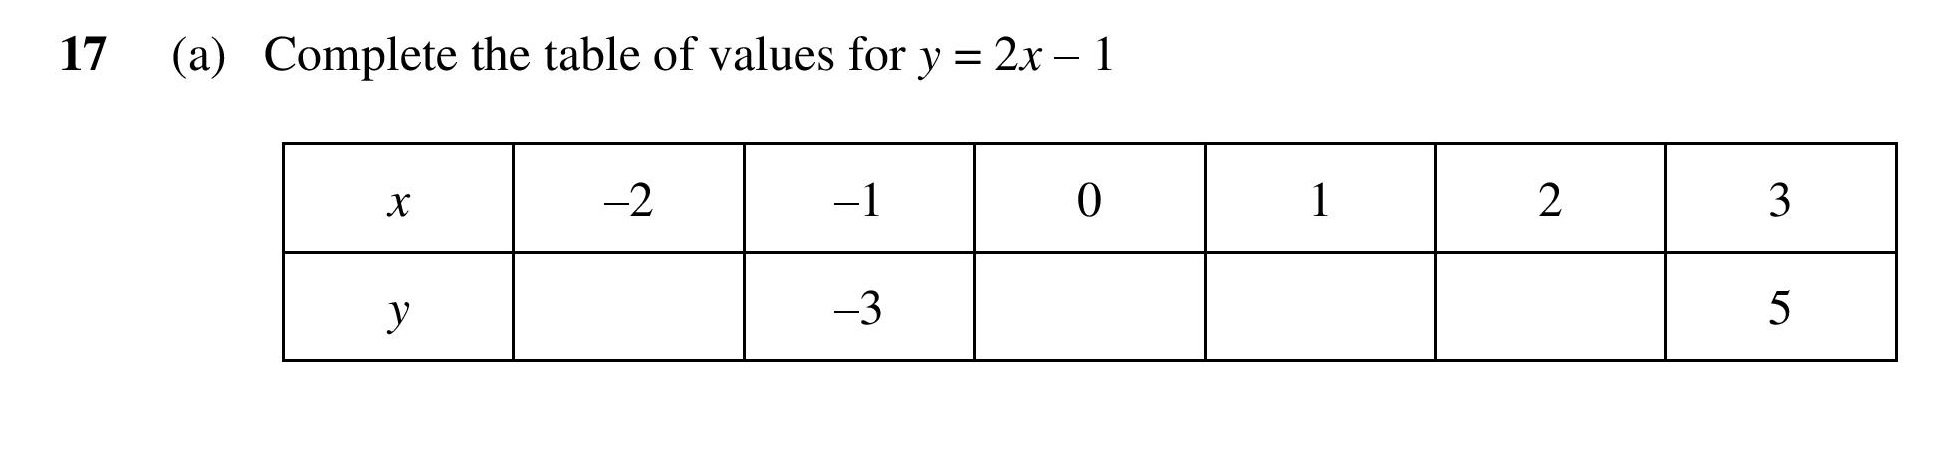
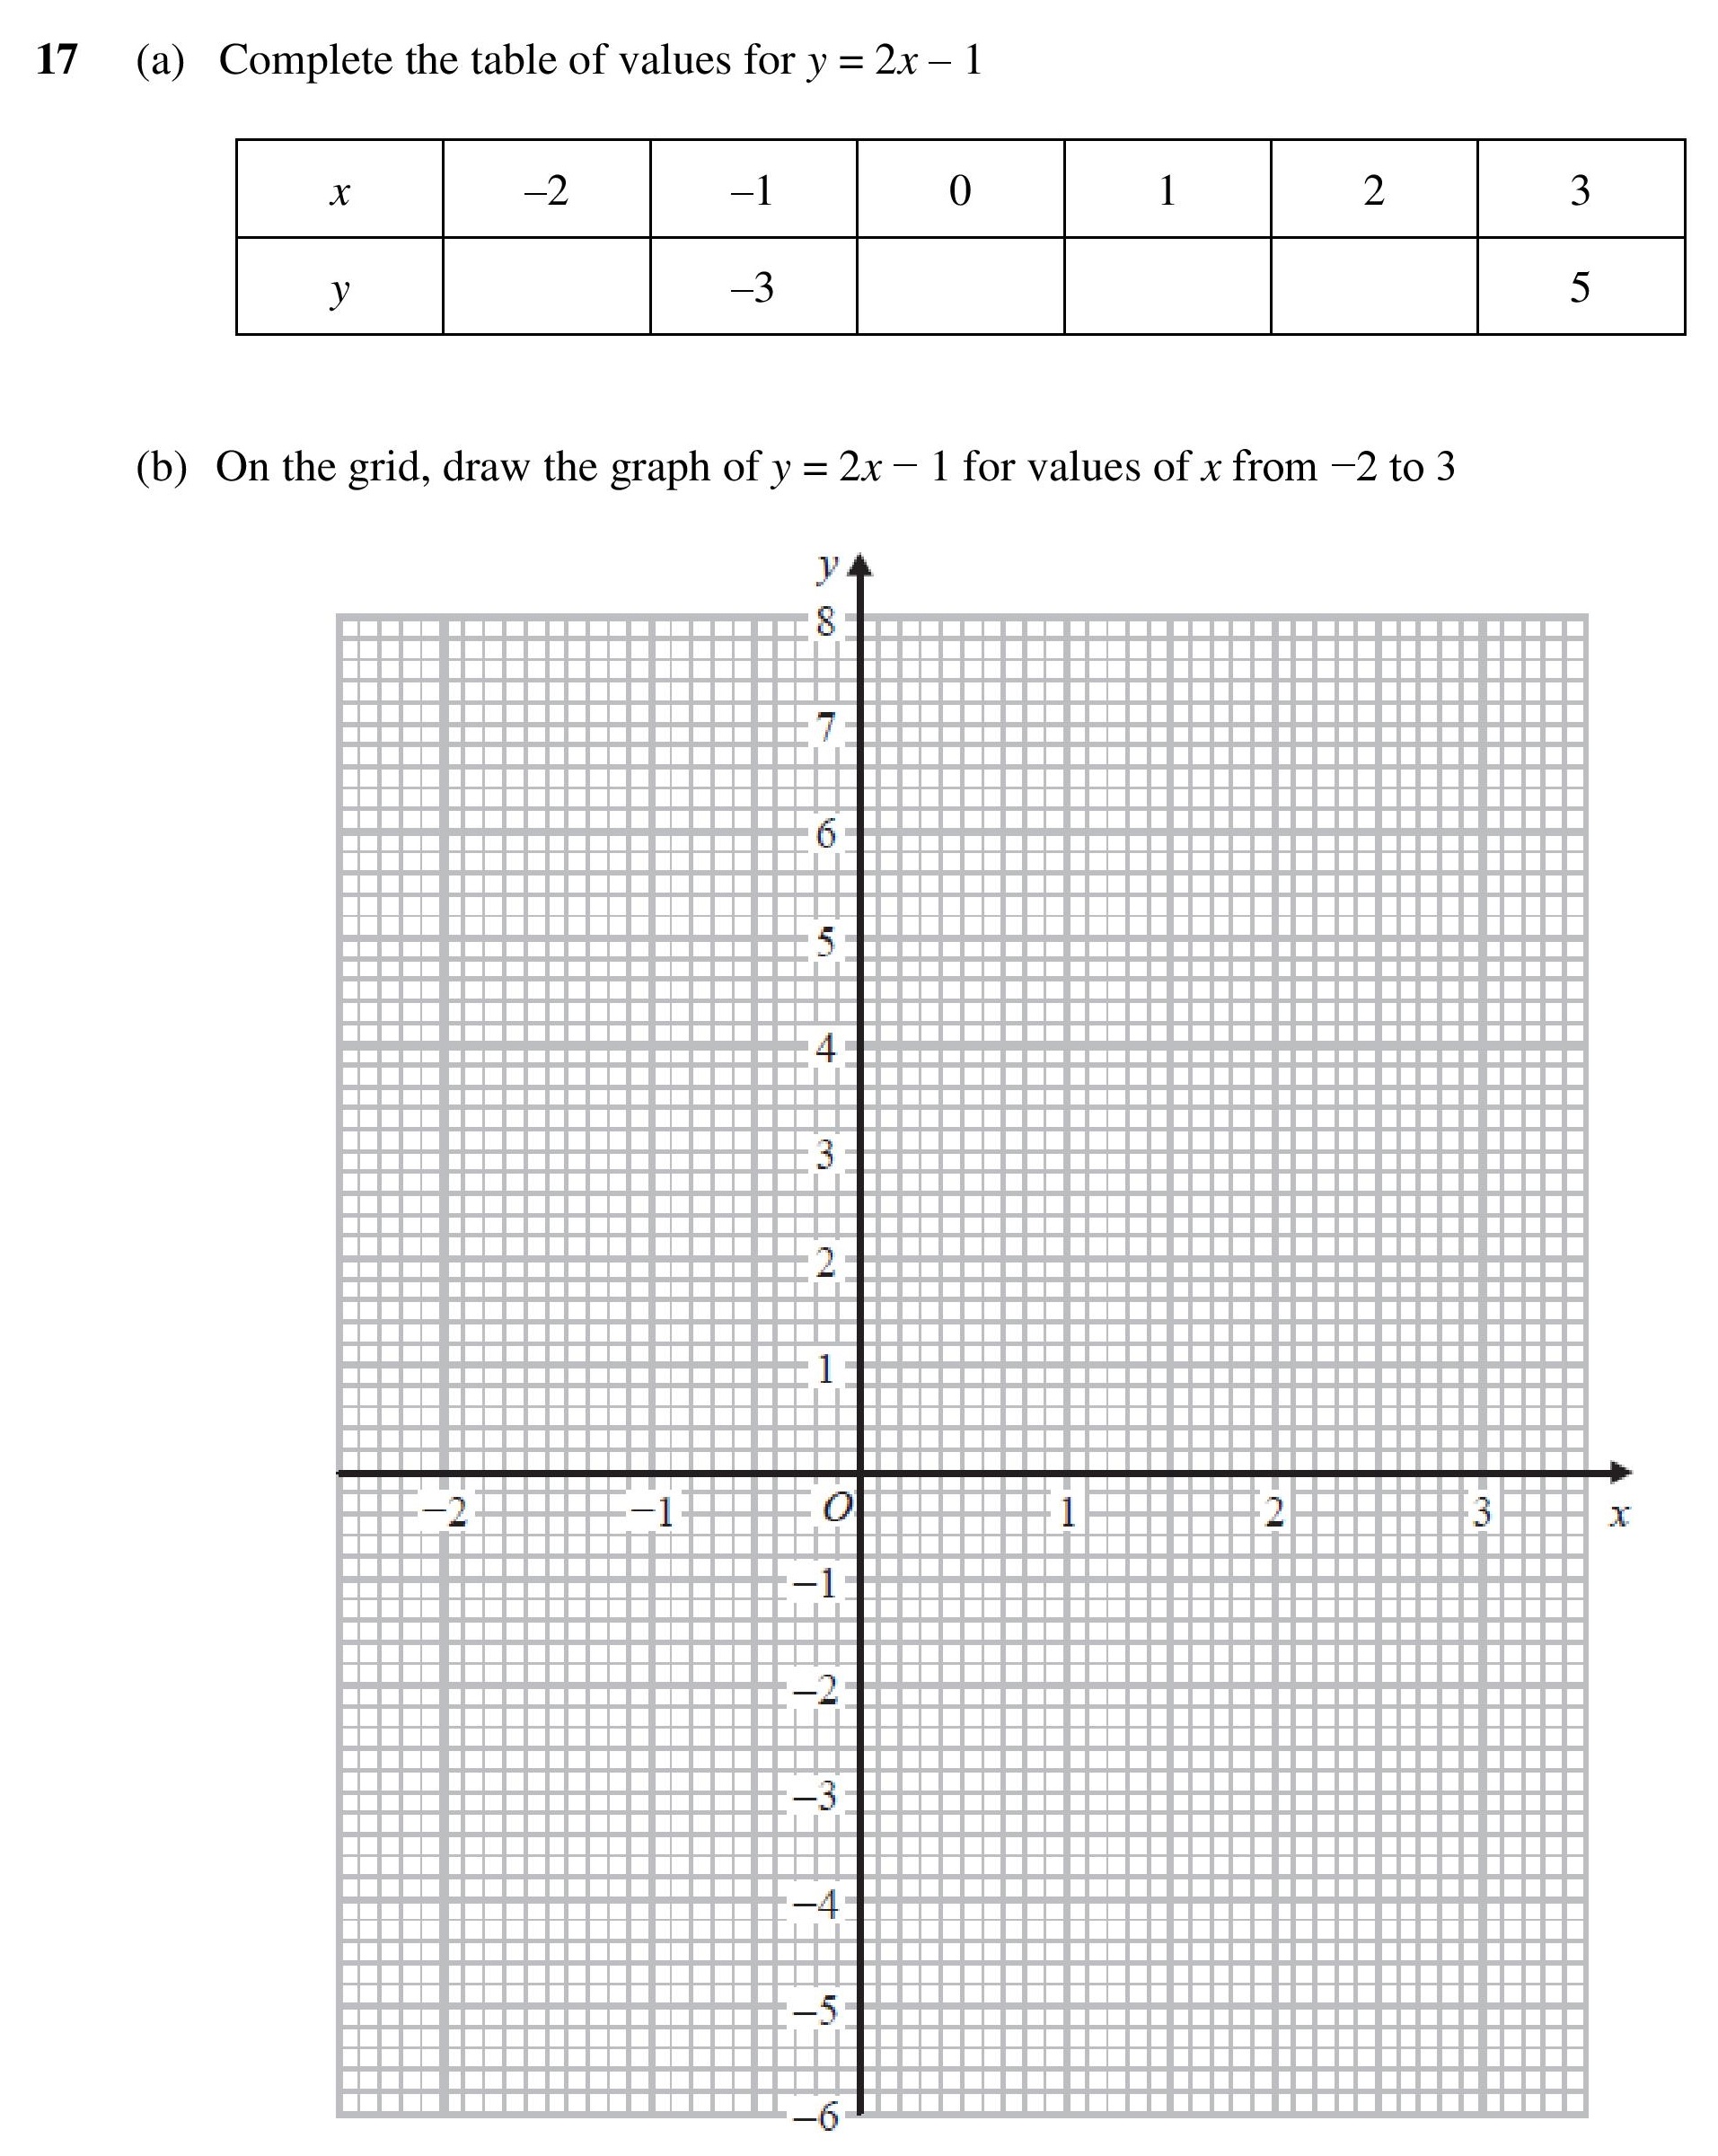
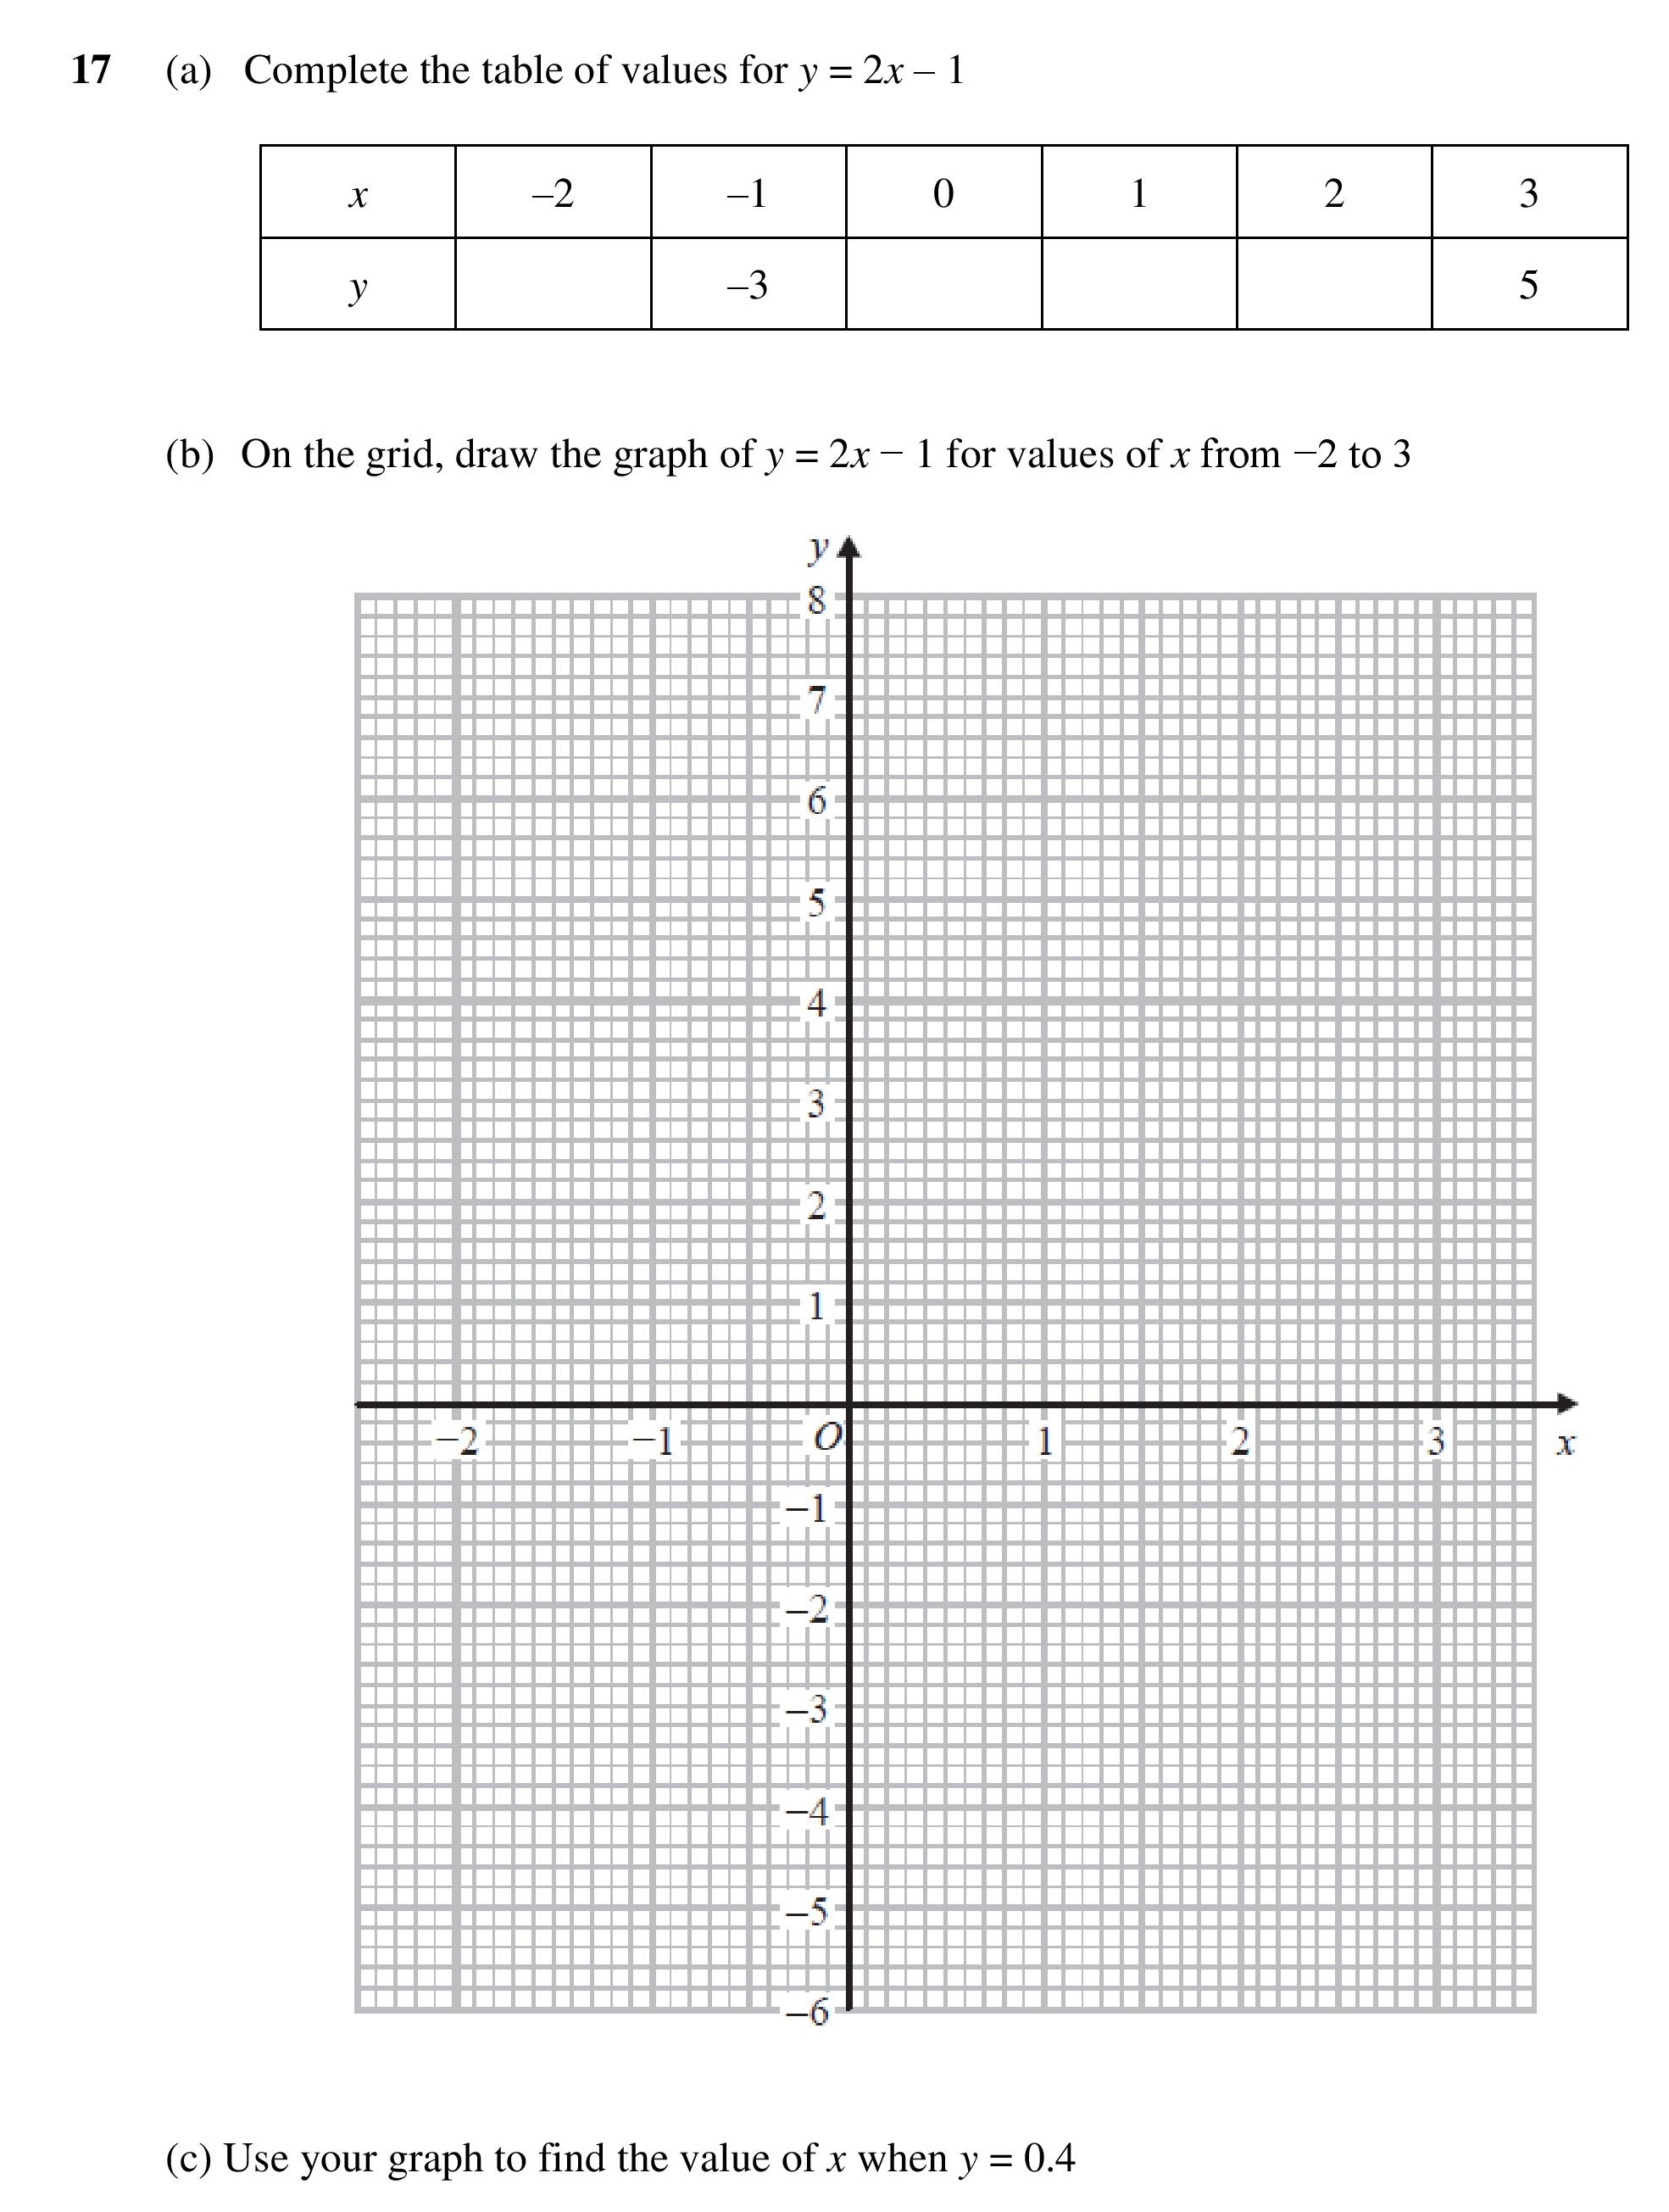
| Table of Values | 1 | 2 | 0.75 | 0.64 | 0.11 | |
| Drawing Straight Line Graphs | 1 | 2 | 0.5 | 0.54 | -0.04 | |
| Finding Values from a Graph | 1 | 1 | 1.5 | 0.22 | 1.28 | |
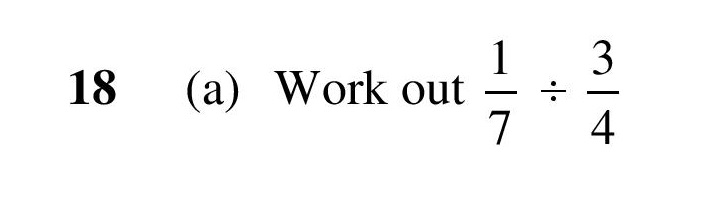
| Multiplying and Dividing Fractions | 1 | 2 | 0.5 | 0.43 | 0.07 | |
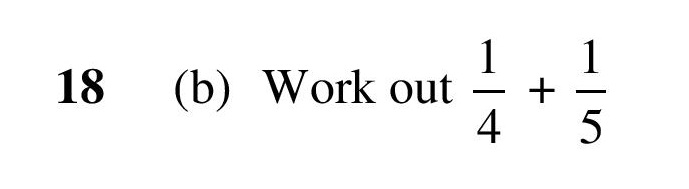
| Adding and Subtracting Fractions with differe | 1 | 2 | 0.75 | 0.52 | 0.23 | |
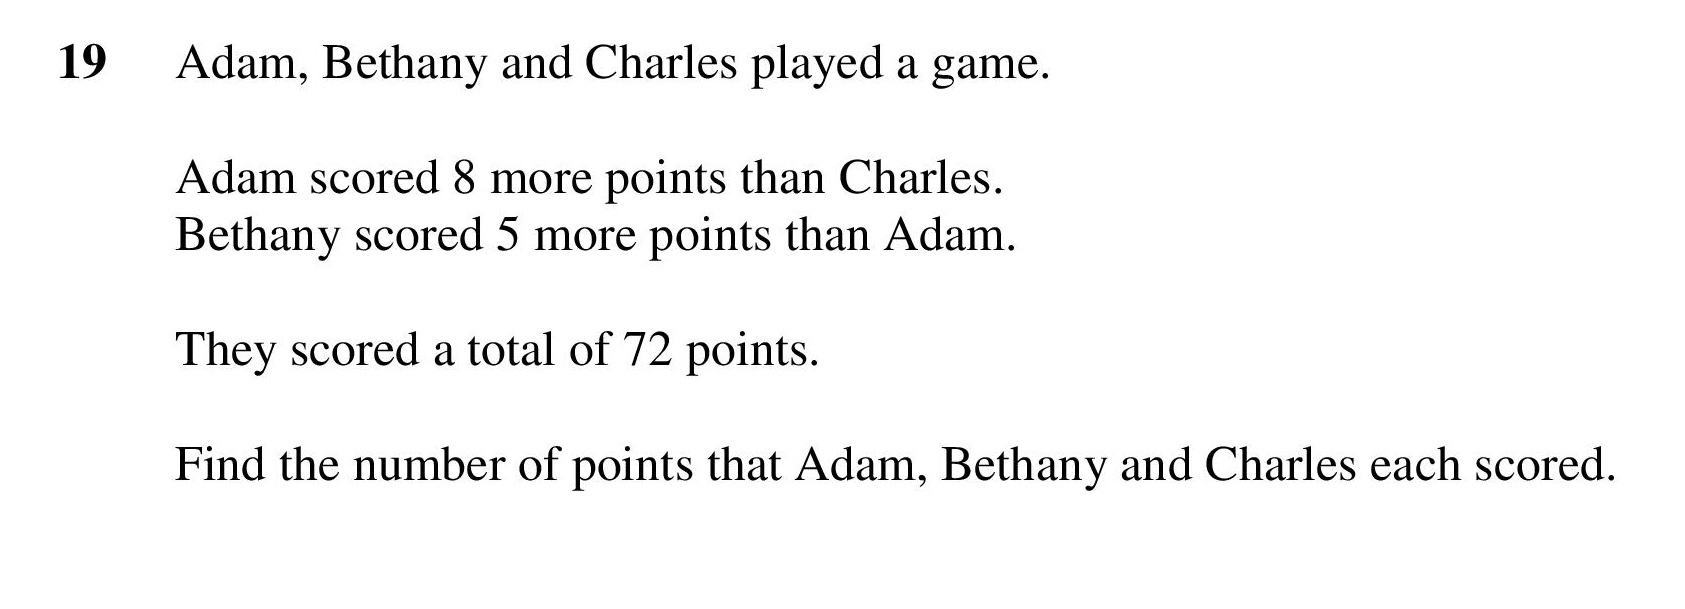
| Forming equations from worded questions | 1 | 4 | 0.25 | 0.24 | 0.01 | |
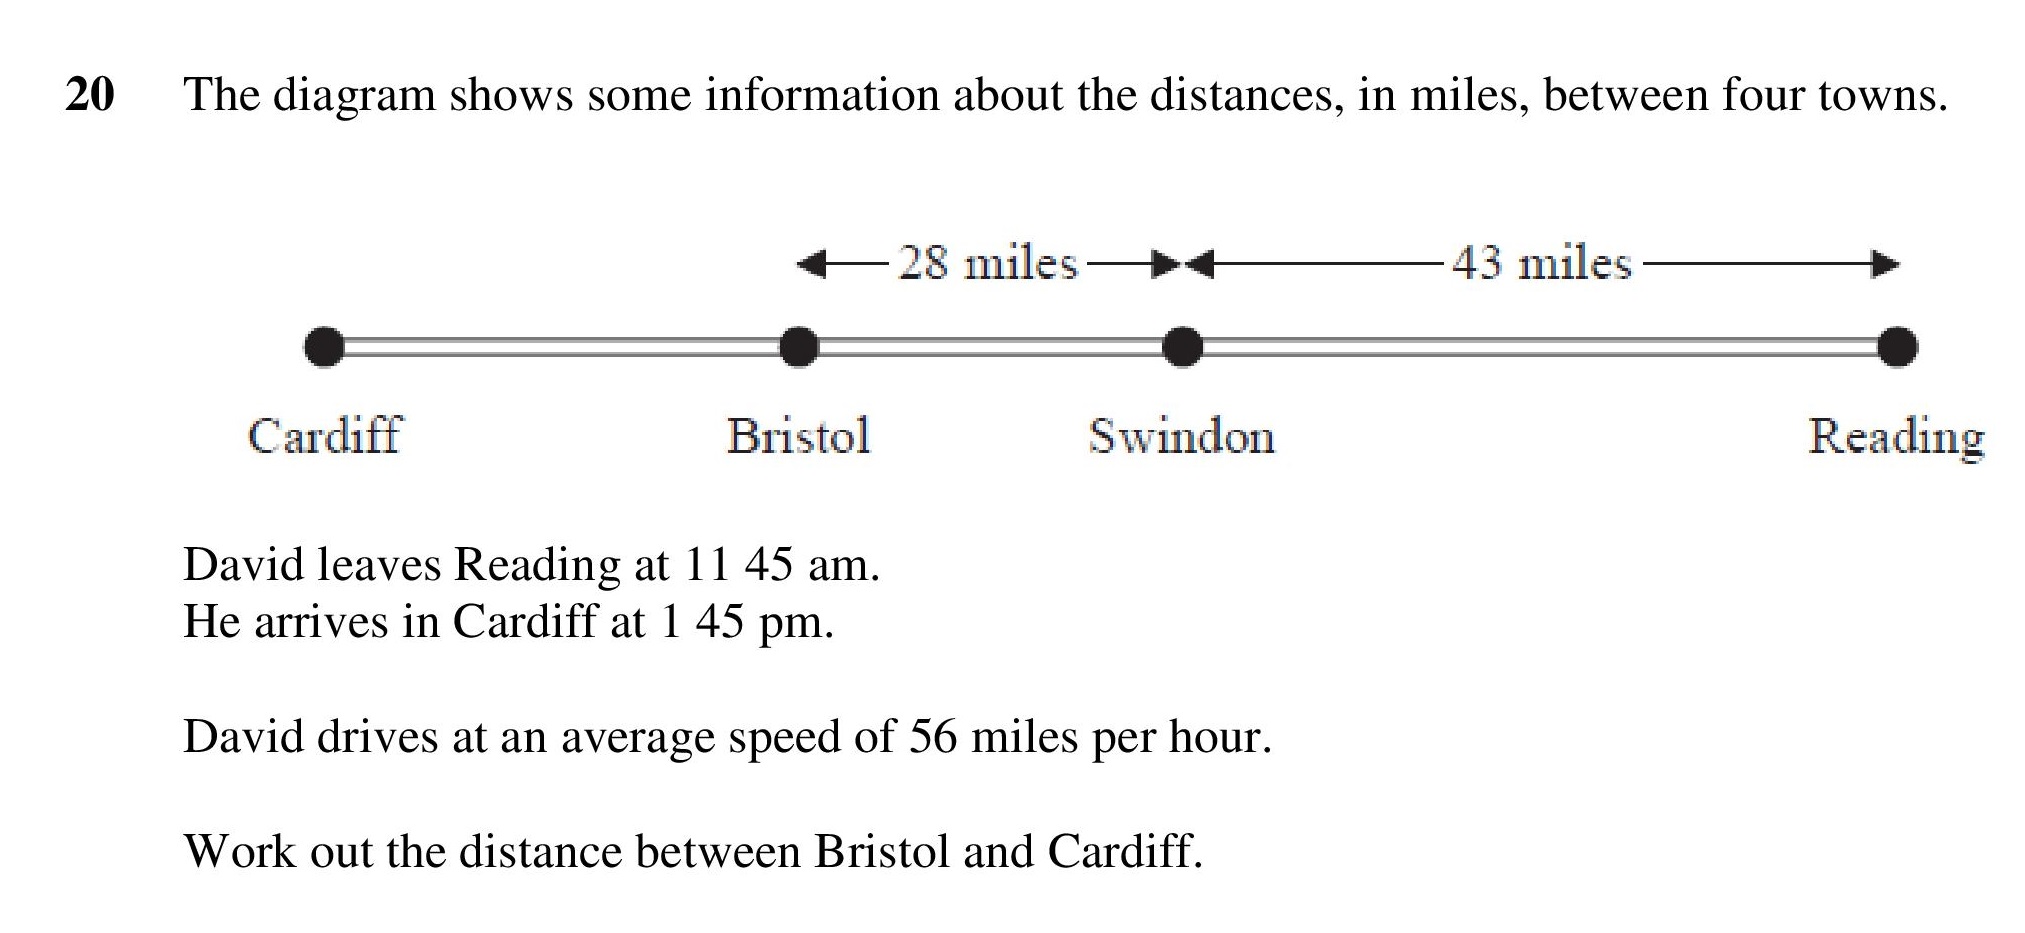
| SpeedI think is OK but slight difference in f | 3 | 4 | 0.38 | 0.36 | 0.02 | |
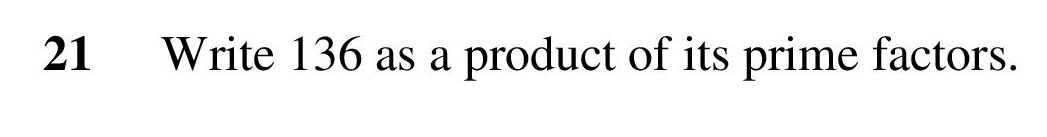
| Product of Prime Factors | 1 | 3 | 0.33 | 0.4 | -0.07 | |
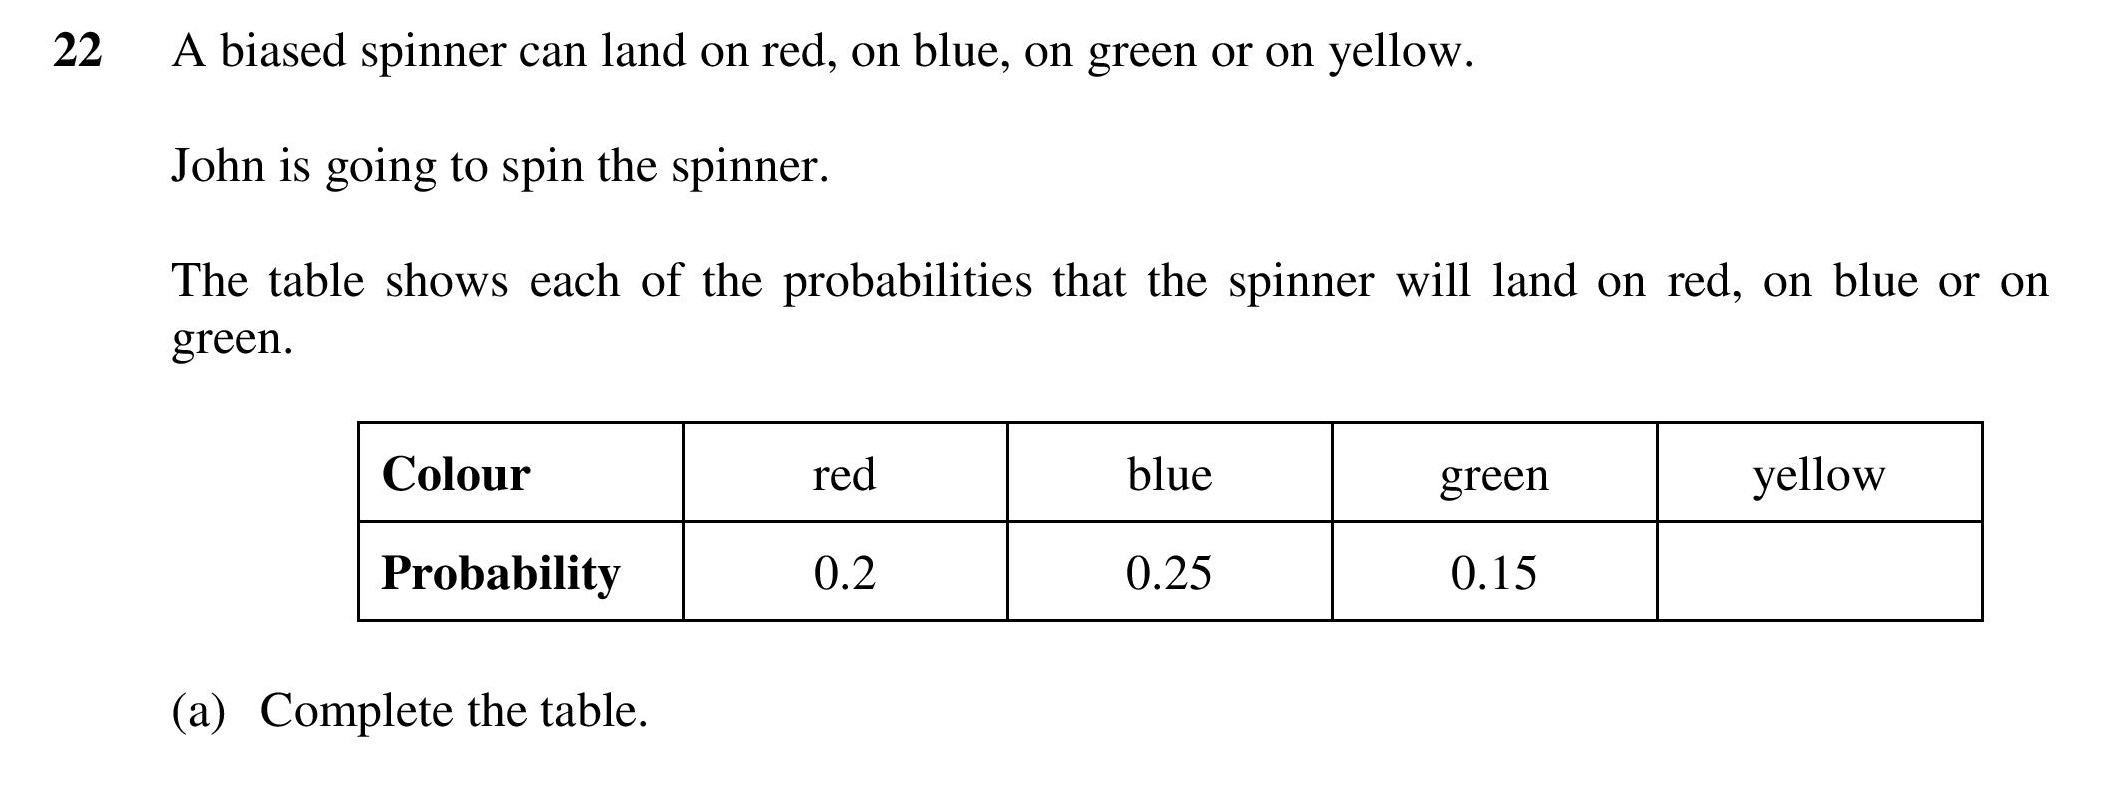
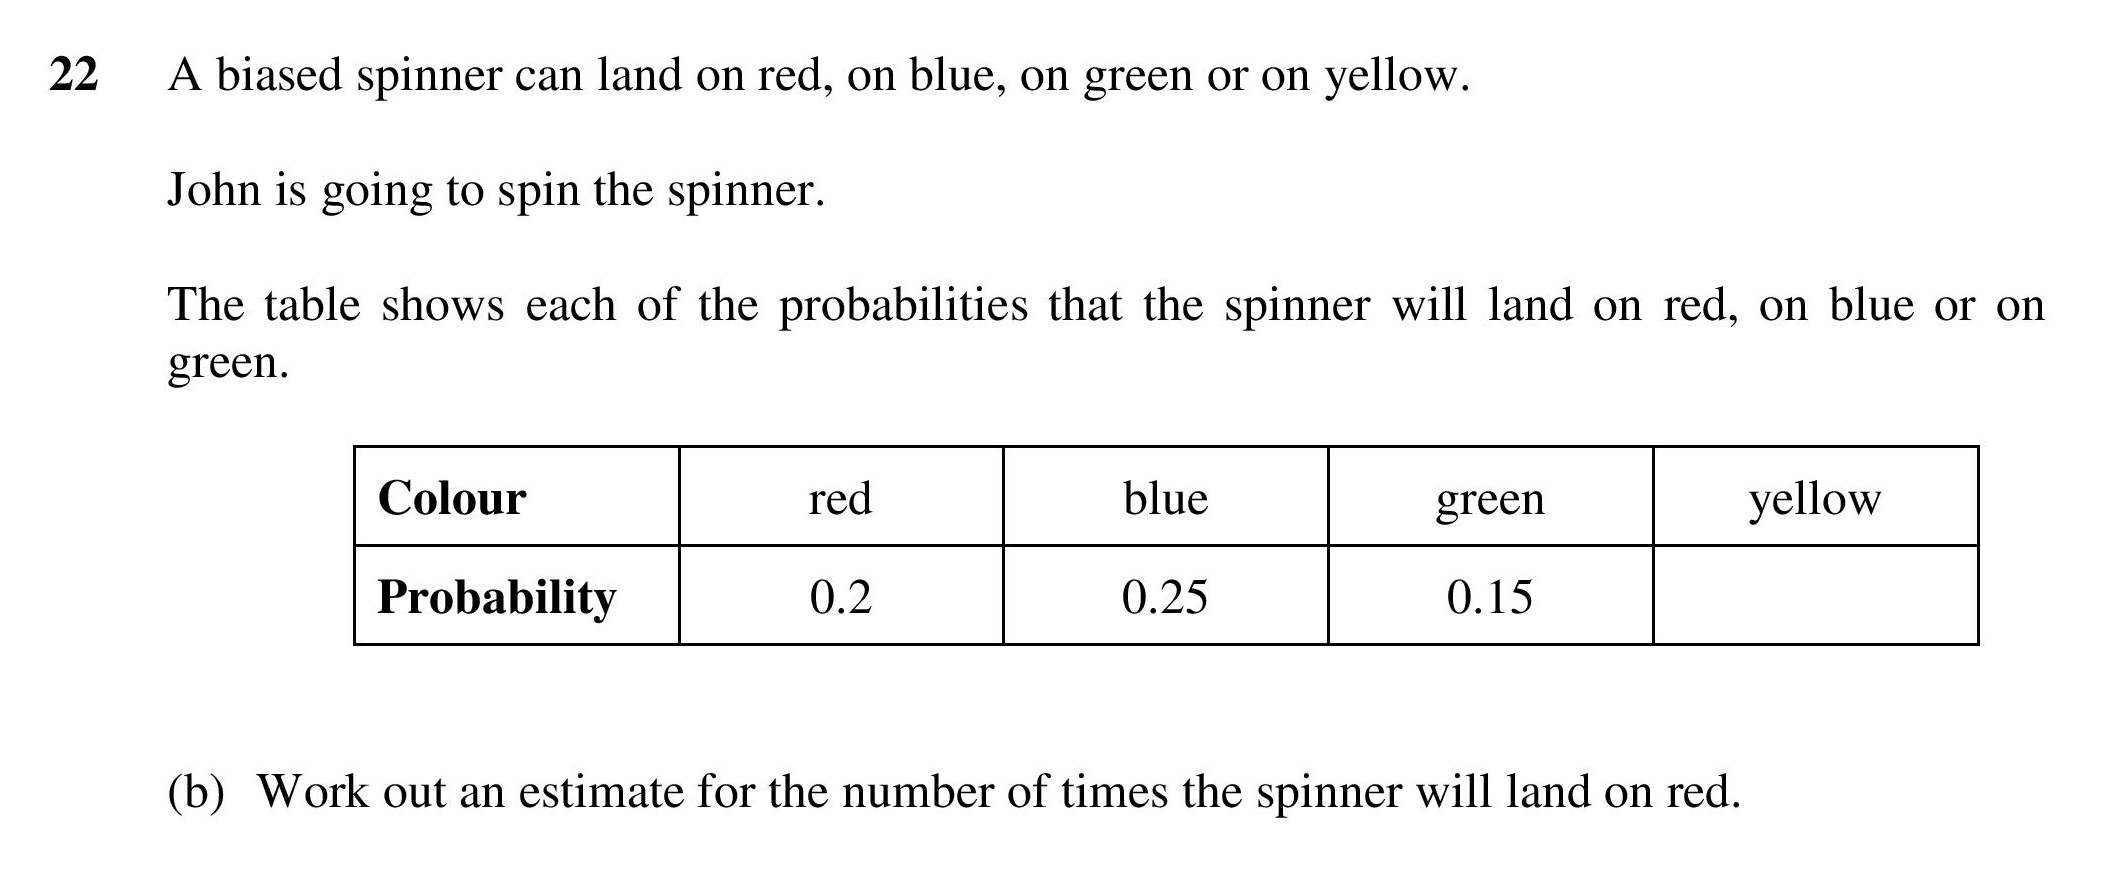
| Probability from tables | 1 | 2 | 0.75 | 0.54 | 0.21 | |
| Probability and Relative Frequency | 1 | 2 | 0.5 | 0.31 | 0.19 | |
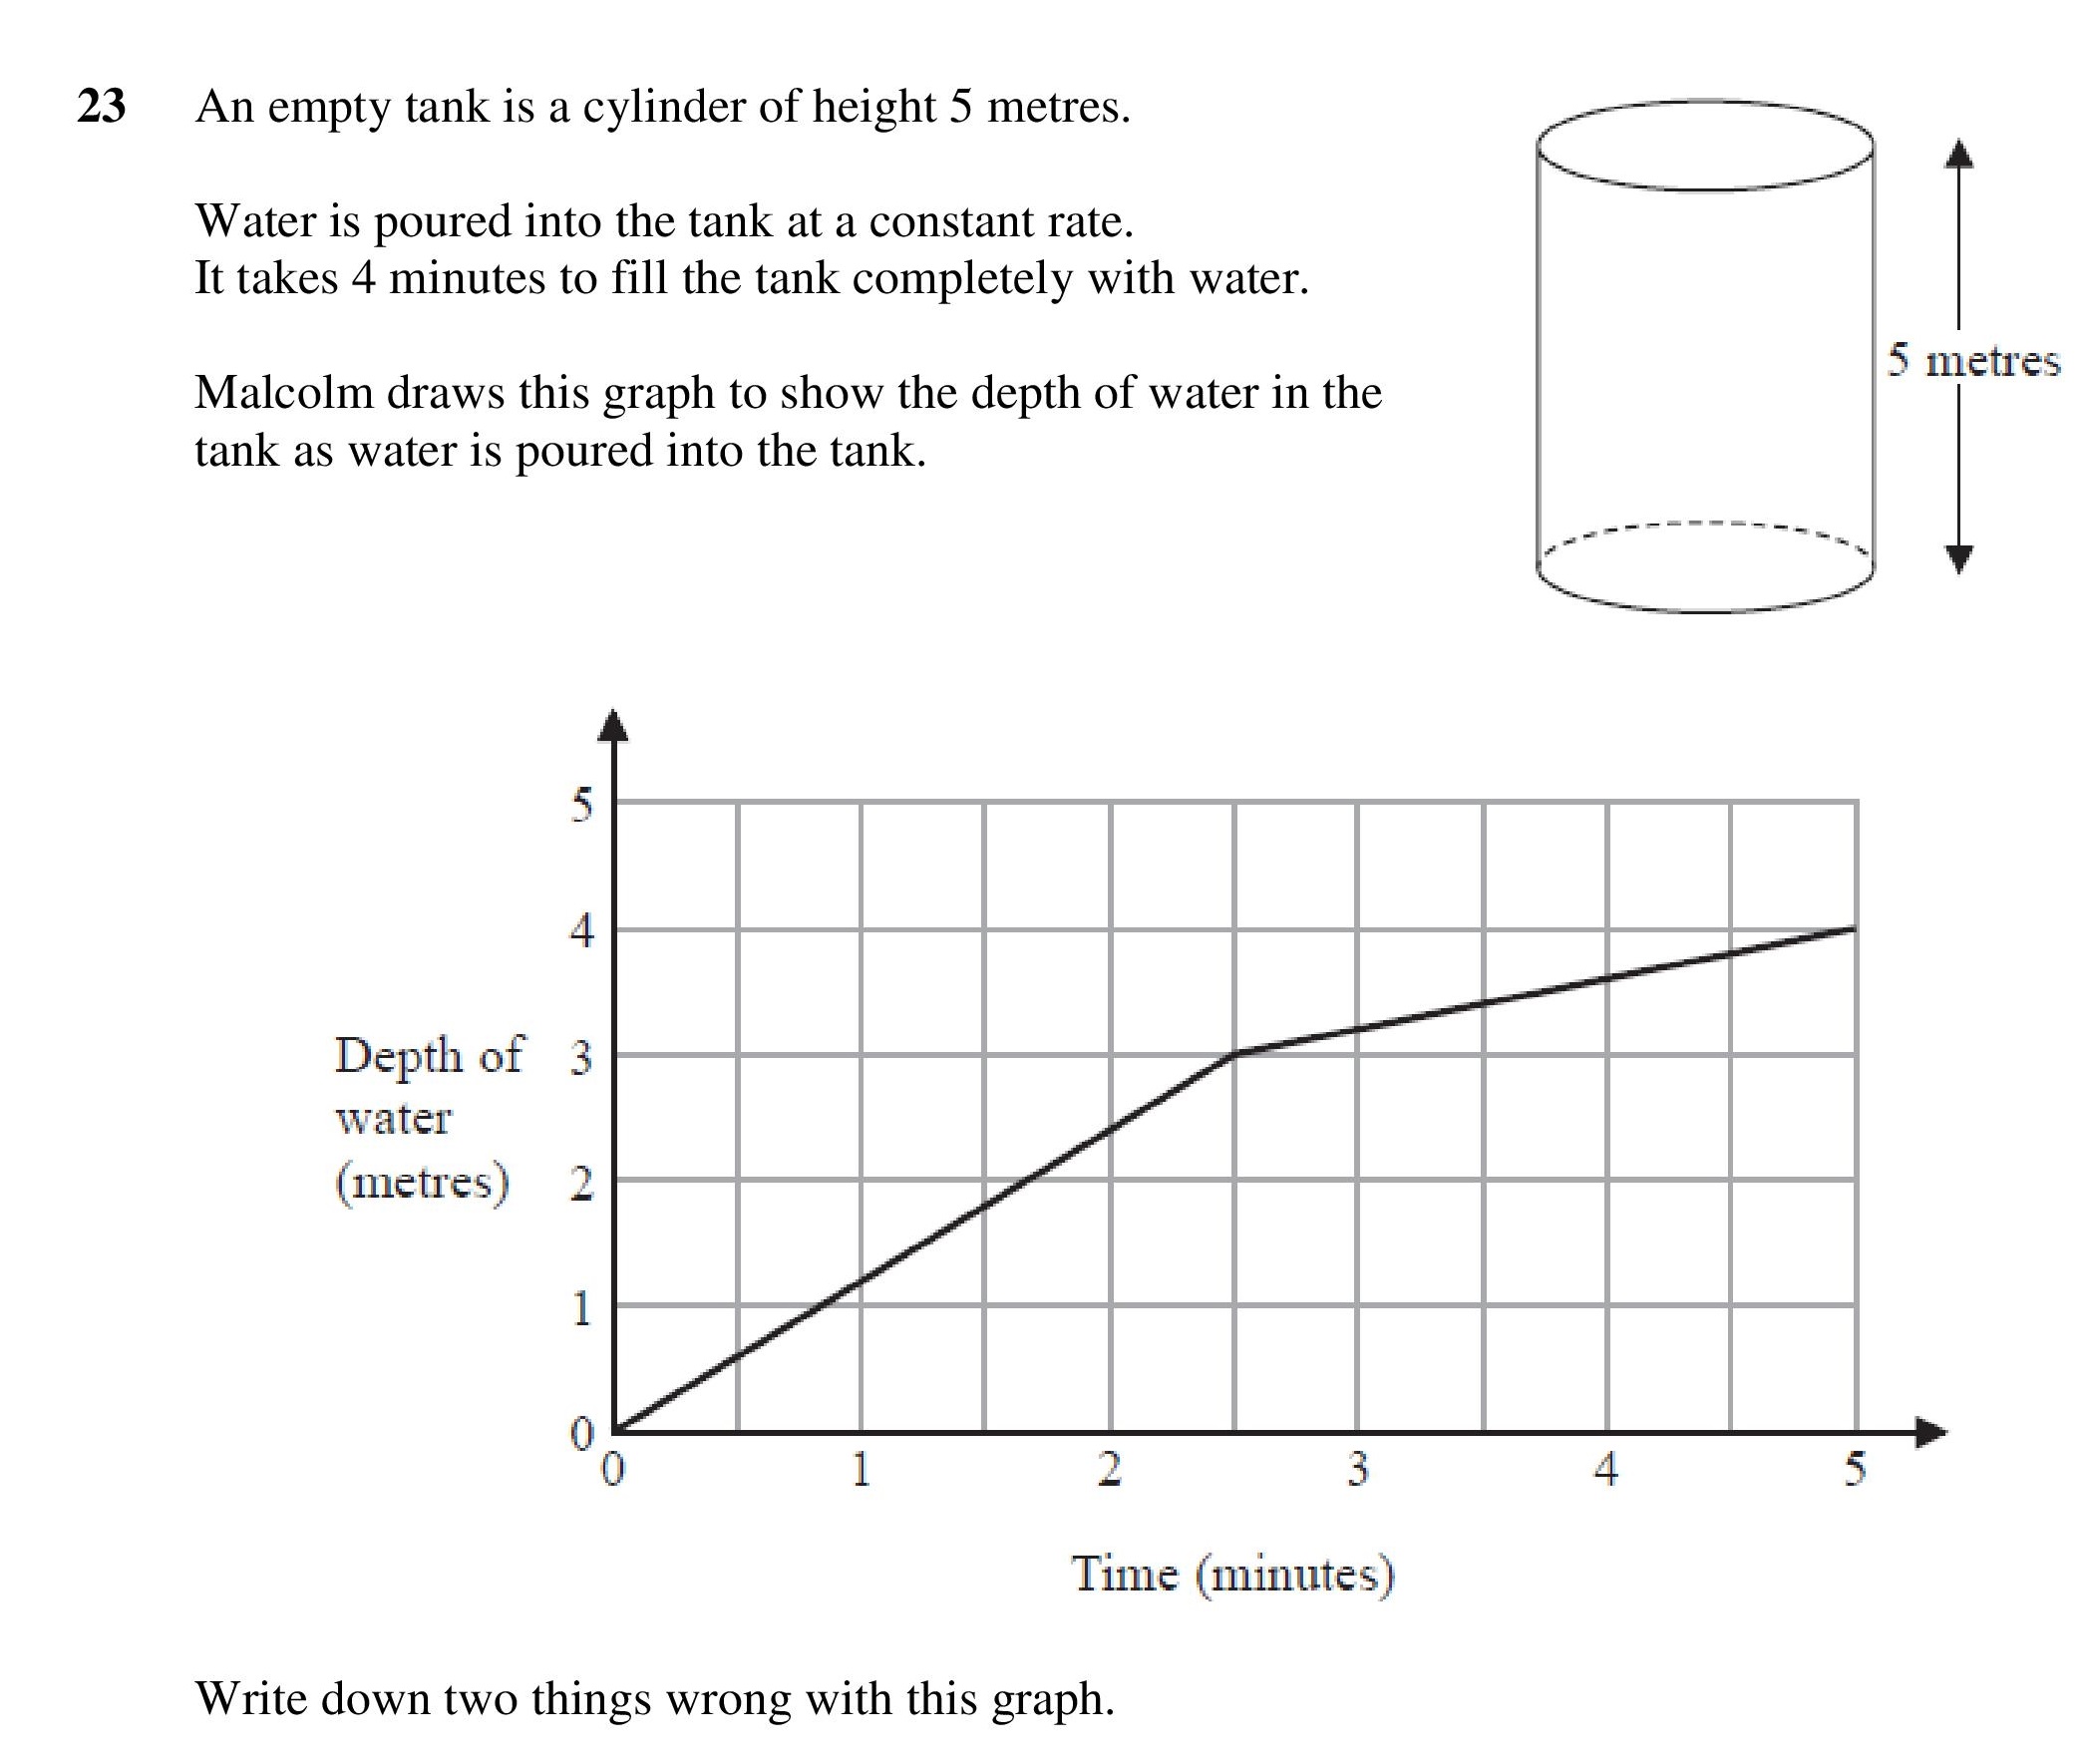
| Real Life Graph Mistakes | 2 | 2 | 0.75 | 0.39 | 0.36 | |
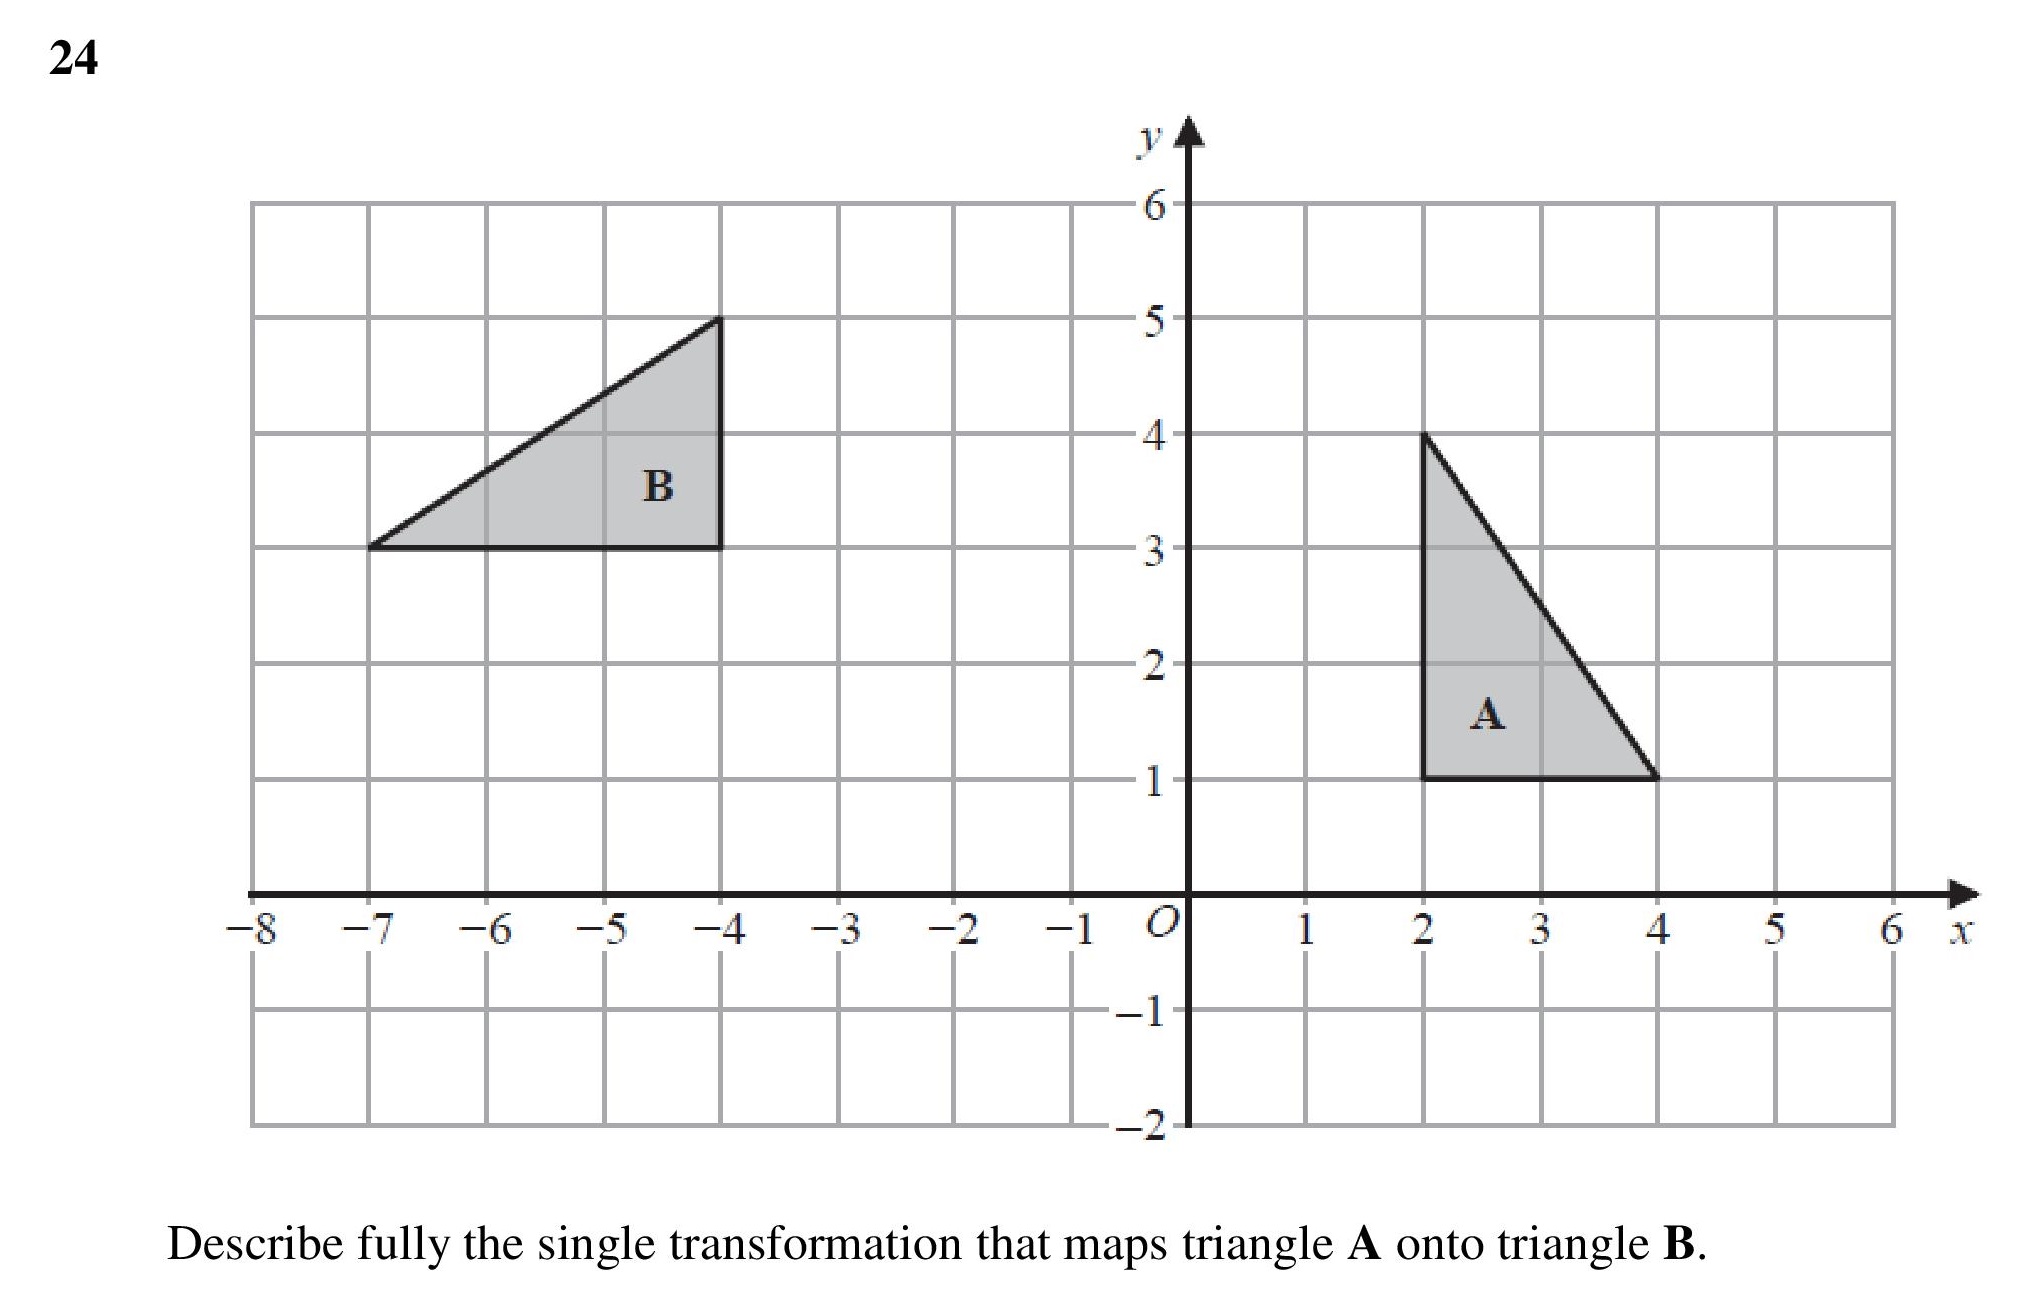
| Describing Transformations | 2 | 2 | 0.5 | 0.26 | 0.24 | |
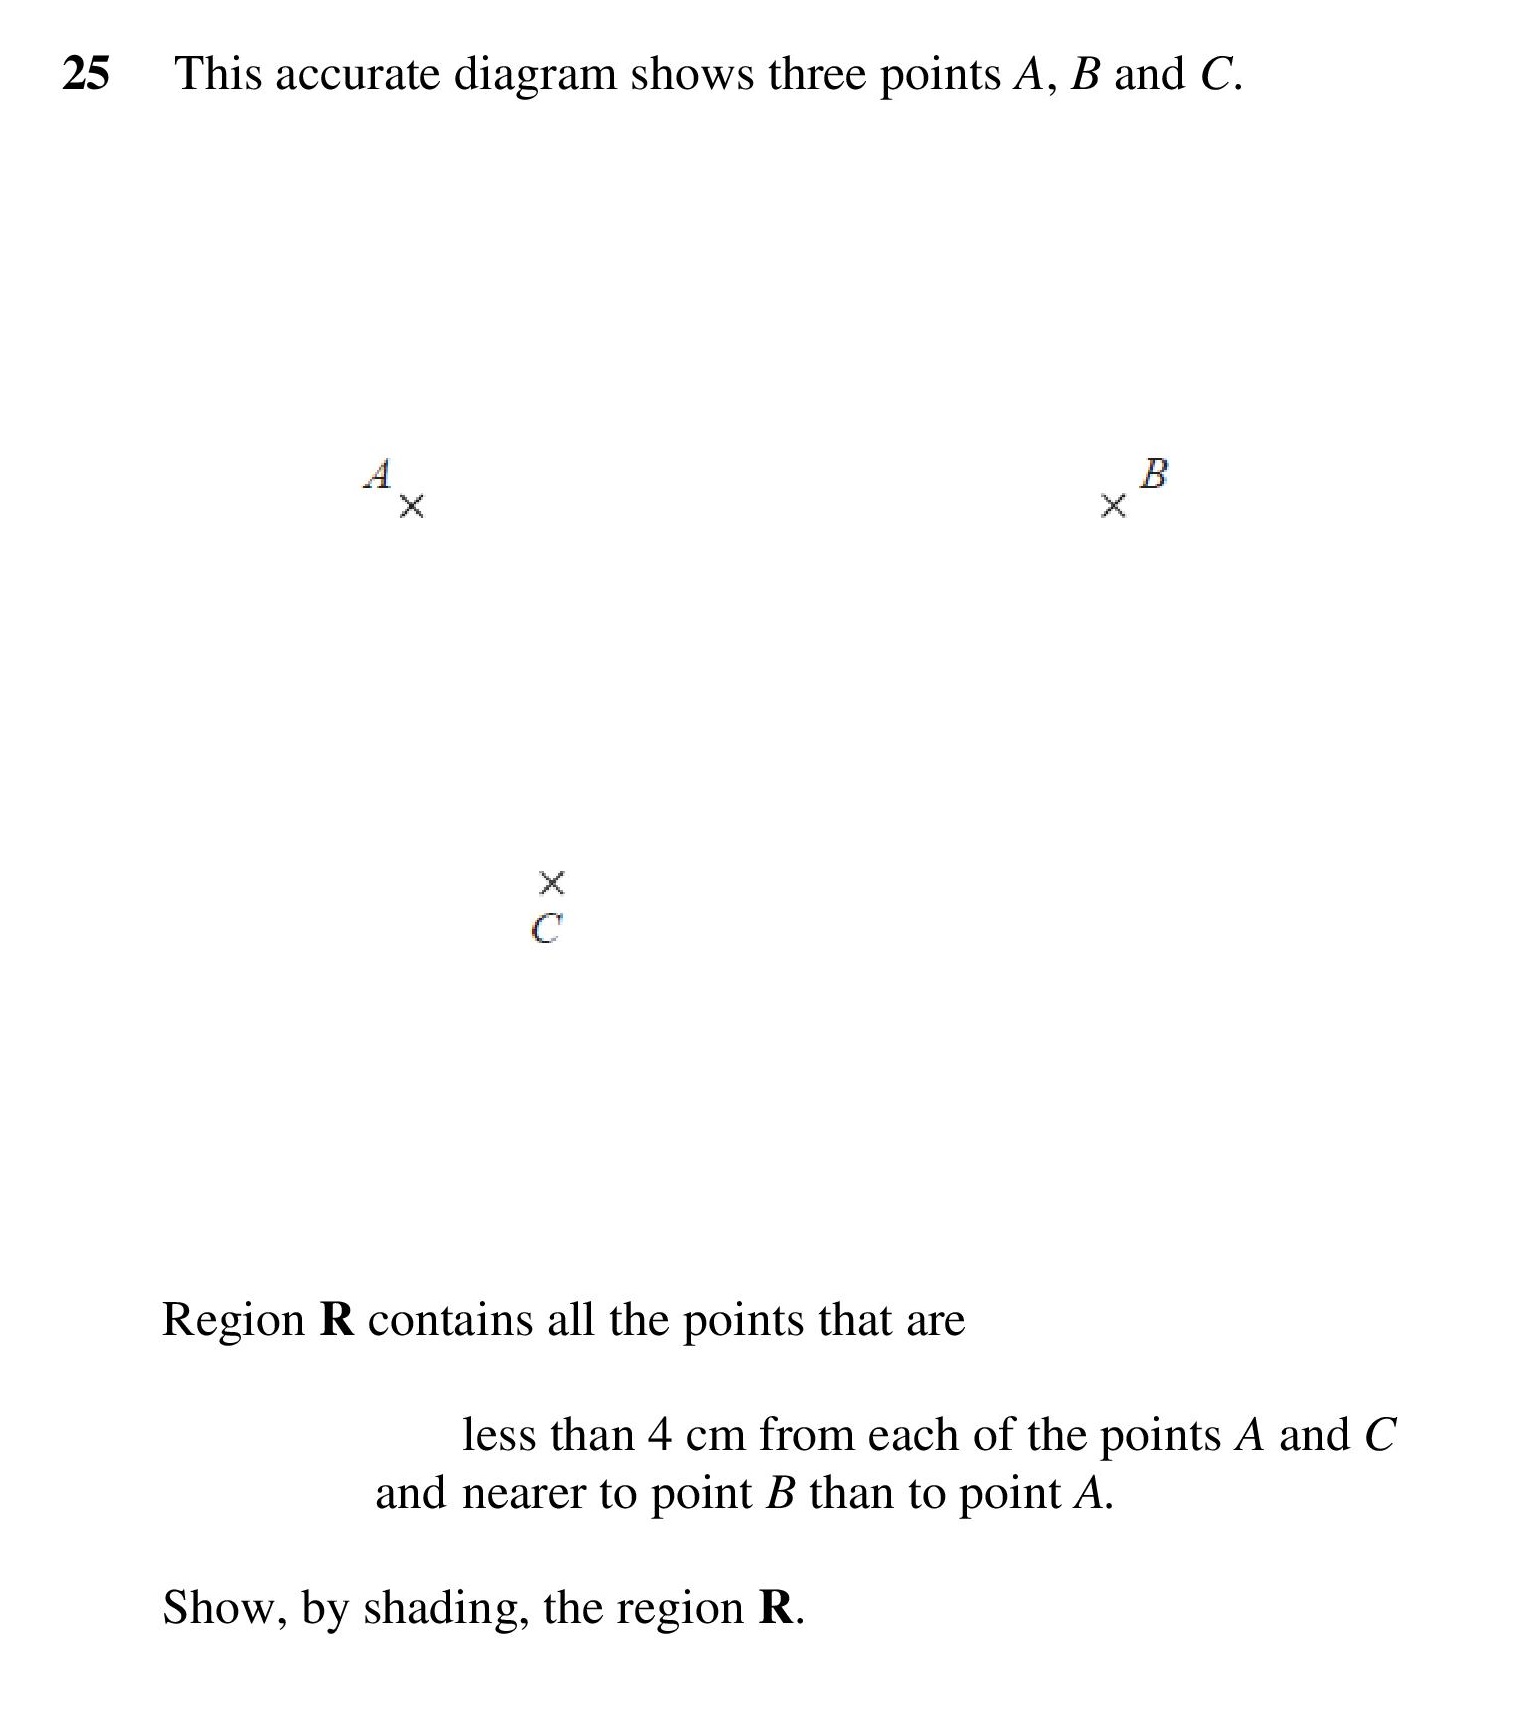
| Loci and Construction | 1 | 3 | 0.5 | 0.13 | 0.37 | |
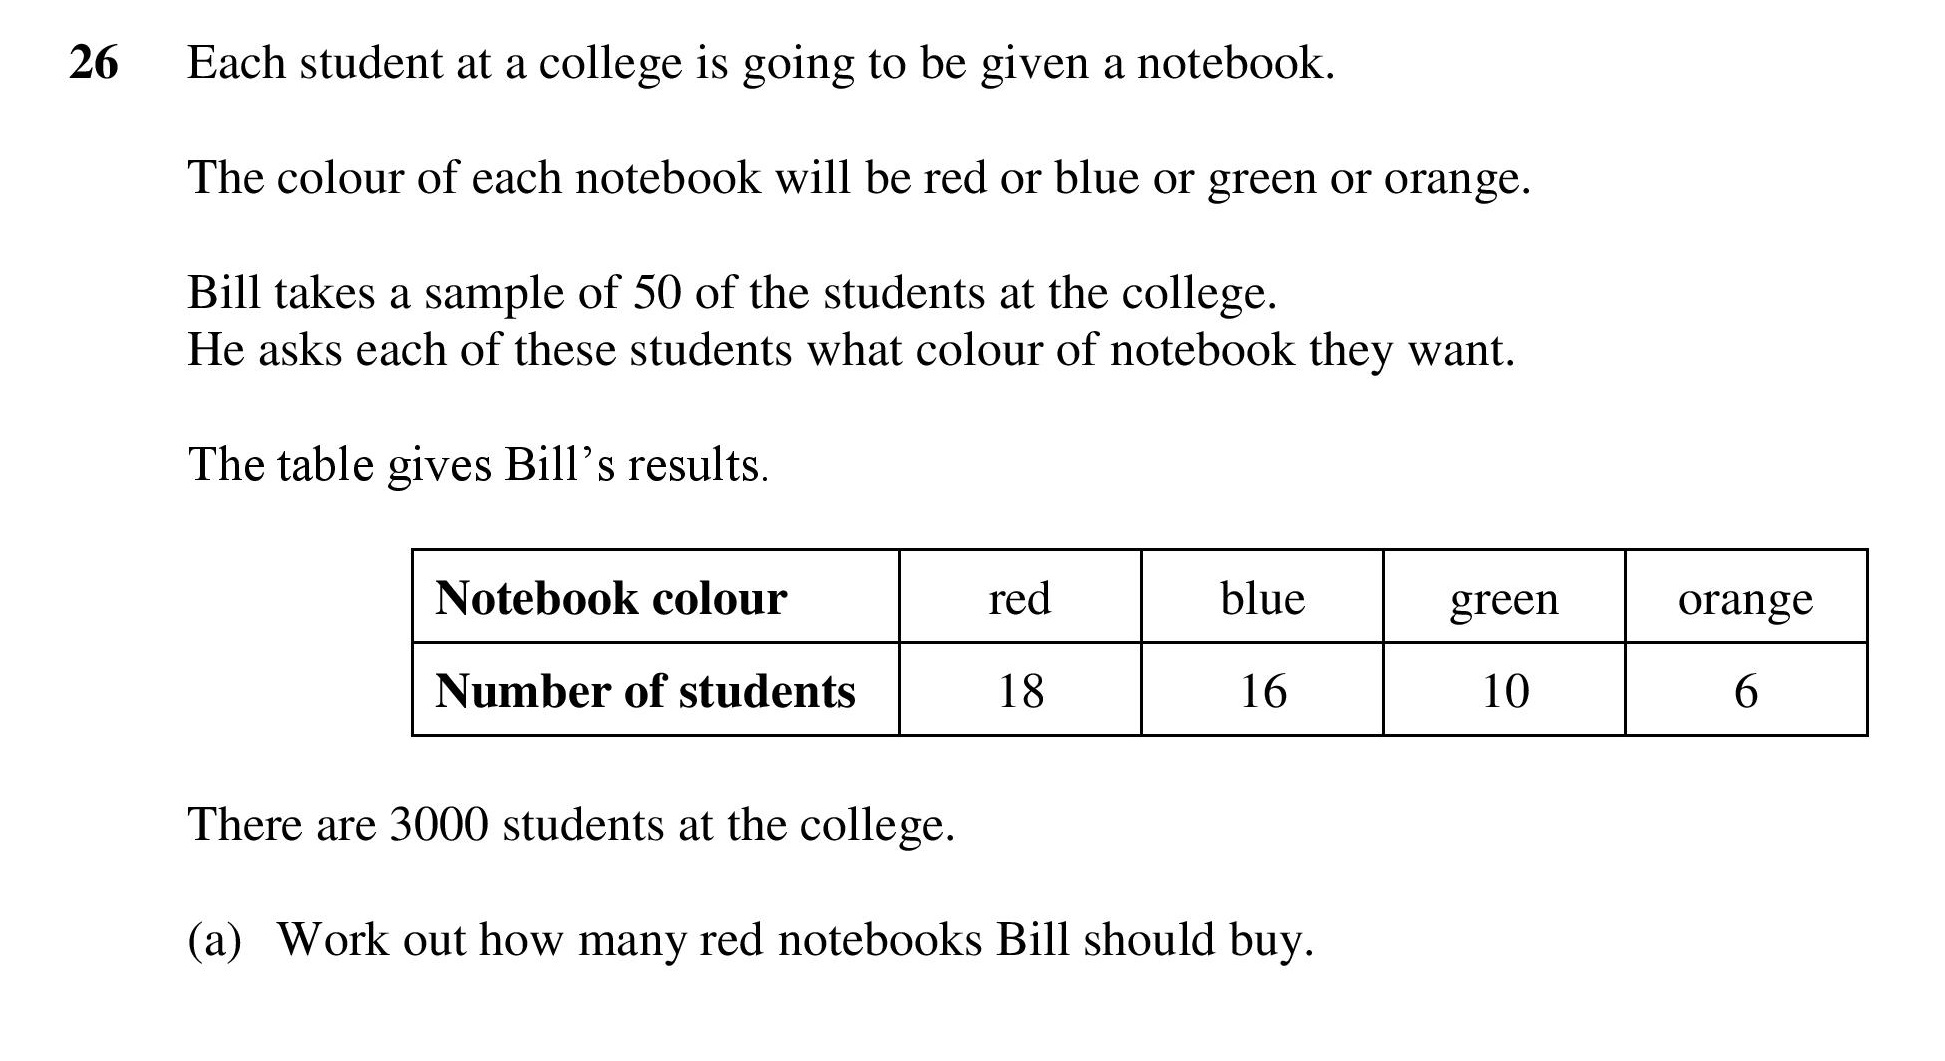
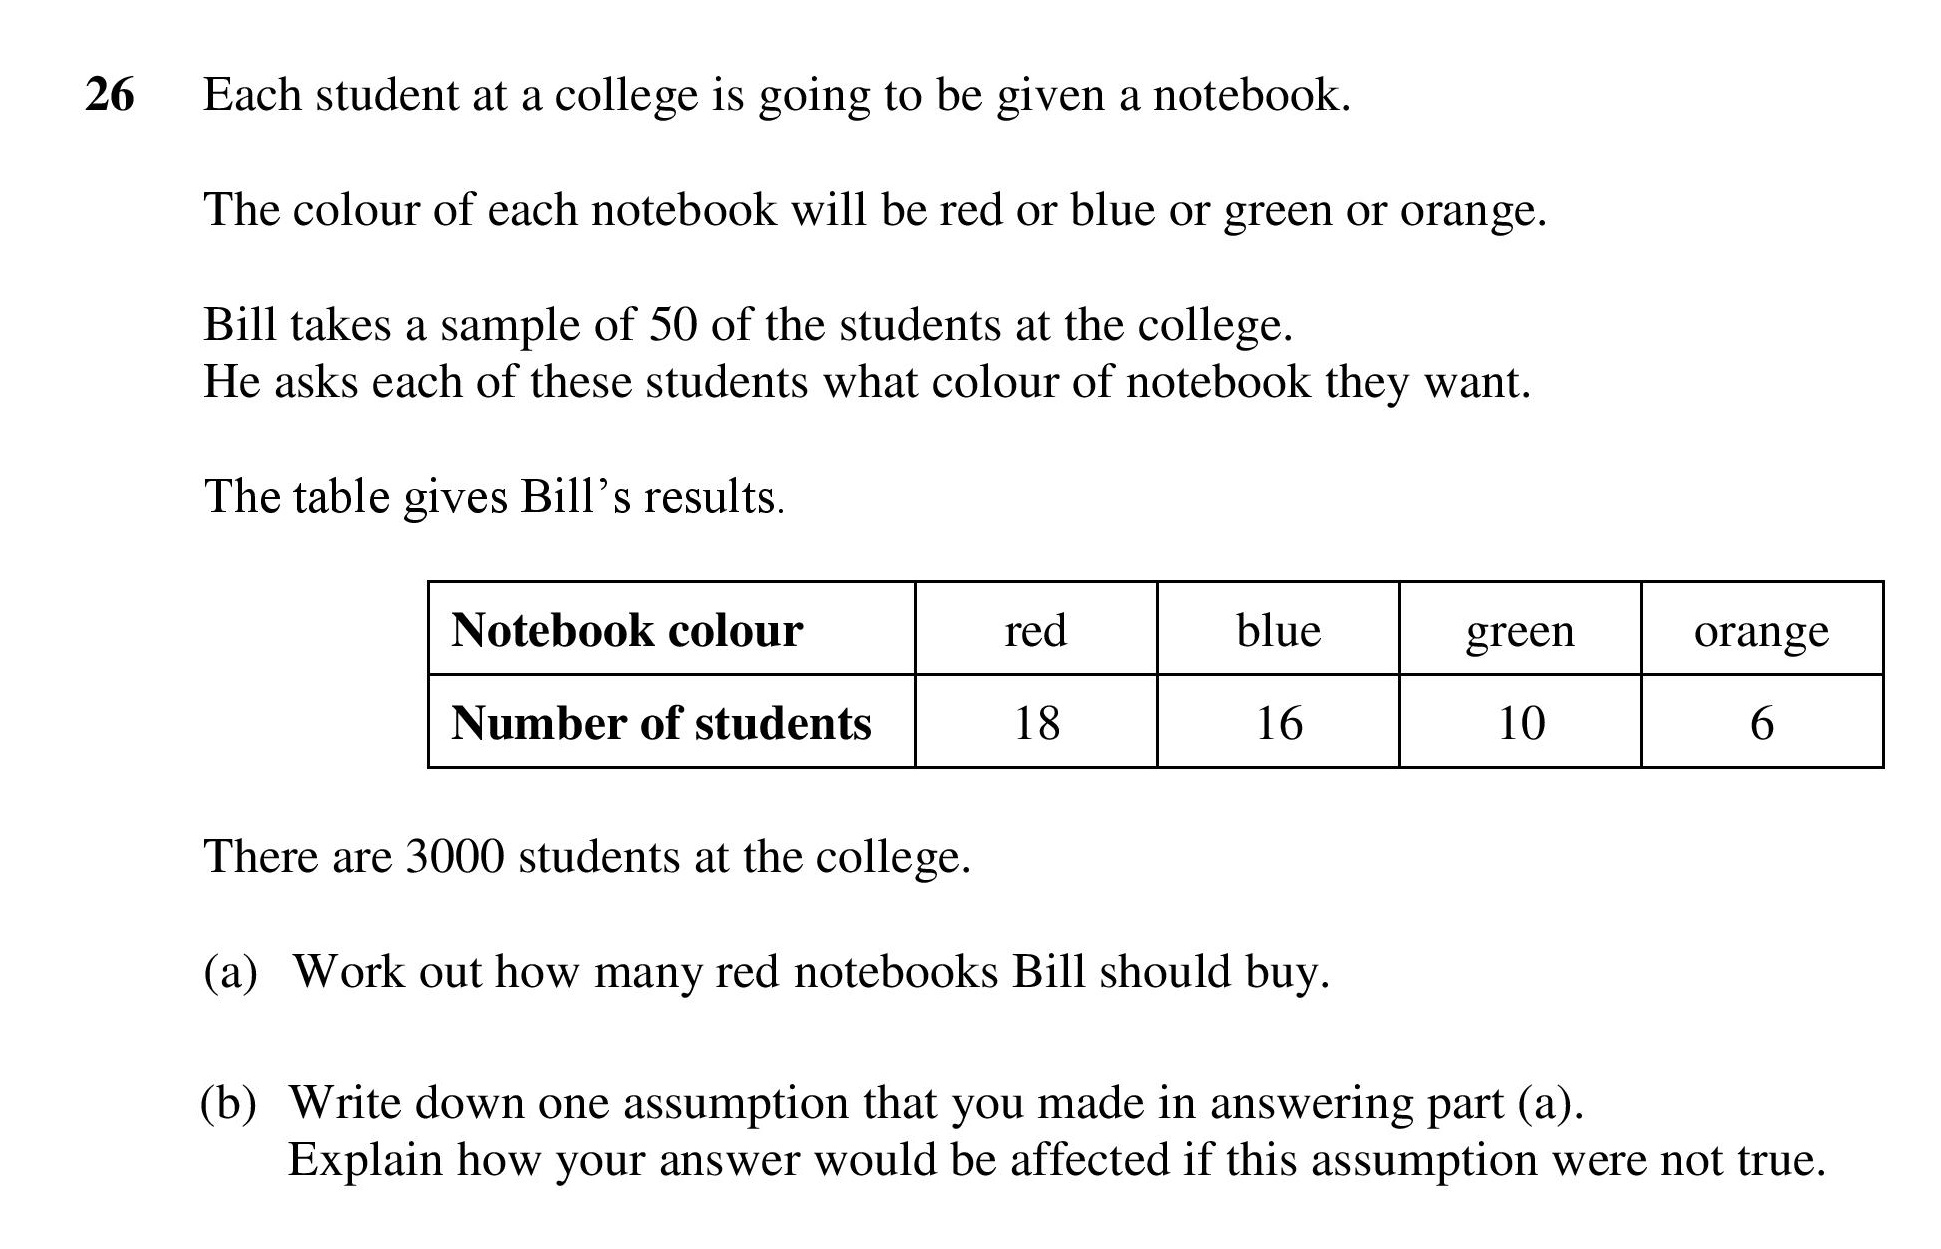
| Stratified Sampling | 2 | 2 | 0.5 | 0.24 | 0.26 | |
| Estimation Assumptions | 2 | 1 | 1.5 | 0.14 | 1.36 | |
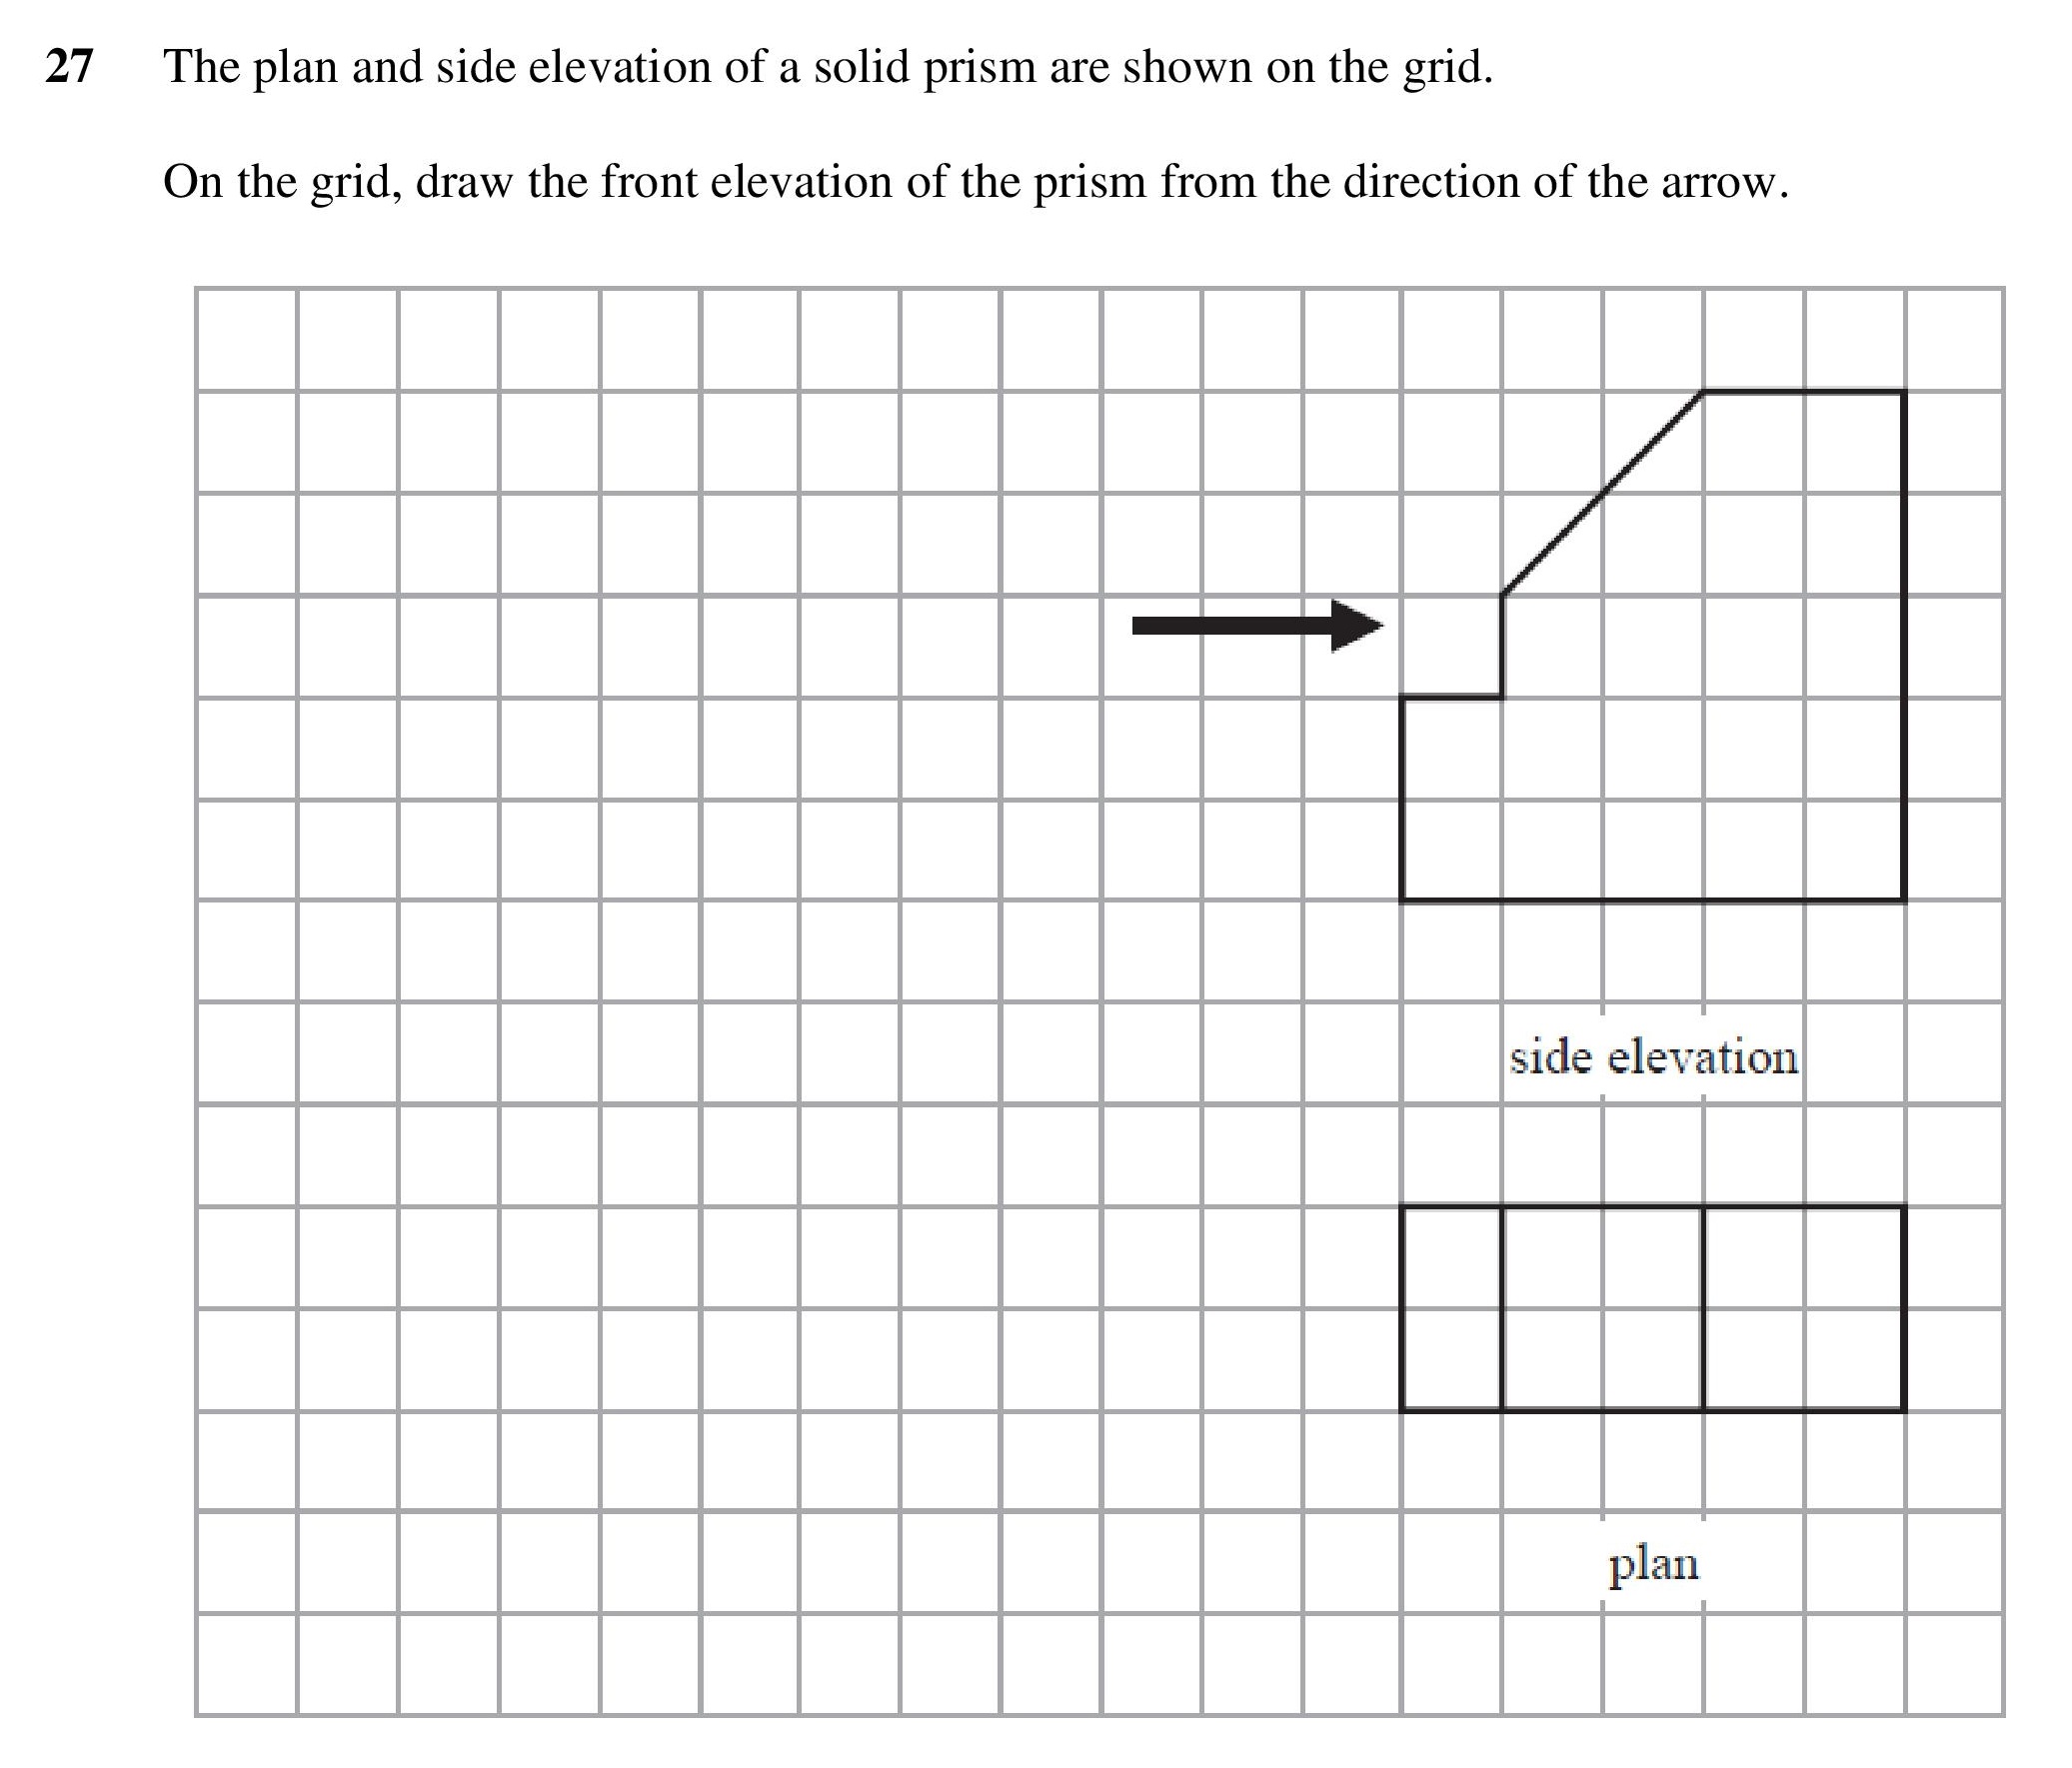
| Plans and Elevations II | 1 | 2 | 0.5 | 0.25 | 0.25 | |
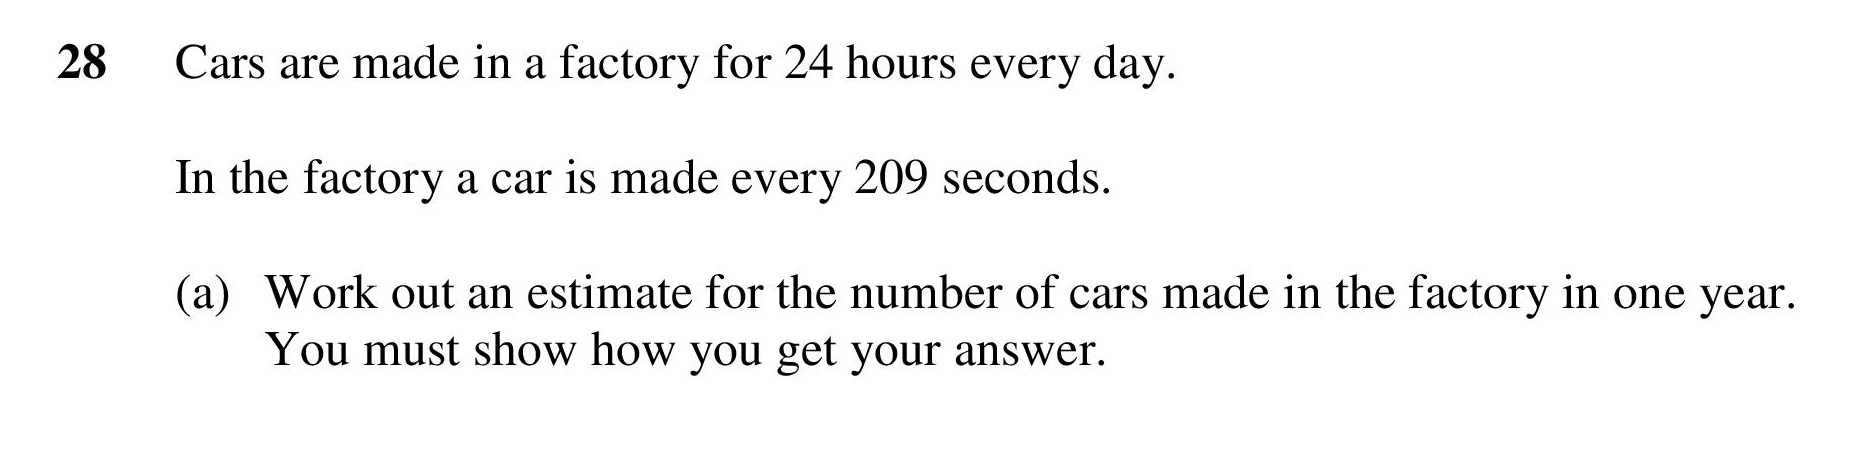
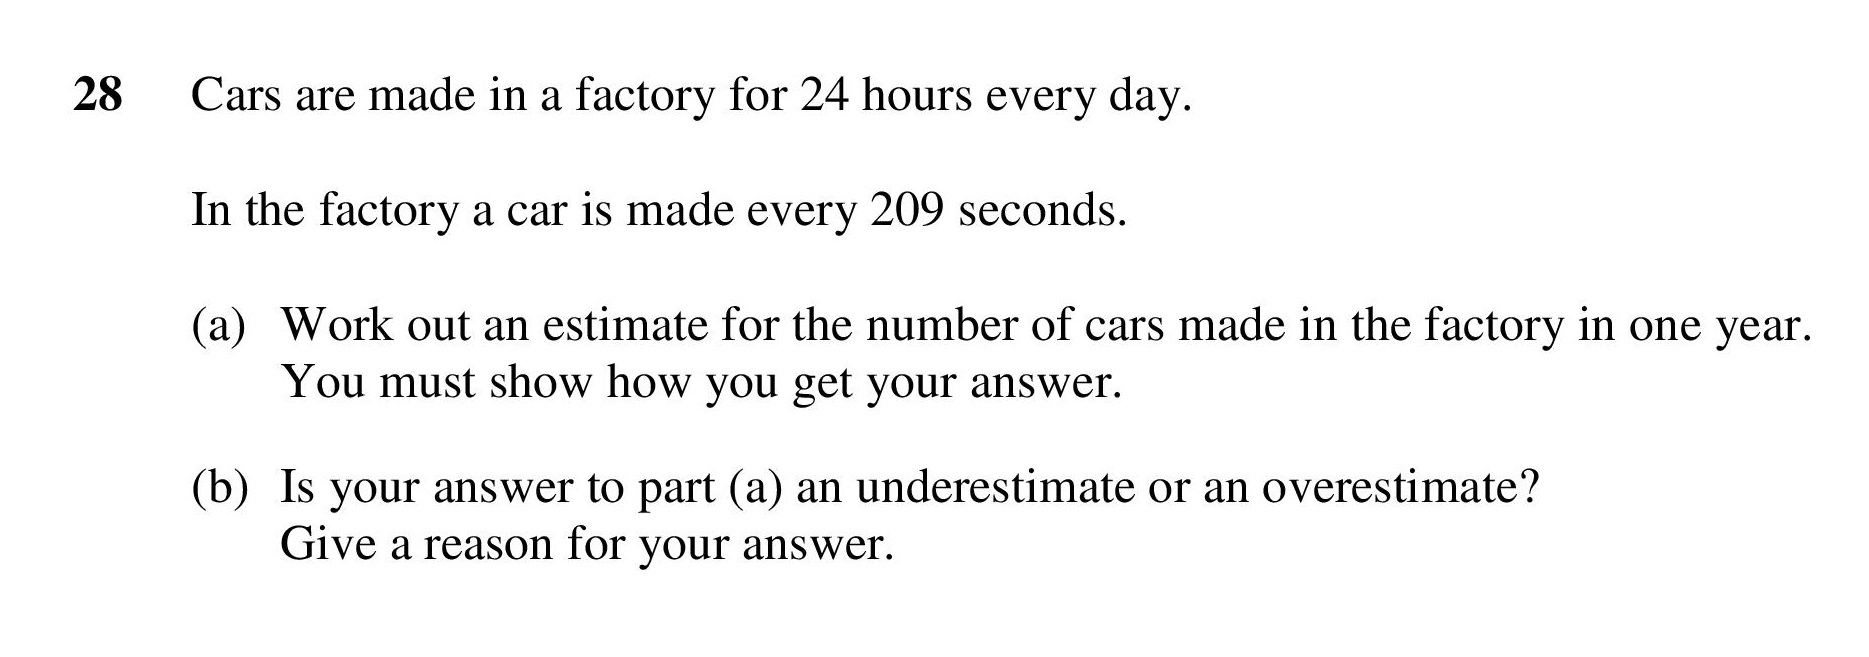
| Estimation and Reasoning | 2 | 4 | 0.38 | 0.12 | 0.26 | |
| Evaluate an Estimate | 2 | 1 | 1 | 0.15 | 0.85 | |
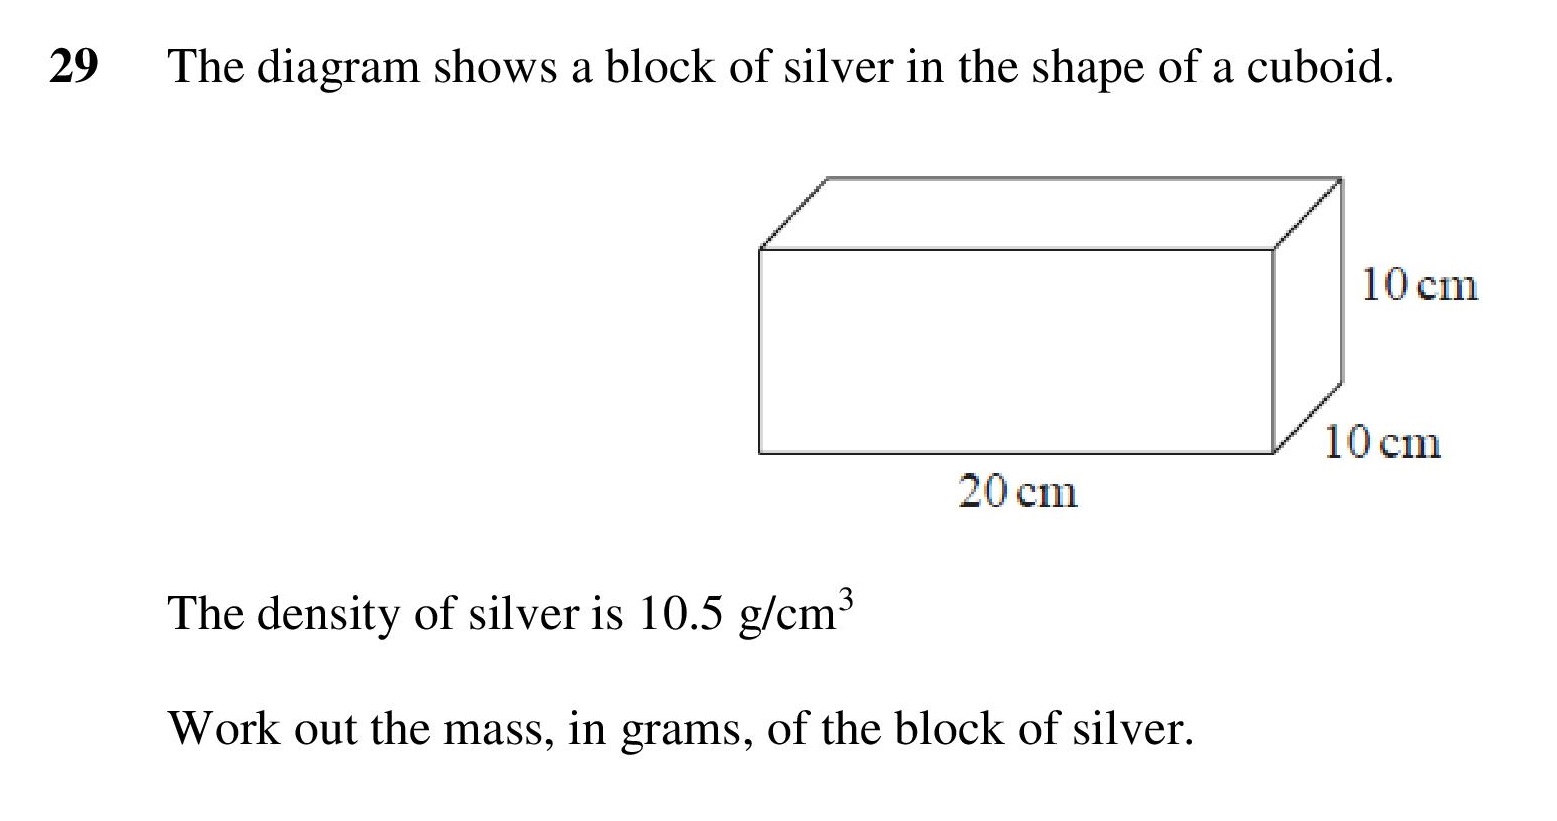
| Finding volume, then mass and density | 3 | 3 | 0.5 | 0.14 | 0.36 | |
| Inequalities | 1 | 2 | 0.5 | 0.2 | 0.3 |