Einstein QLA: Its all relative!
Average marks for your class or department are compared to all the other pinpoint schools
who have uploaded for this test.
Average marks for your class or department are compared to all the other pinpoint schools
who have uploaded for this test.
| Question | Topic | AO Strand | Max Mark | SetA Average per mark | Pinpoint Average | Average Difference |
|---|---|---|---|---|---|---|
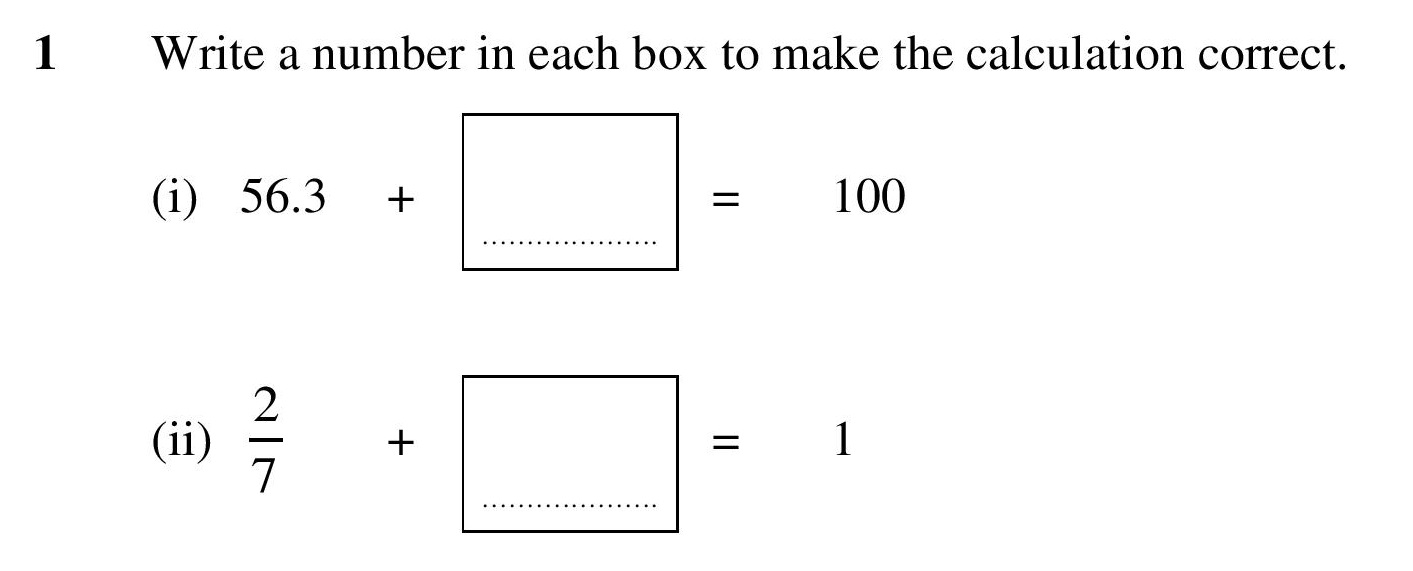
| Decimal and Fractional Number Bonds | 1 | 2 | 0.5 | 0.77 | -0.27 | |
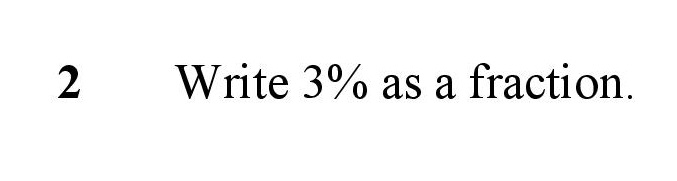
| Fractions, Decimals and % | 1 | 1 | 0.5 | 0.67 | -0.17 | |
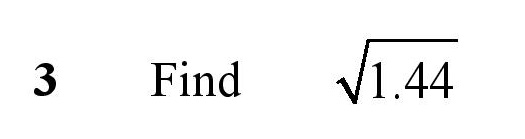
| Use Calculator to find Square Root | 1 | 1 | 1 | 0.89 | 0.11 | |
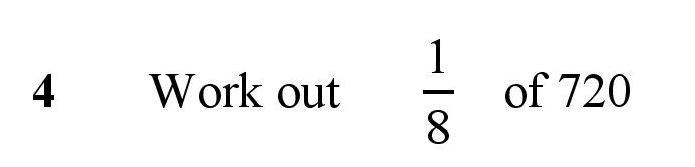
| Fractions of Amounts | 1 | 1 | 0.5 | 0.77 | -0.27 | |
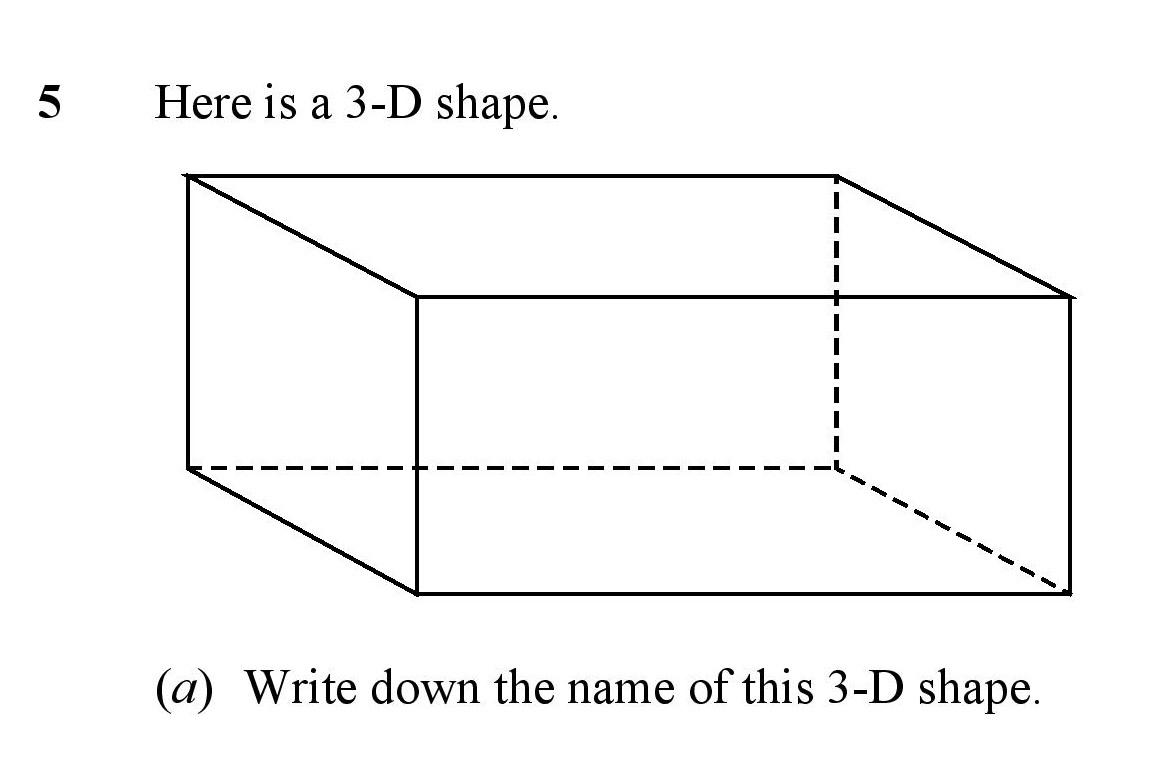
| Identify a 3D Shape | 1 | 1 | 1 | 0.73 | 0.27 | |
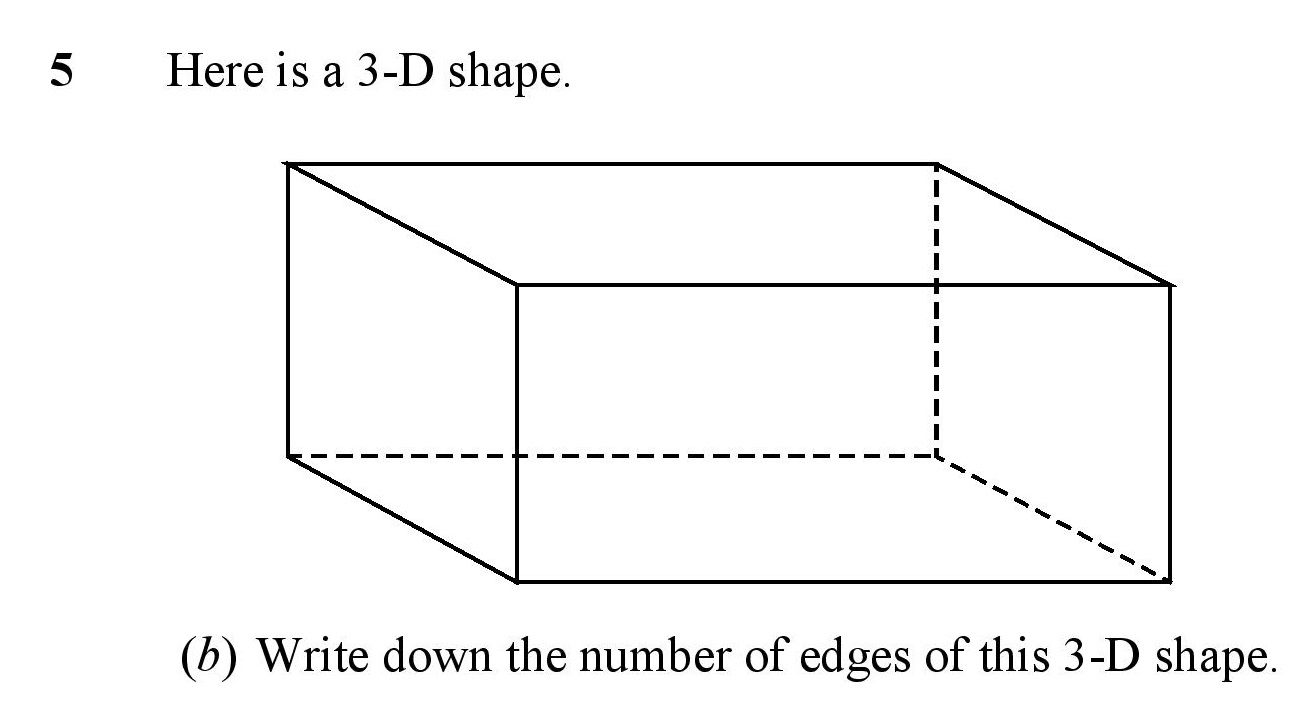
| Faces, Edges and Vertices | 1 | 1 | 1 | 0.59 | 0.41 | |
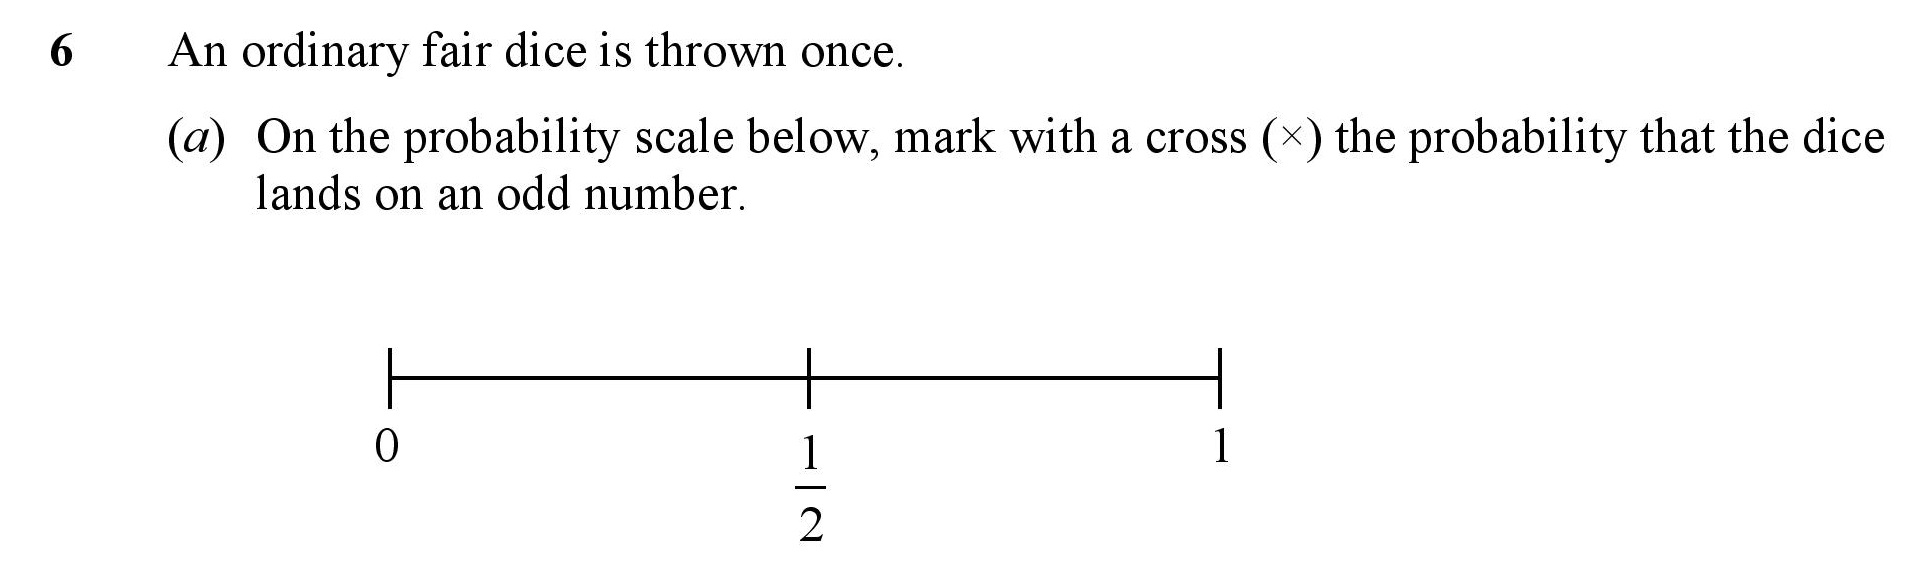
| Probability Scales and Words | 1 | 1 | 1.5 | 0.81 | 0.69 | |
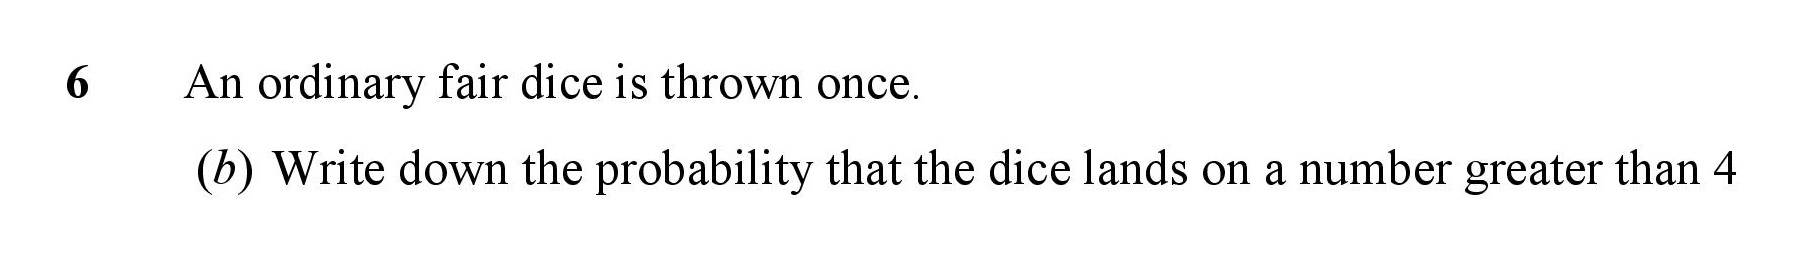
| Simple Probability | 1 | 1 | 1 | 0.62 | 0.38 | |
| Metric Conversions | 1 | 2 | 0.75 | 0.57 | 0.18 | |
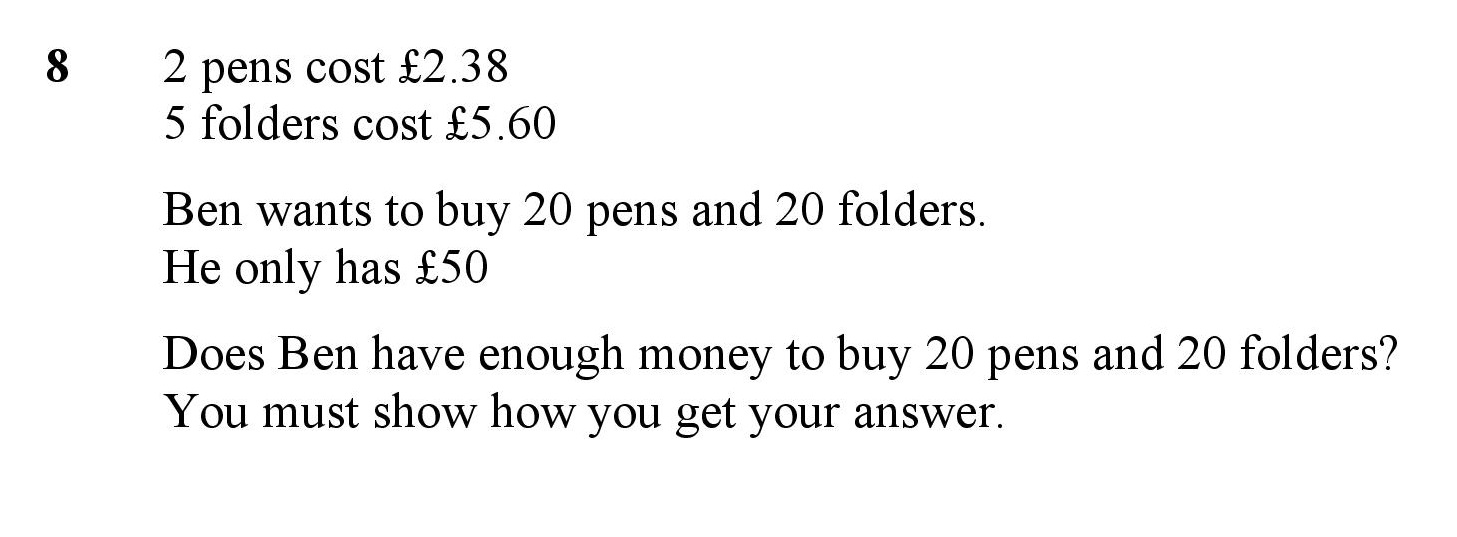
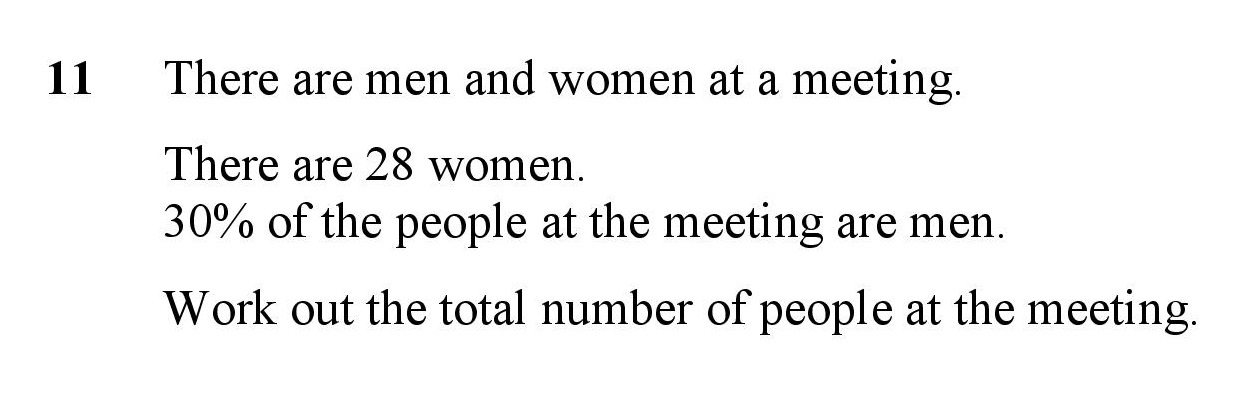
| Money Problems | 2 | 4 | 0.25 | 0.78 | -0.53 | |
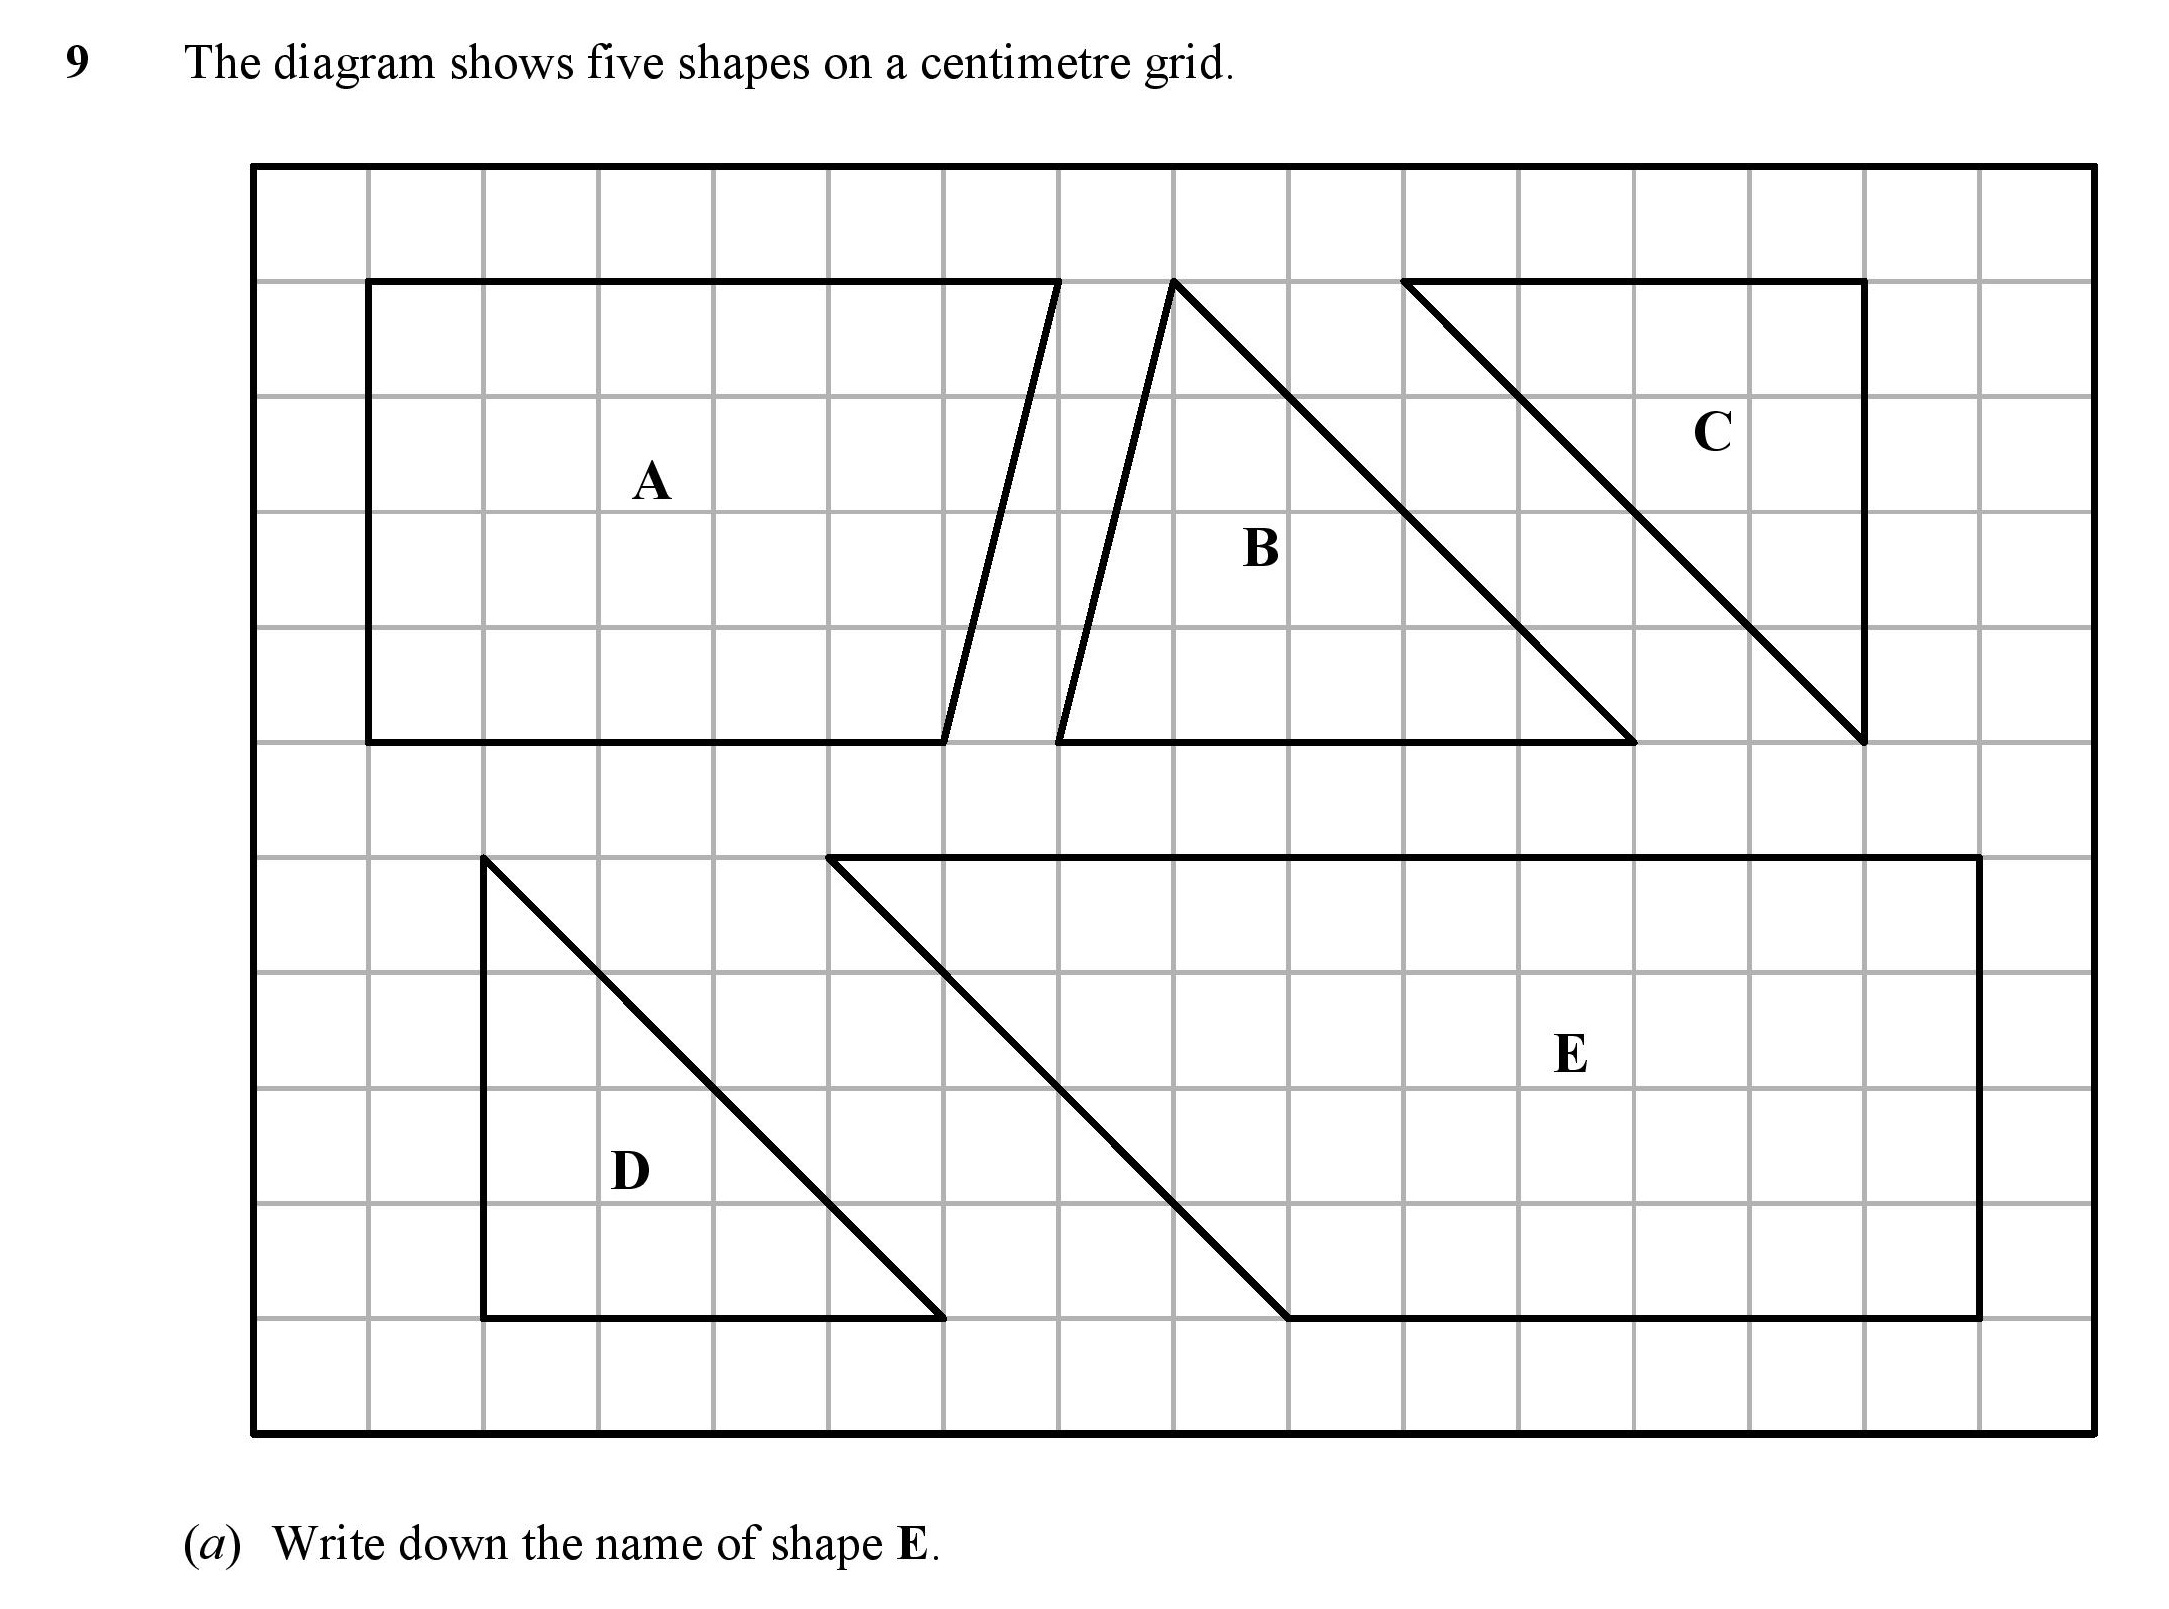
| Identify 2D Shapes | 1 | 1 | 1.5 | 0.38 | 1.12 | |
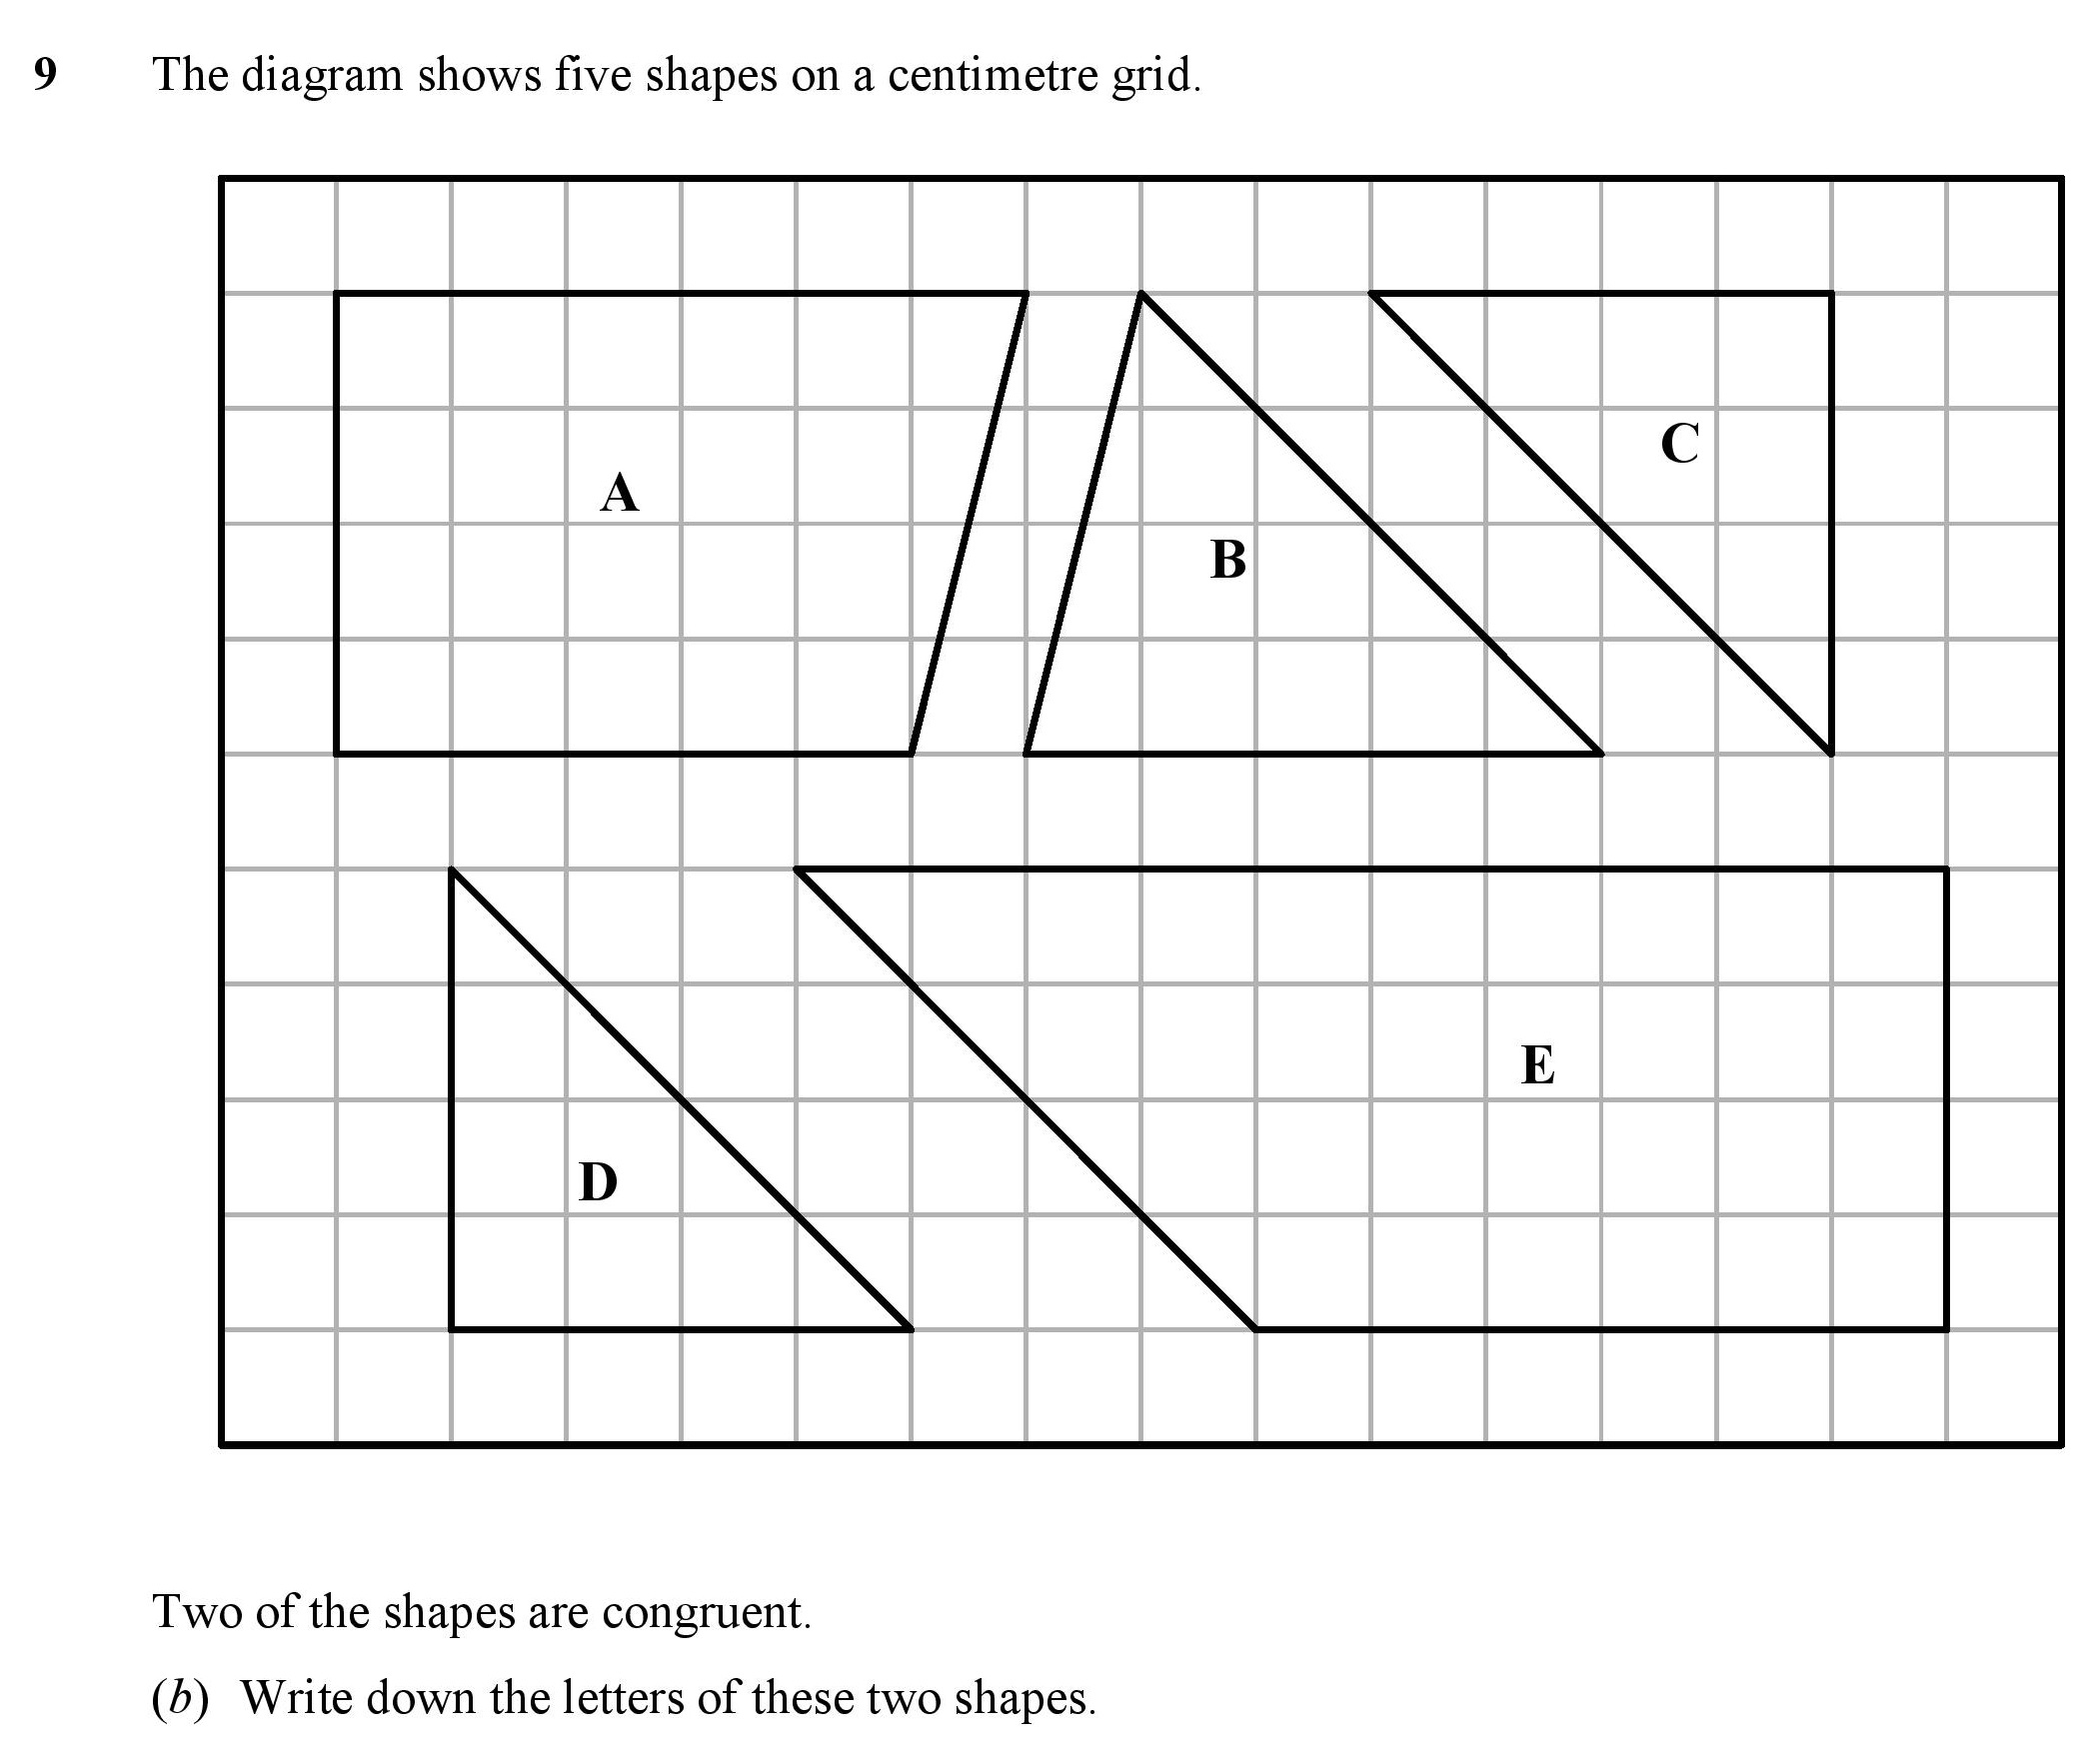
| Congruent Shapes | 1 | 1 | 1 | 0.75 | 0.25 | |
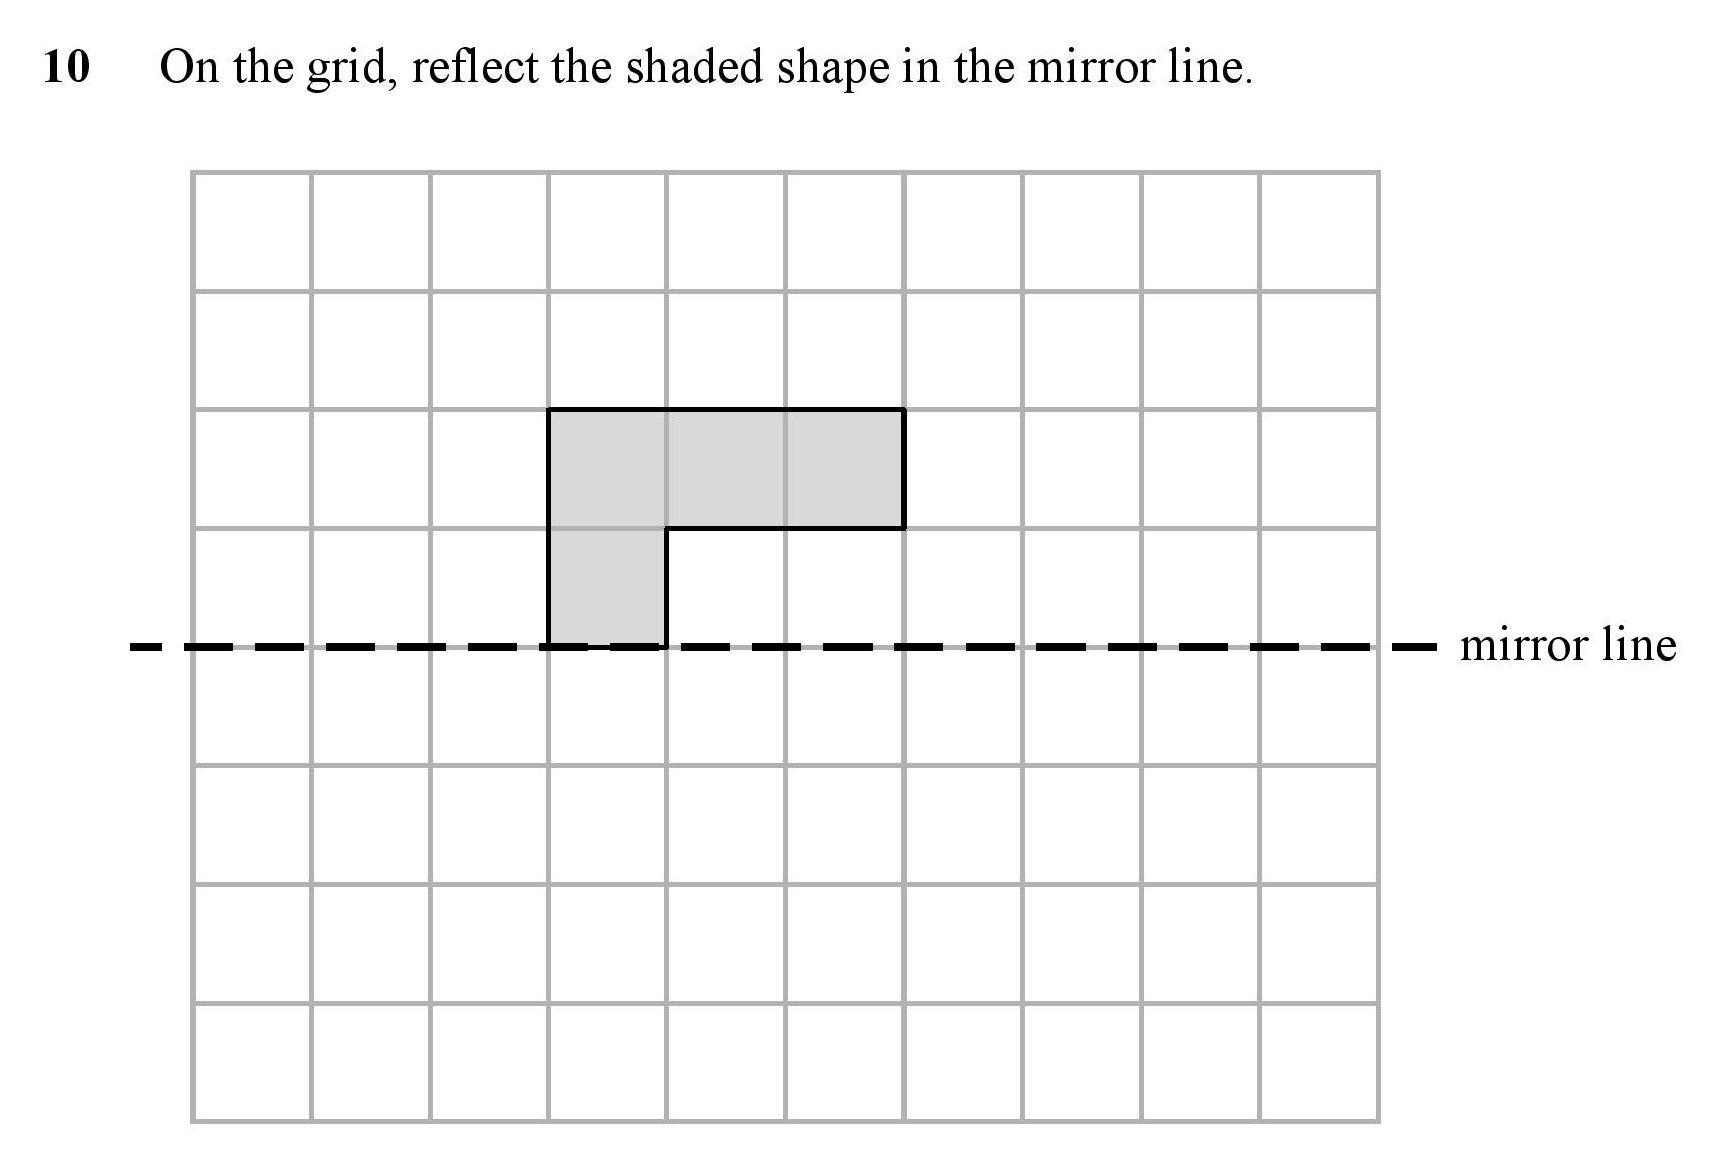
| Reflection with Diagrams | 1 | 1 | 1.5 | 0.9 | 0.6 | |
| Percentage Problem | 2 | 3 | 0.33 | 0.25 | 0.08 | |
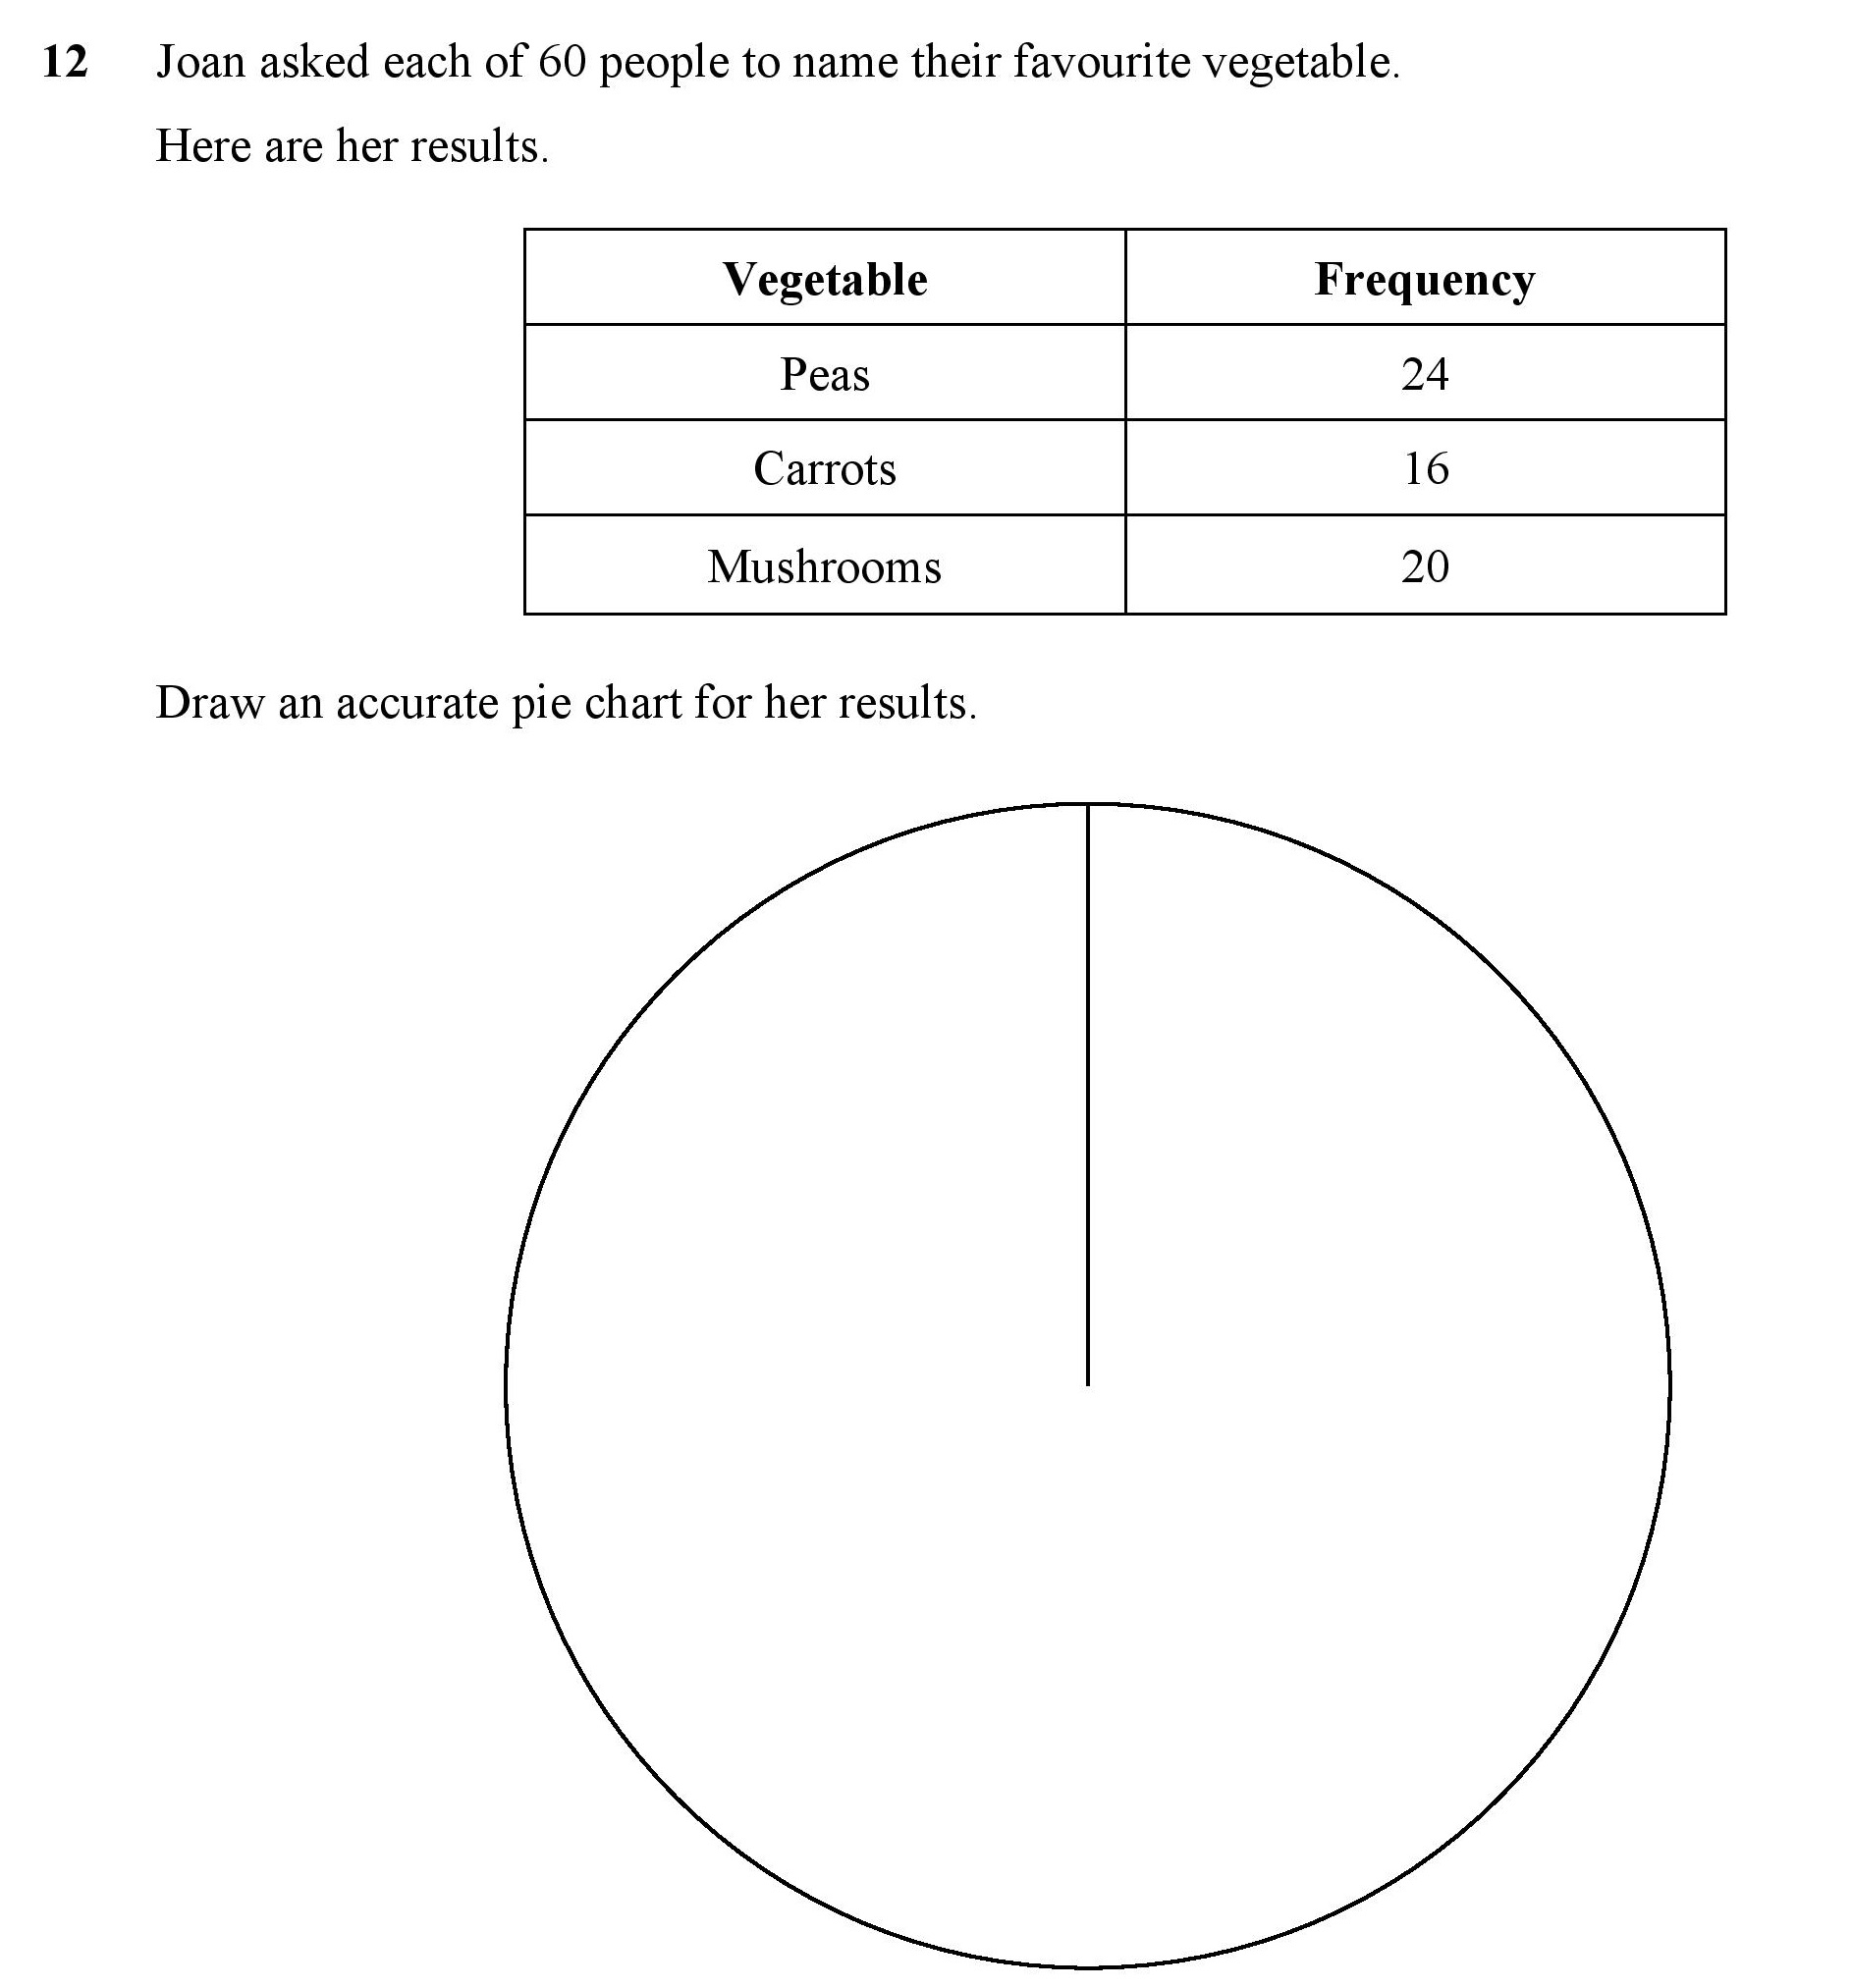
| Pie Charts | 1 | 3 | 0.5 | 0.41 | 0.09 | |
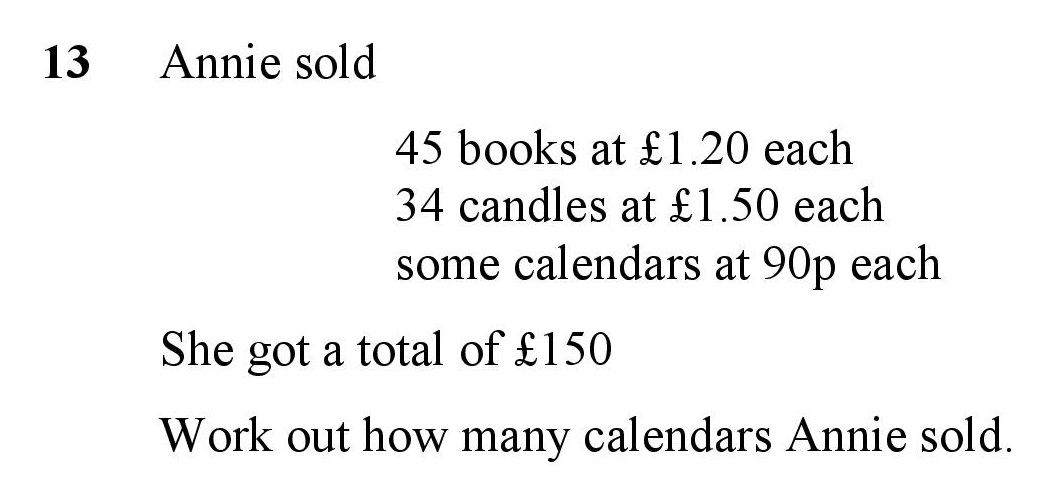
| Worded Division Problems | 3 | 4 | 0.25 | 0.71 | -0.46 | |
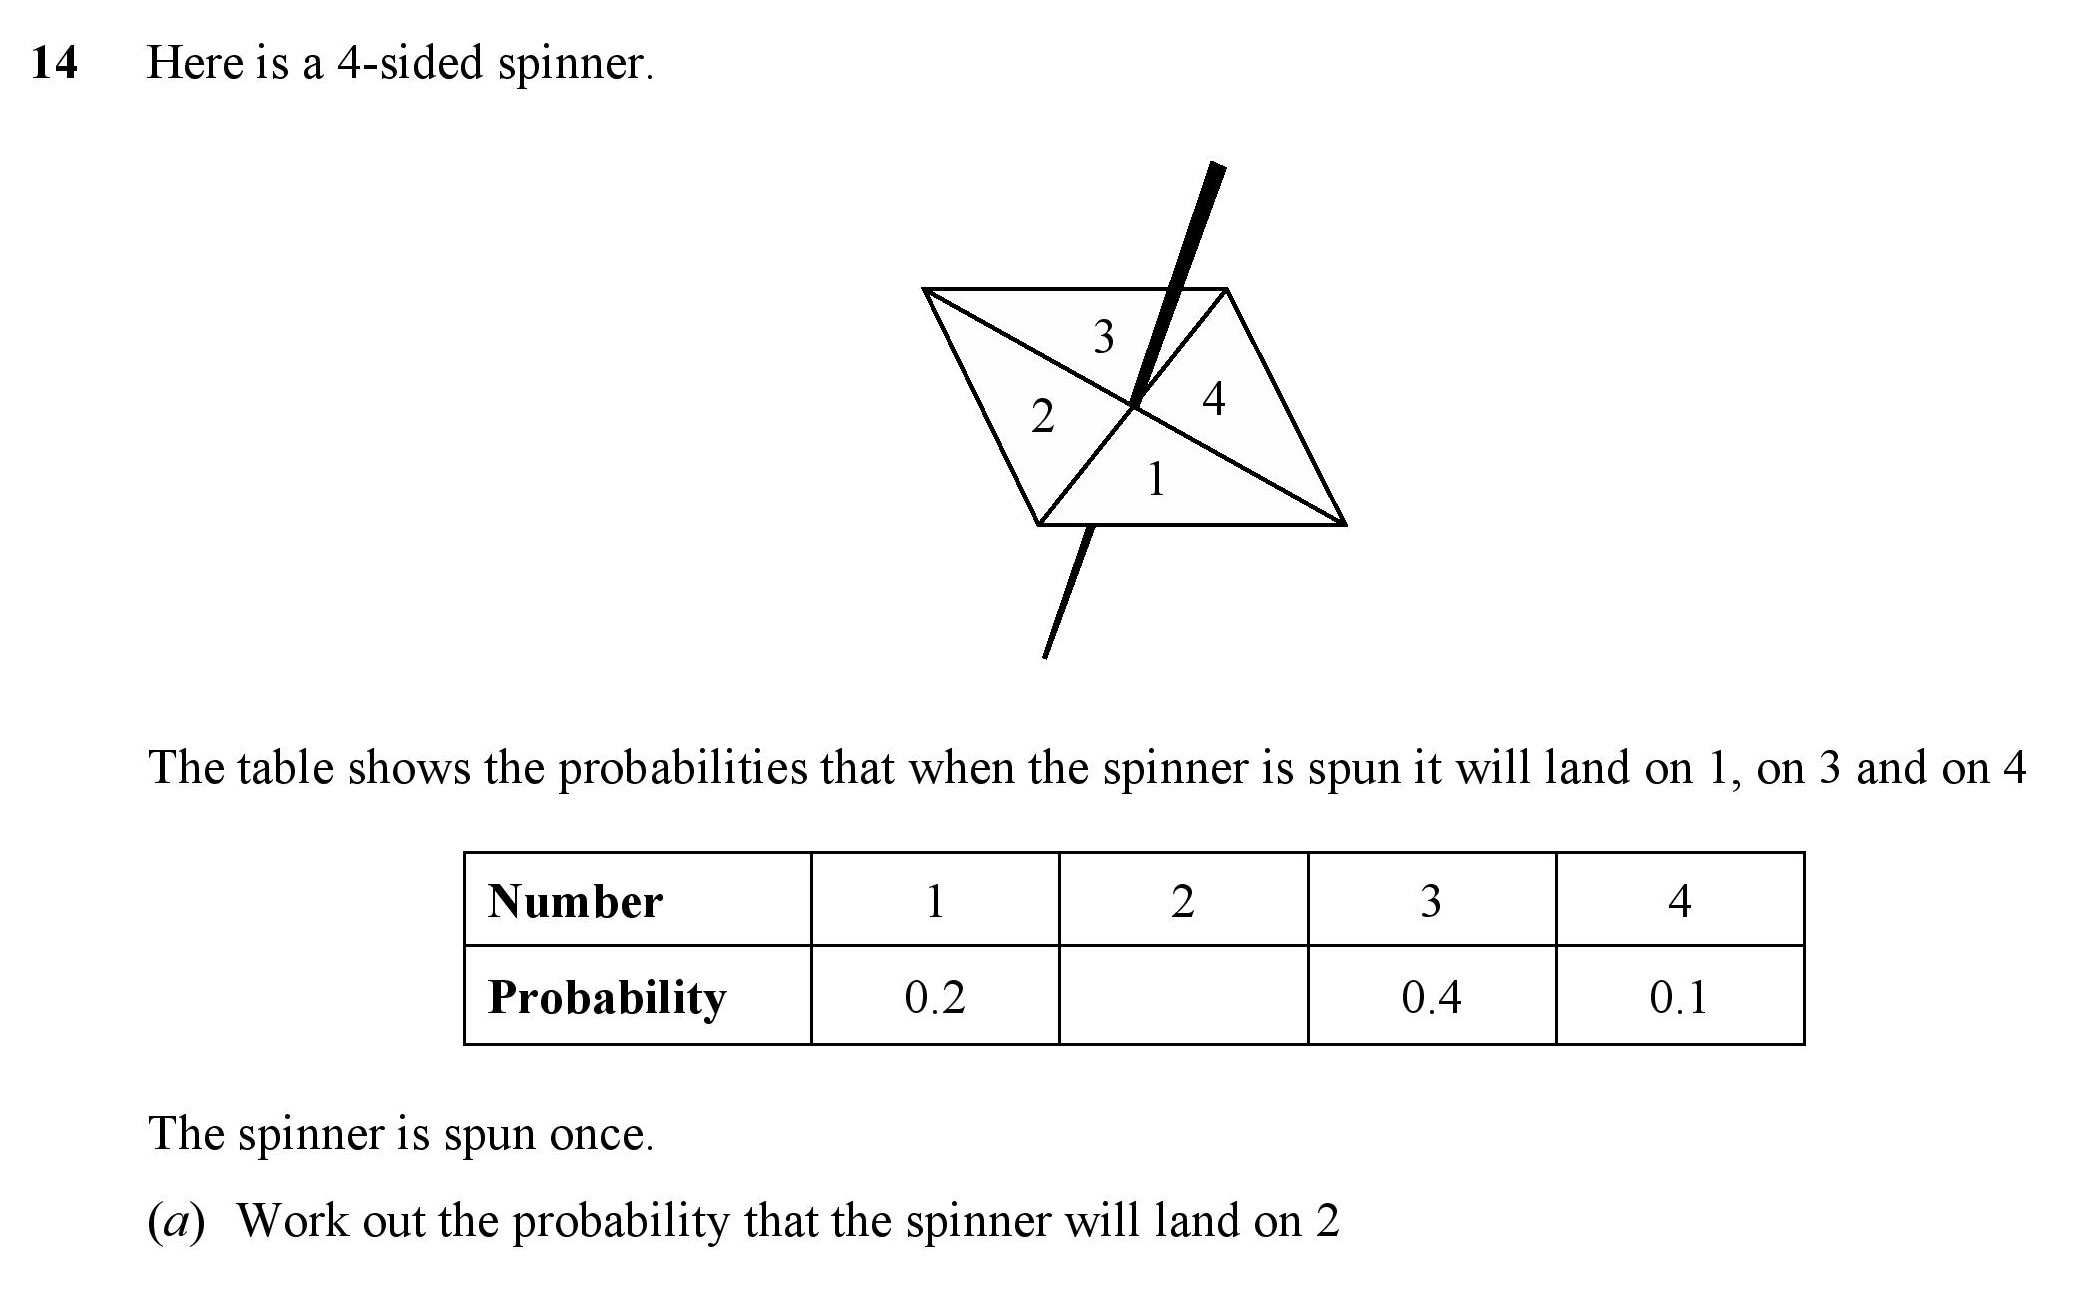
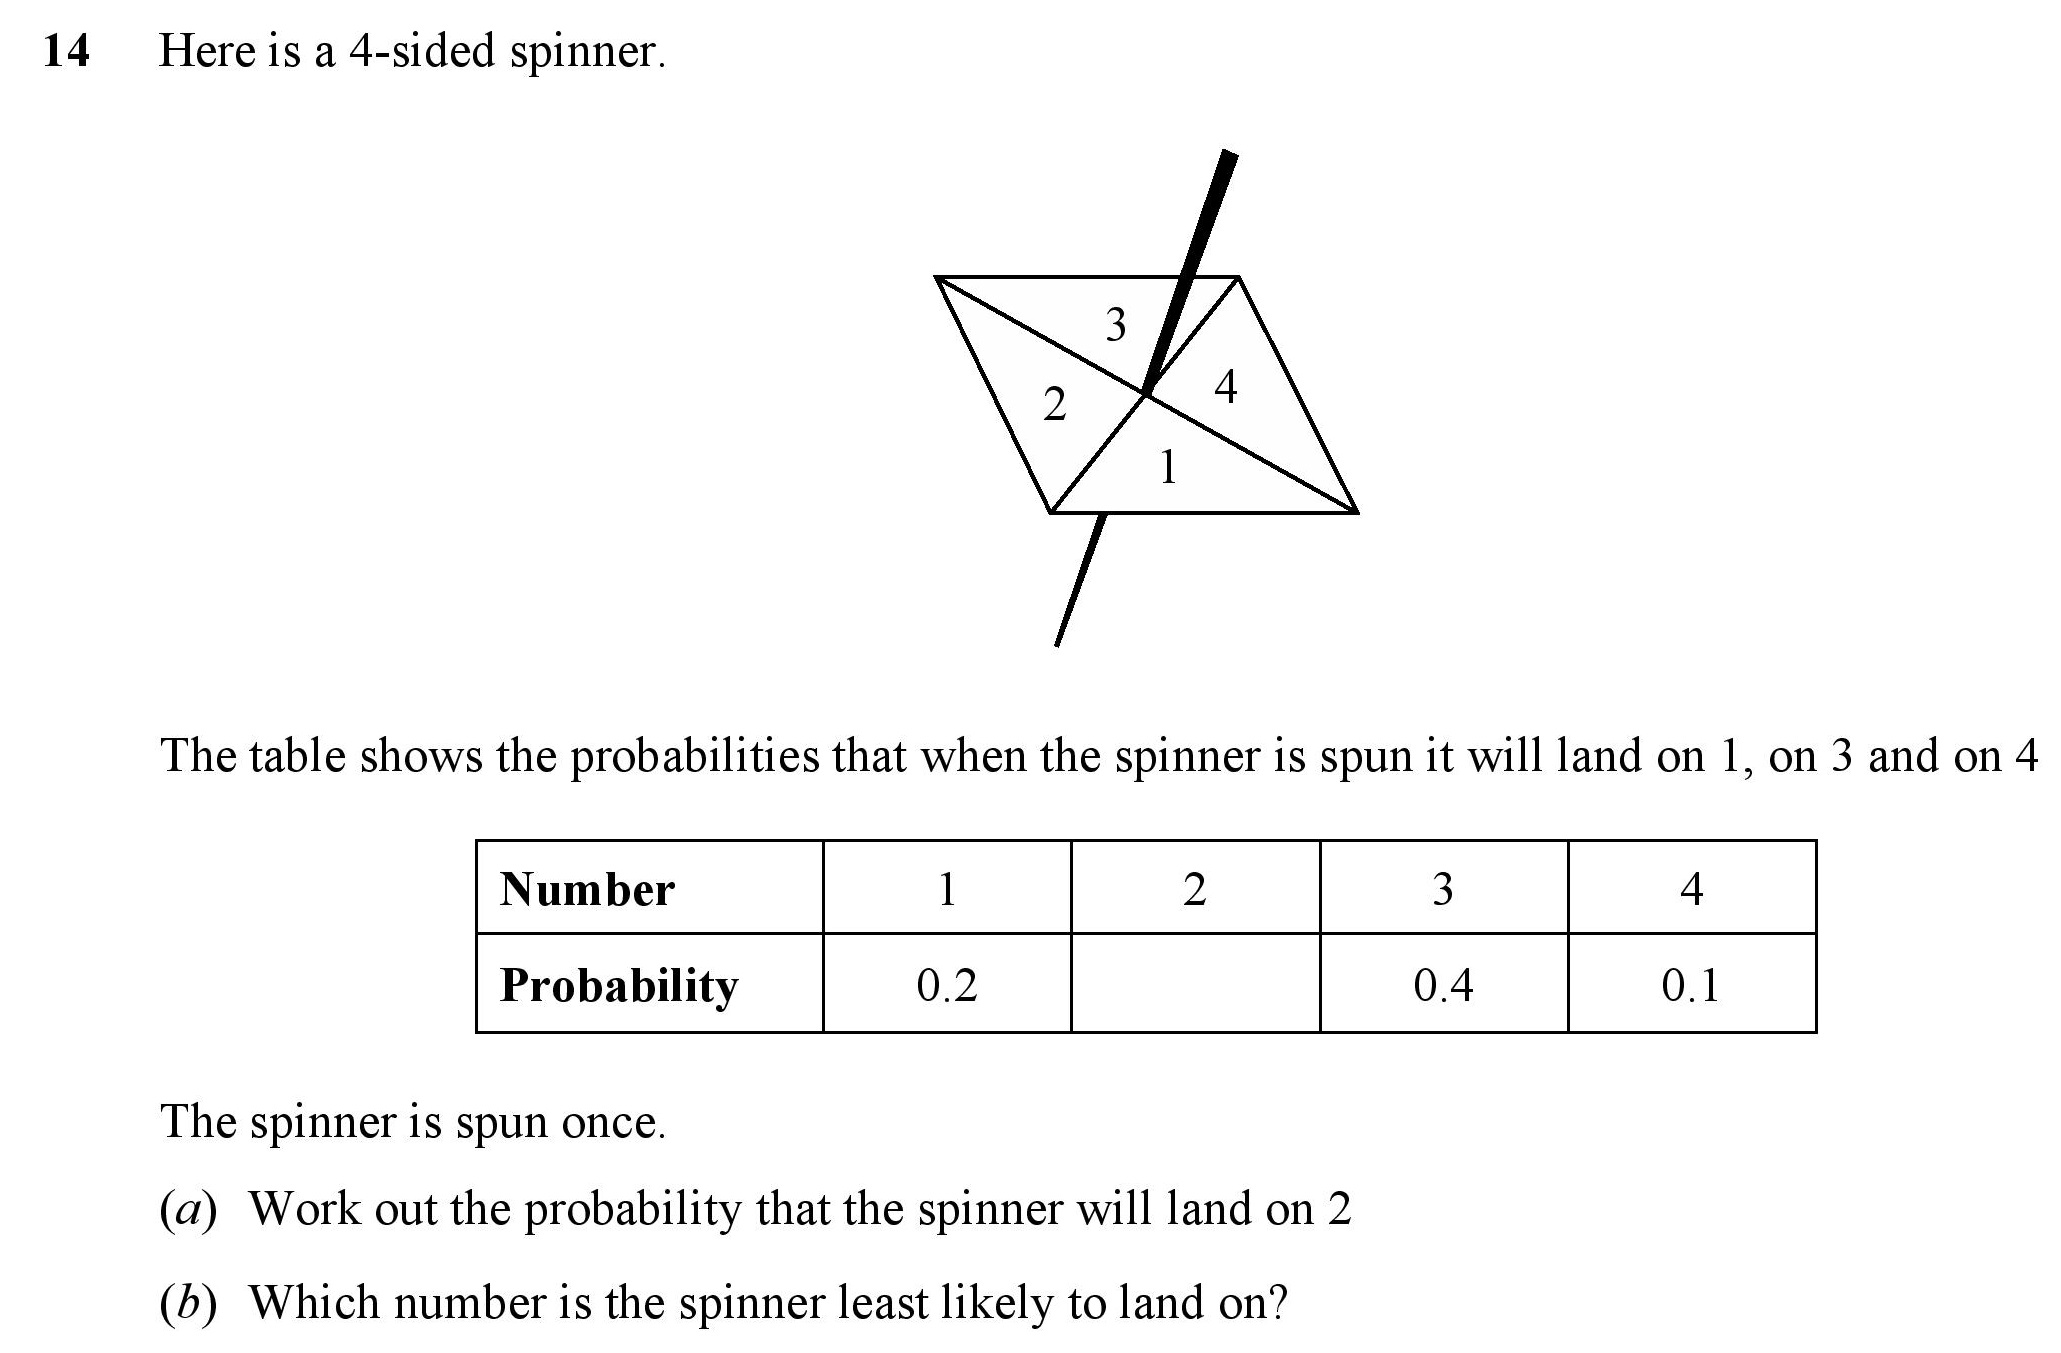
| Probability from tables | 1 | 1 | 1.5 | 0.82 | 0.68 | |
| Comparing Probabilities | 1 | 1 | 1 | 0.76 | 0.24 | |
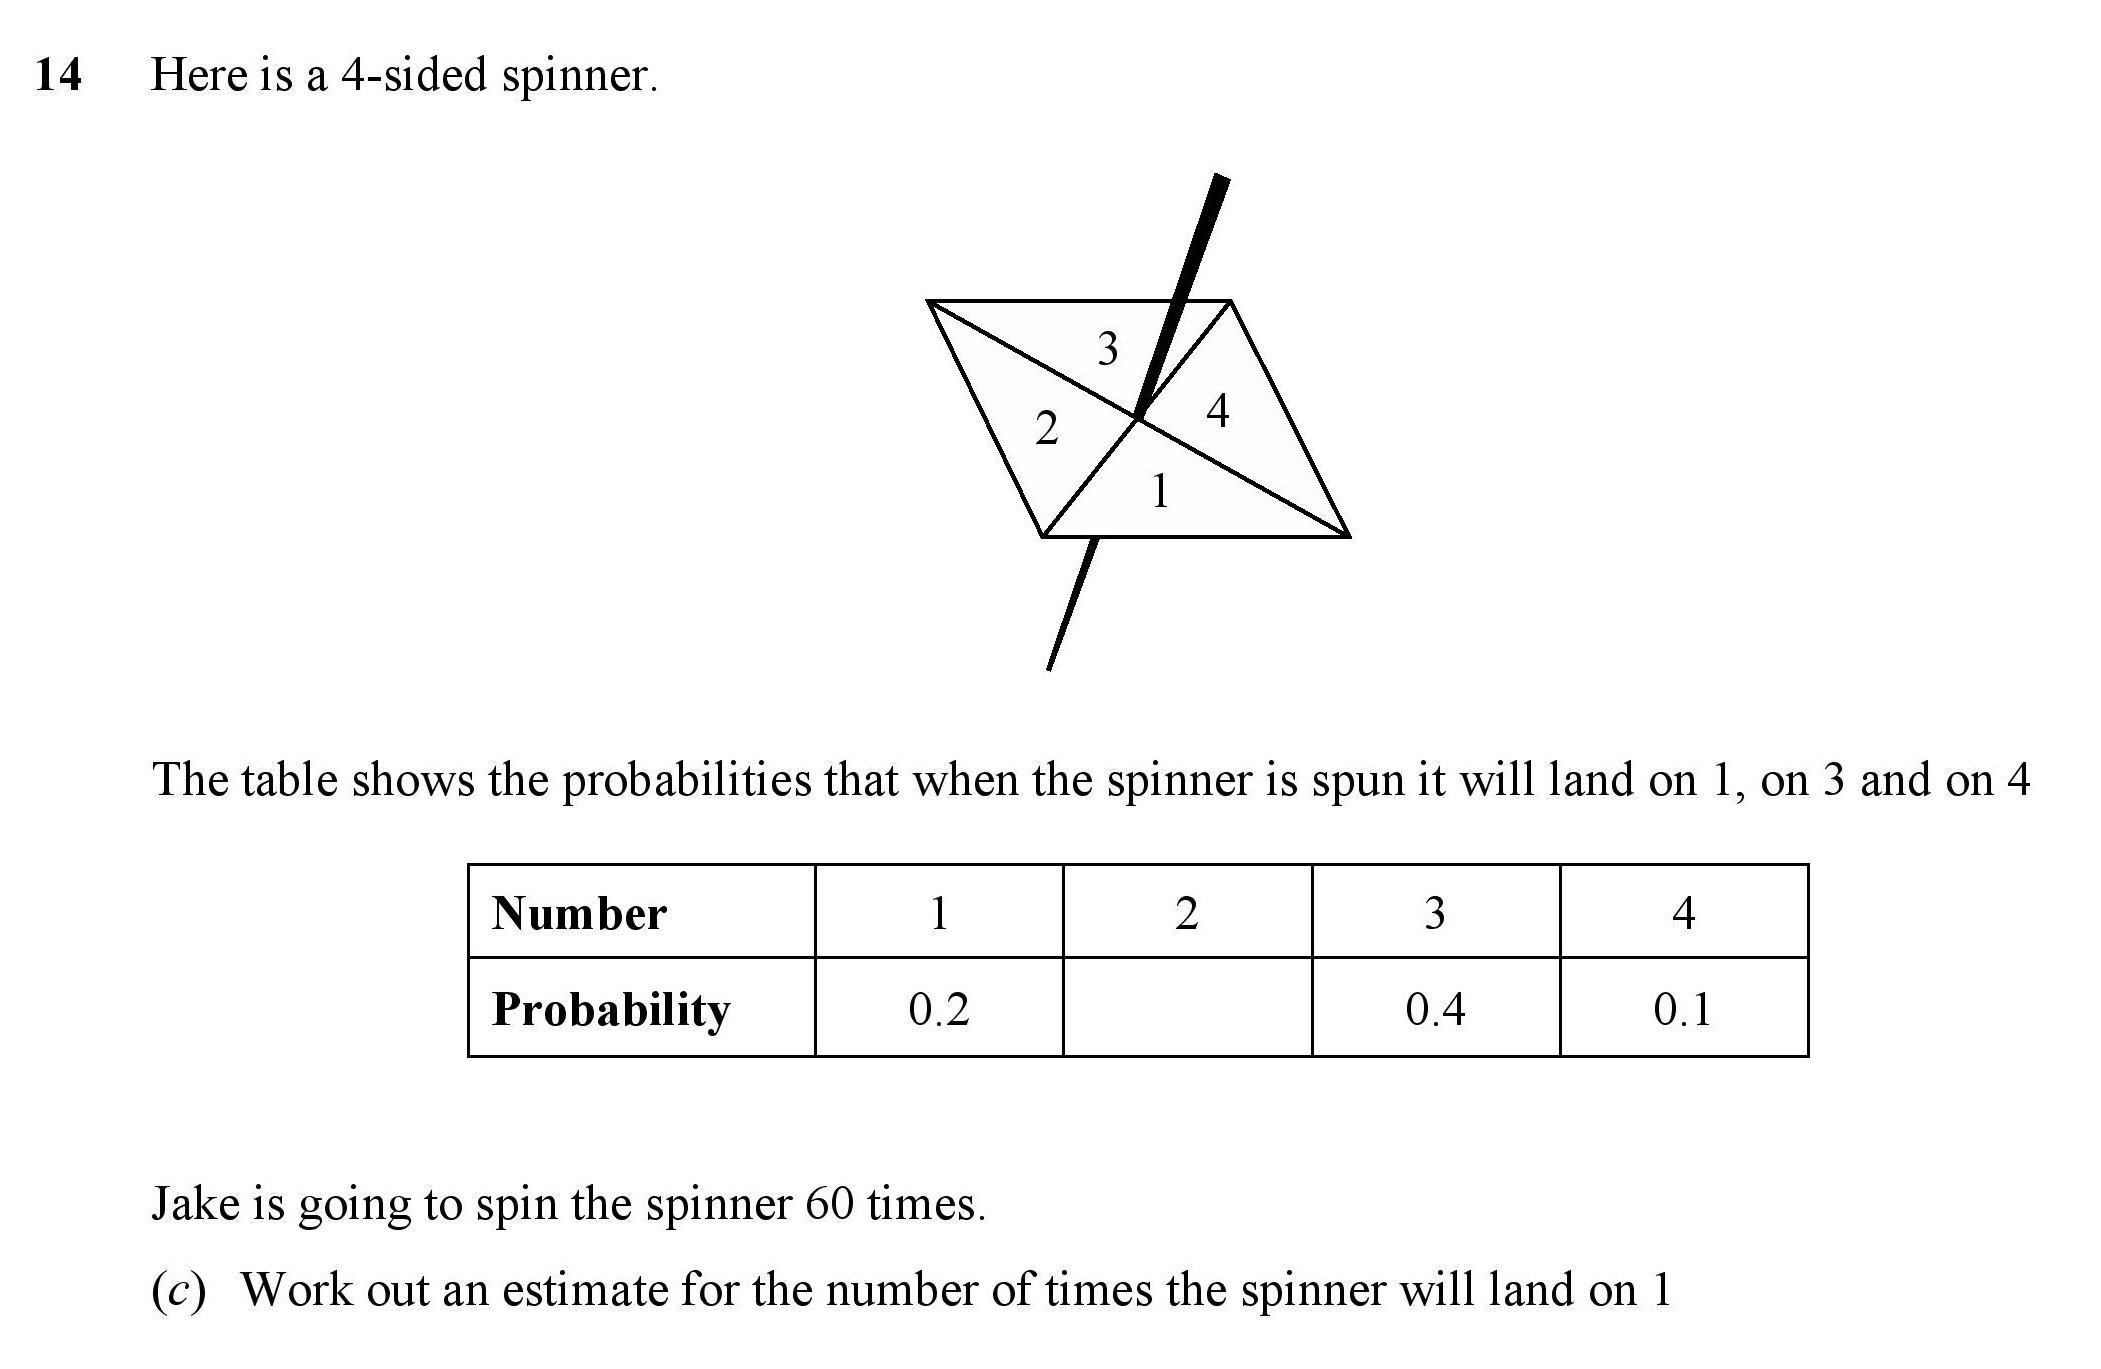
| Probability and Relative Frequency | 1 | 2 | 0.75 | 0.48 | 0.27 | |
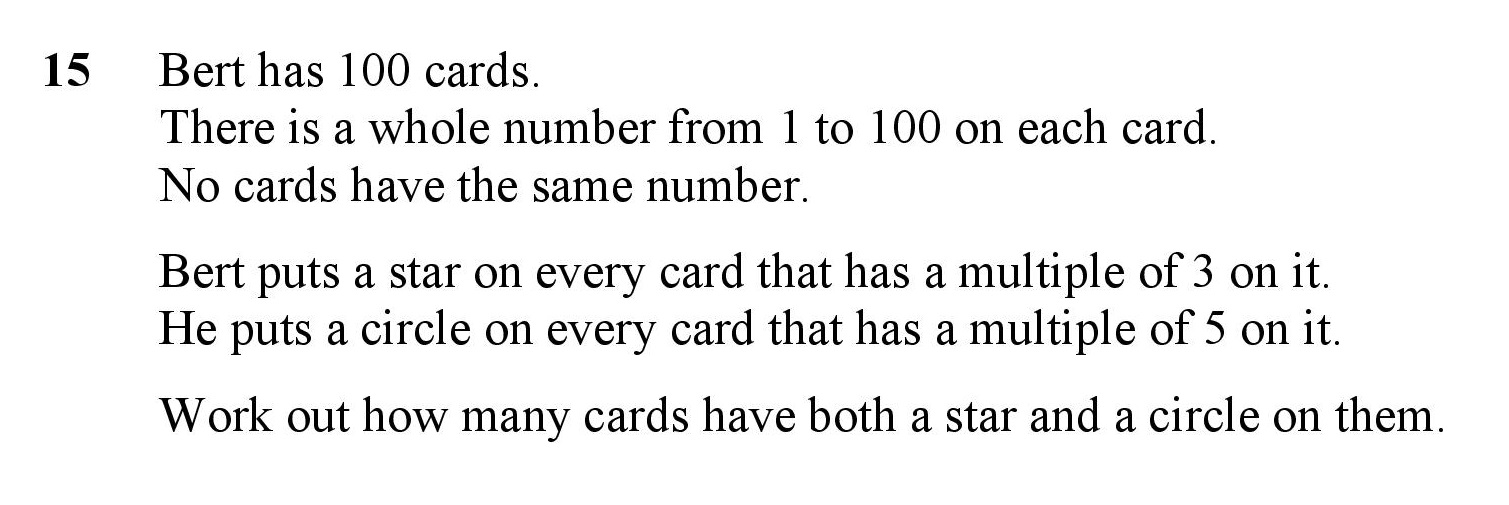
| Common Multiples of numbers 1 to 10 | 3 | 3 | 0.33 | 0.46 | -0.13 | |
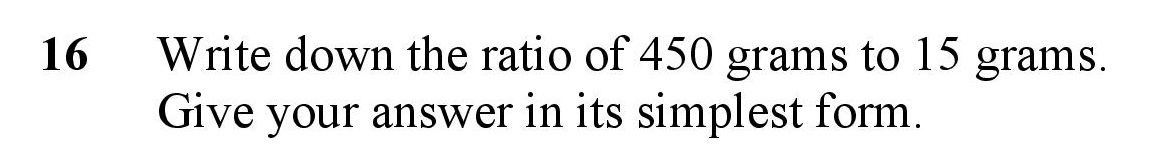
| Equivalent ratios | 1 | 2 | 0.75 | 0.56 | 0.19 | |
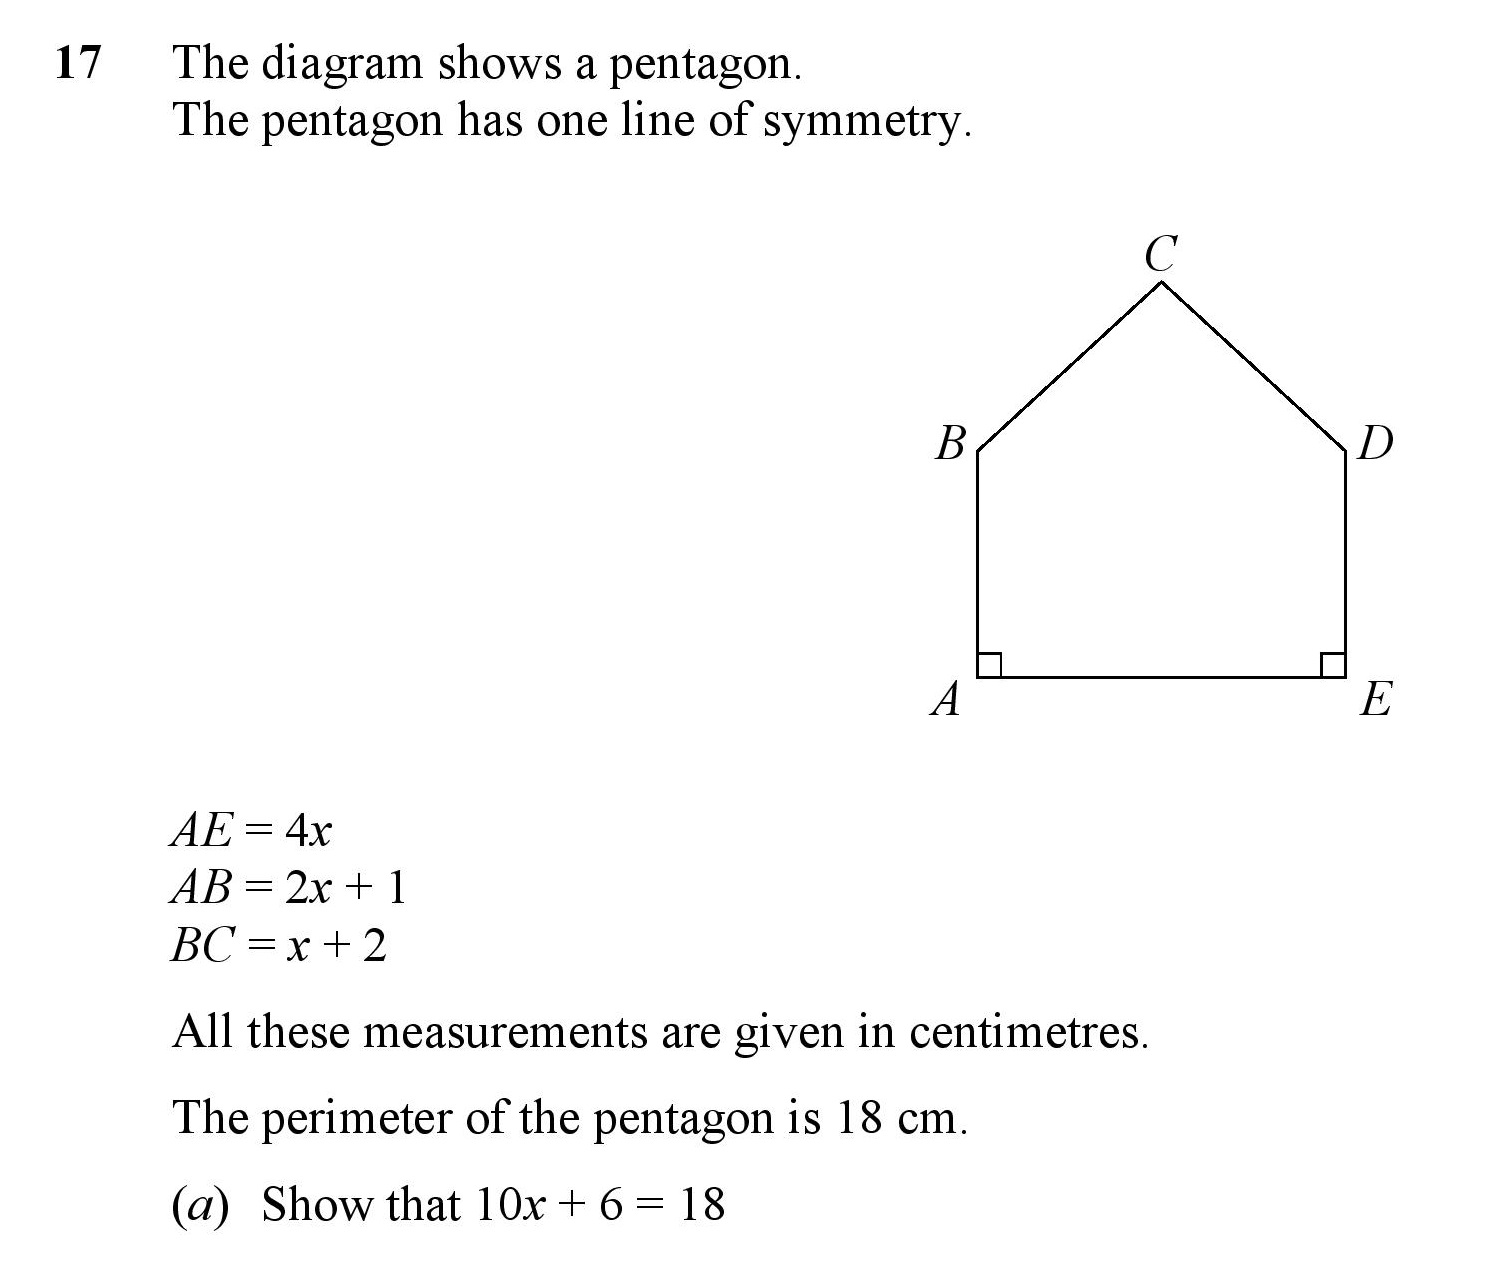
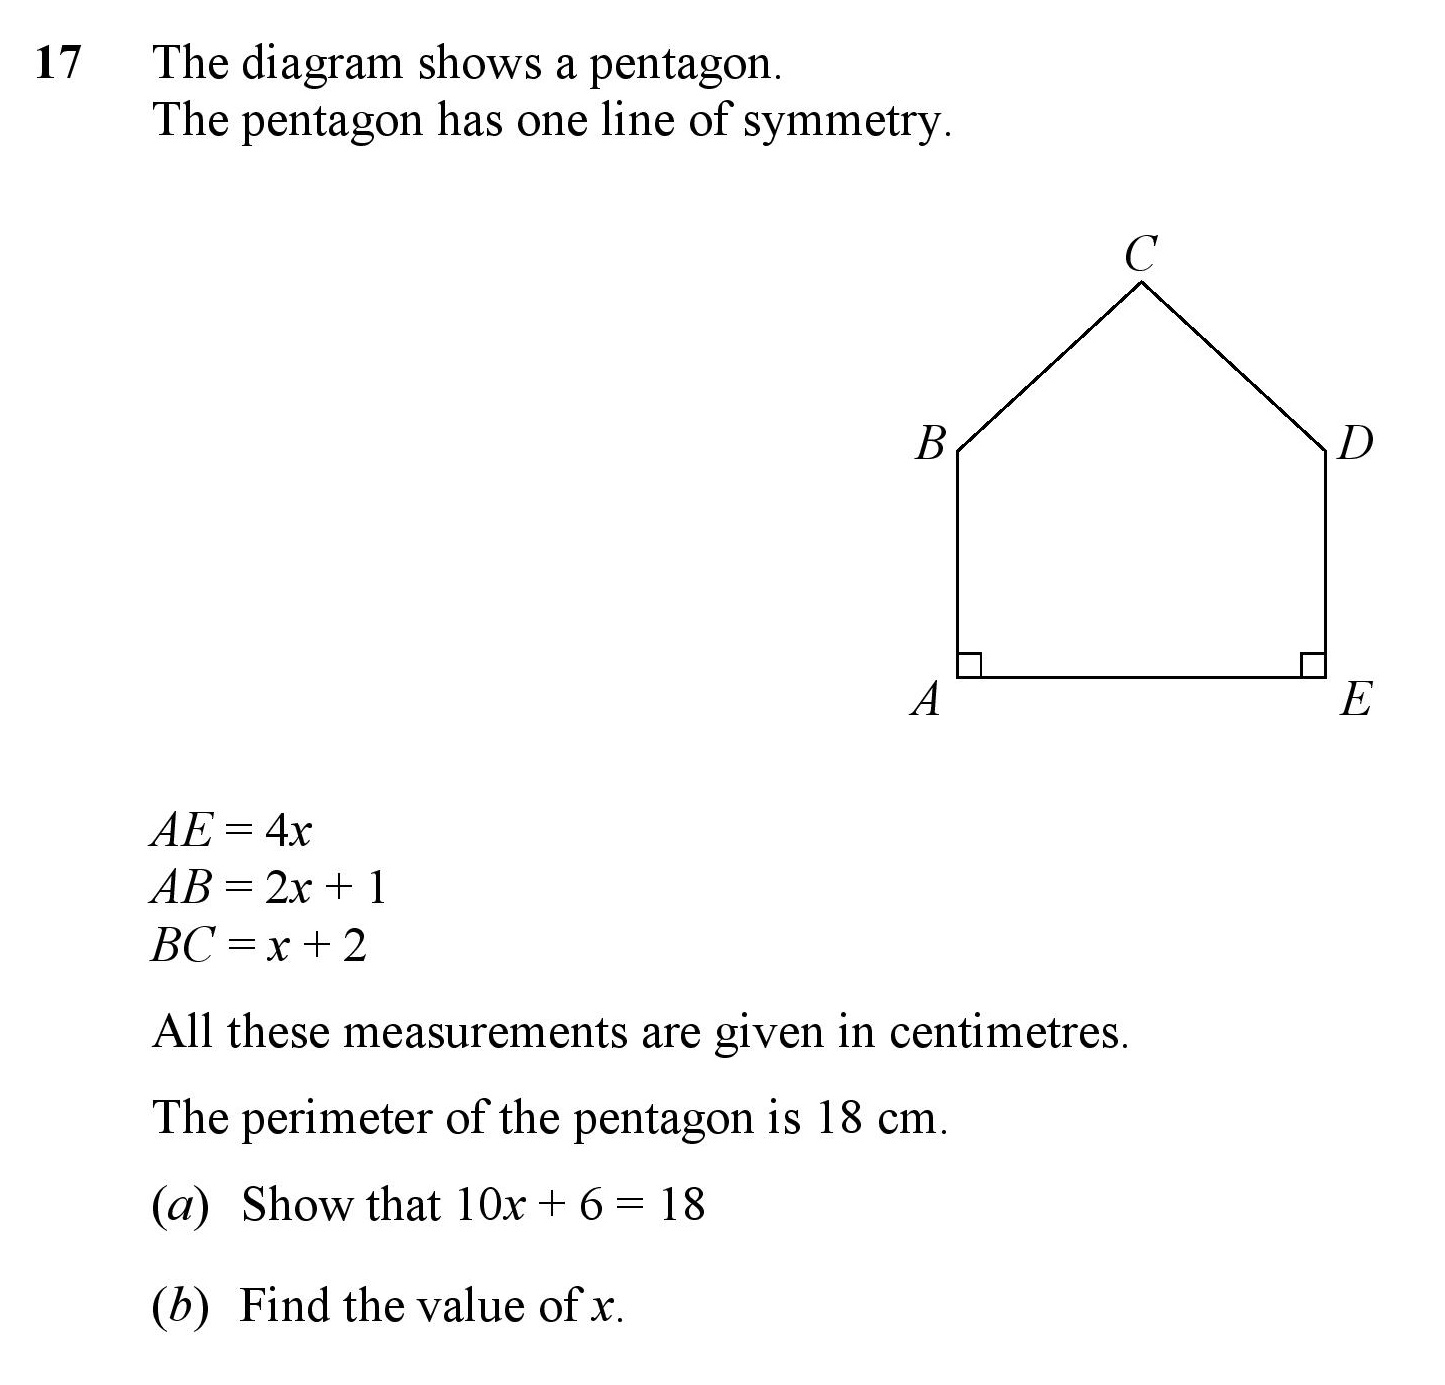
| Expressions and perimeter | 2 | 3 | 0.33 | 0.22 | 0.11 | |
| Simple Forming and Solving Shape Equations | 2 | 2 | 0.75 | 0.47 | 0.28 | |
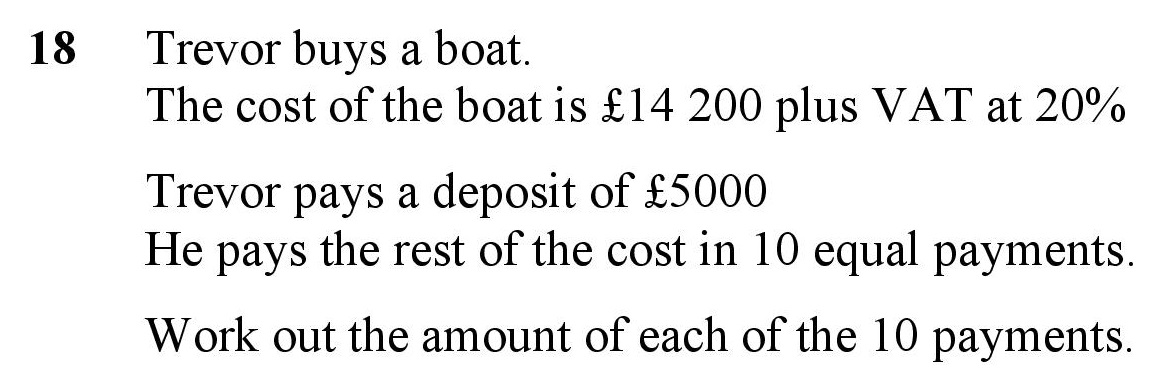
| Monthly Installements and Percentages | 1 | 4 | 0.25 | 0.48 | -0.23 | |
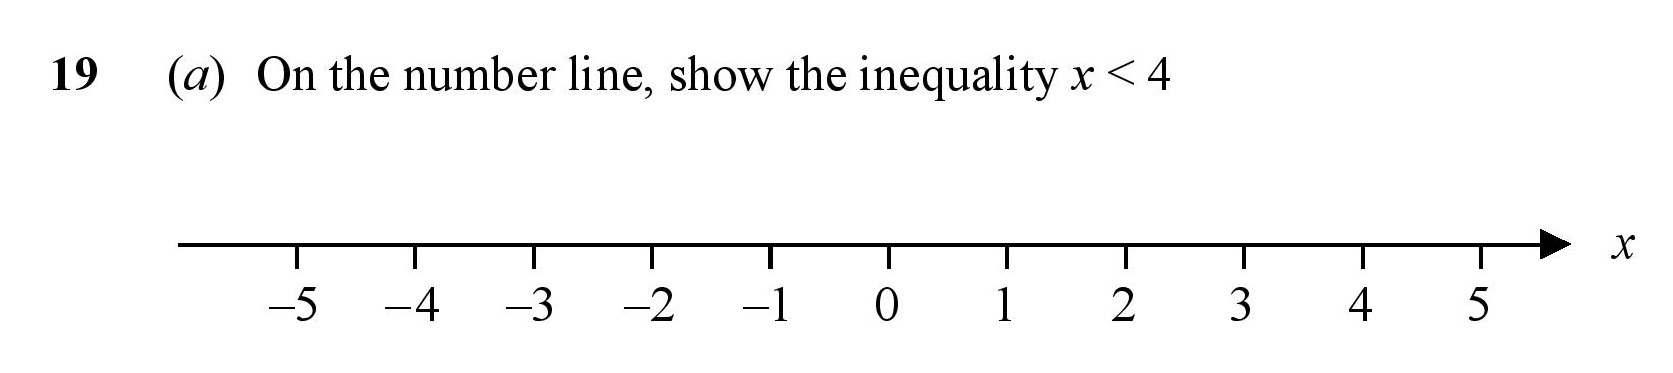
| Inequalities on the number line | 1 | 2 | 0.75 | 0.26 | 0.49 | |
| Inequalities | 1 | 2 | 0.5 | 0.44 | 0.06 | |
| Inequalities with unknown on both sides | 1 | 3 | 0.5 | 0.22 | 0.28 | |
| Significant Figures | 1 | 1 | 1 | 0.31 | 0.69 | |
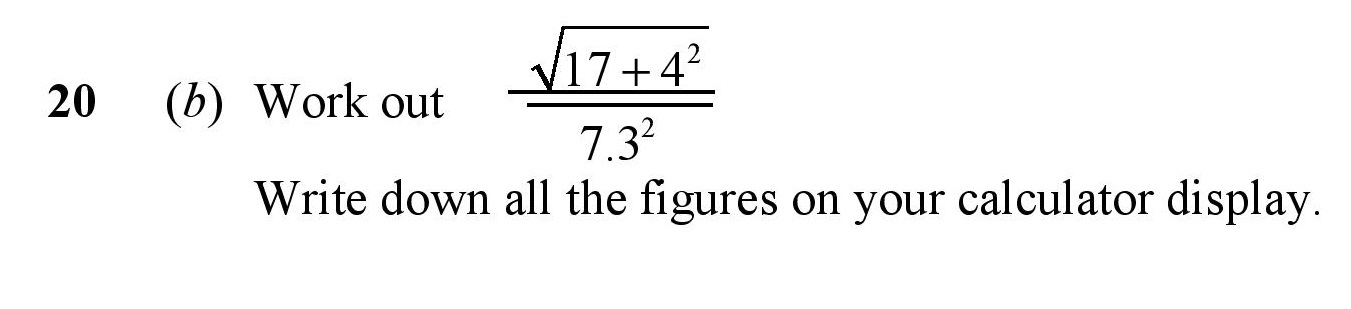
| Using a Calculator | 1 | 2 | 0.75 | 0.55 | 0.2 | |
| Calculating Percentage Increase or Decrease | 1 | 3 | 0.33 | 0.19 | 0.14 | |
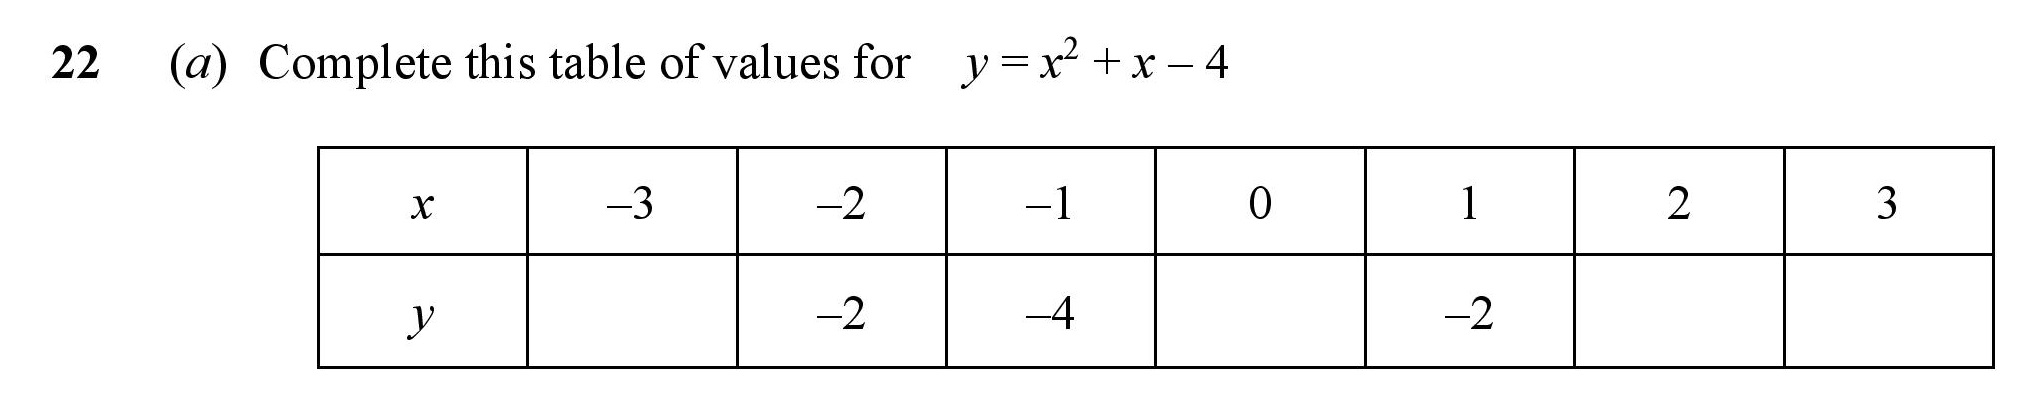
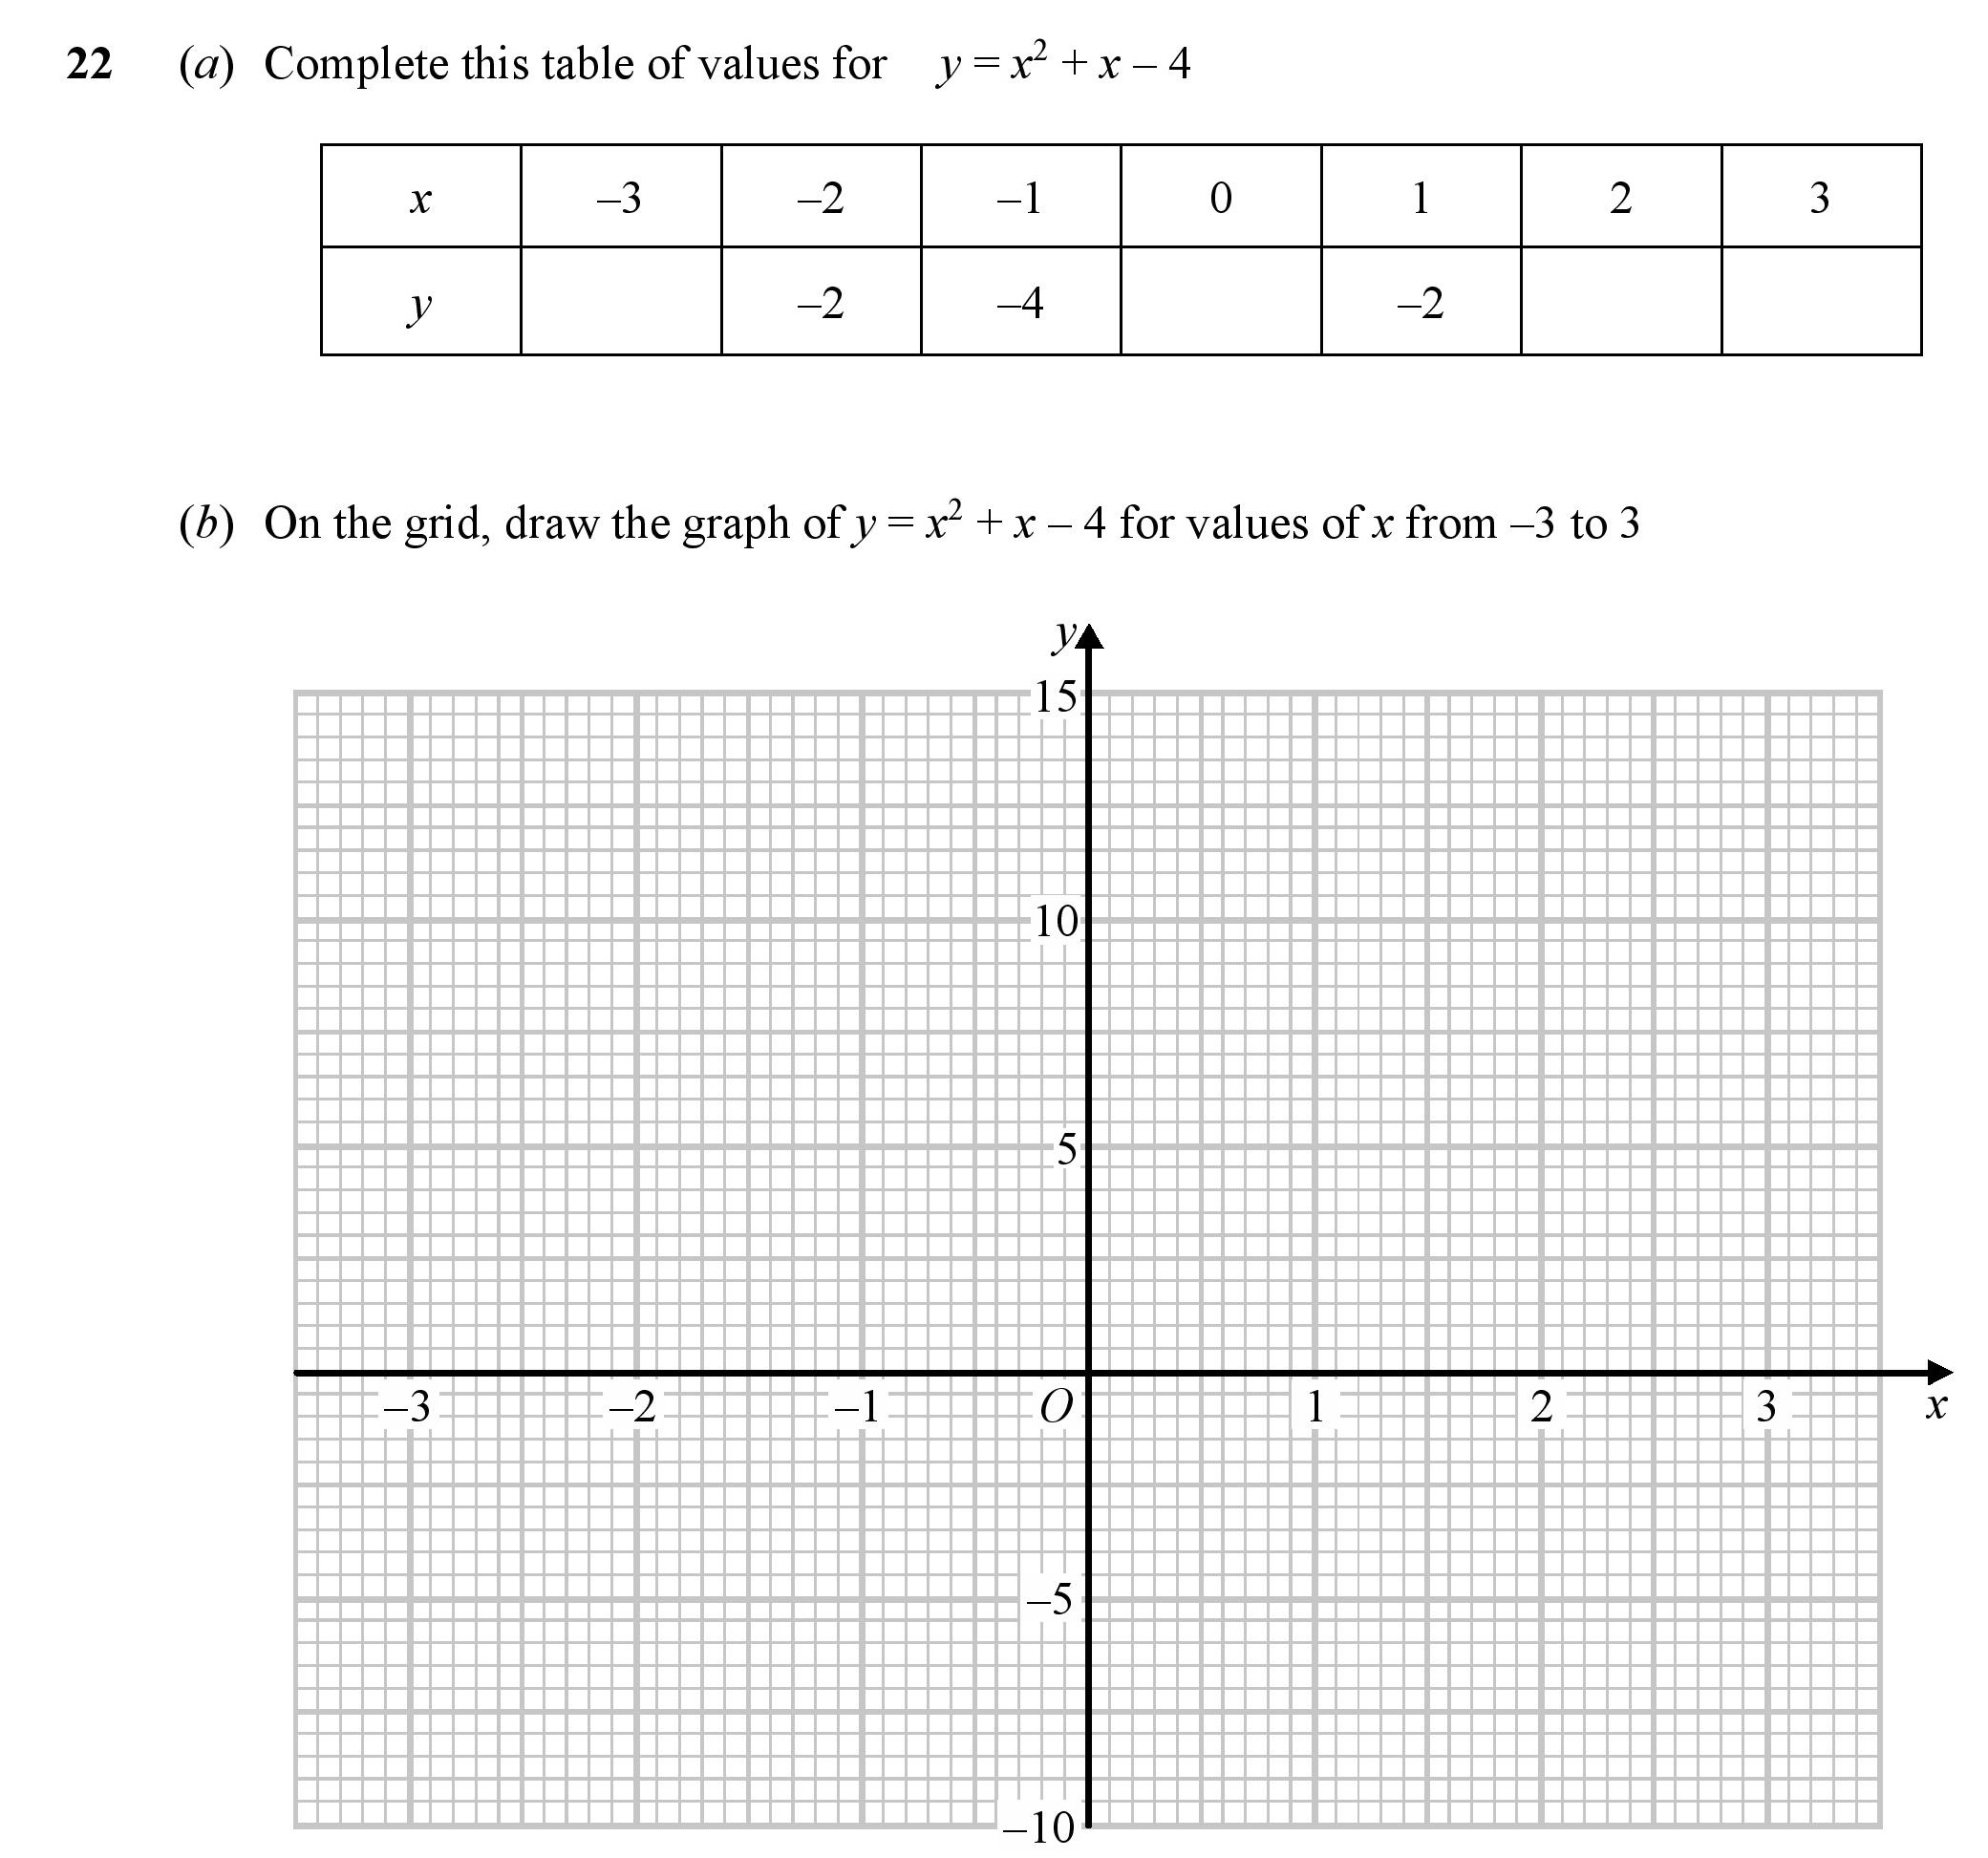
| Table of Values | 1 | 2 | 0.75 | 0.34 | 0.41 | |
| Drawing Quadratic Graphs | 1 | 2 | 0.5 | 0.27 | 0.23 | |
| Estimating Roots from Quadratic Graphs | 2 | 1 | 1.5 | 0.06 | 1.44 | |
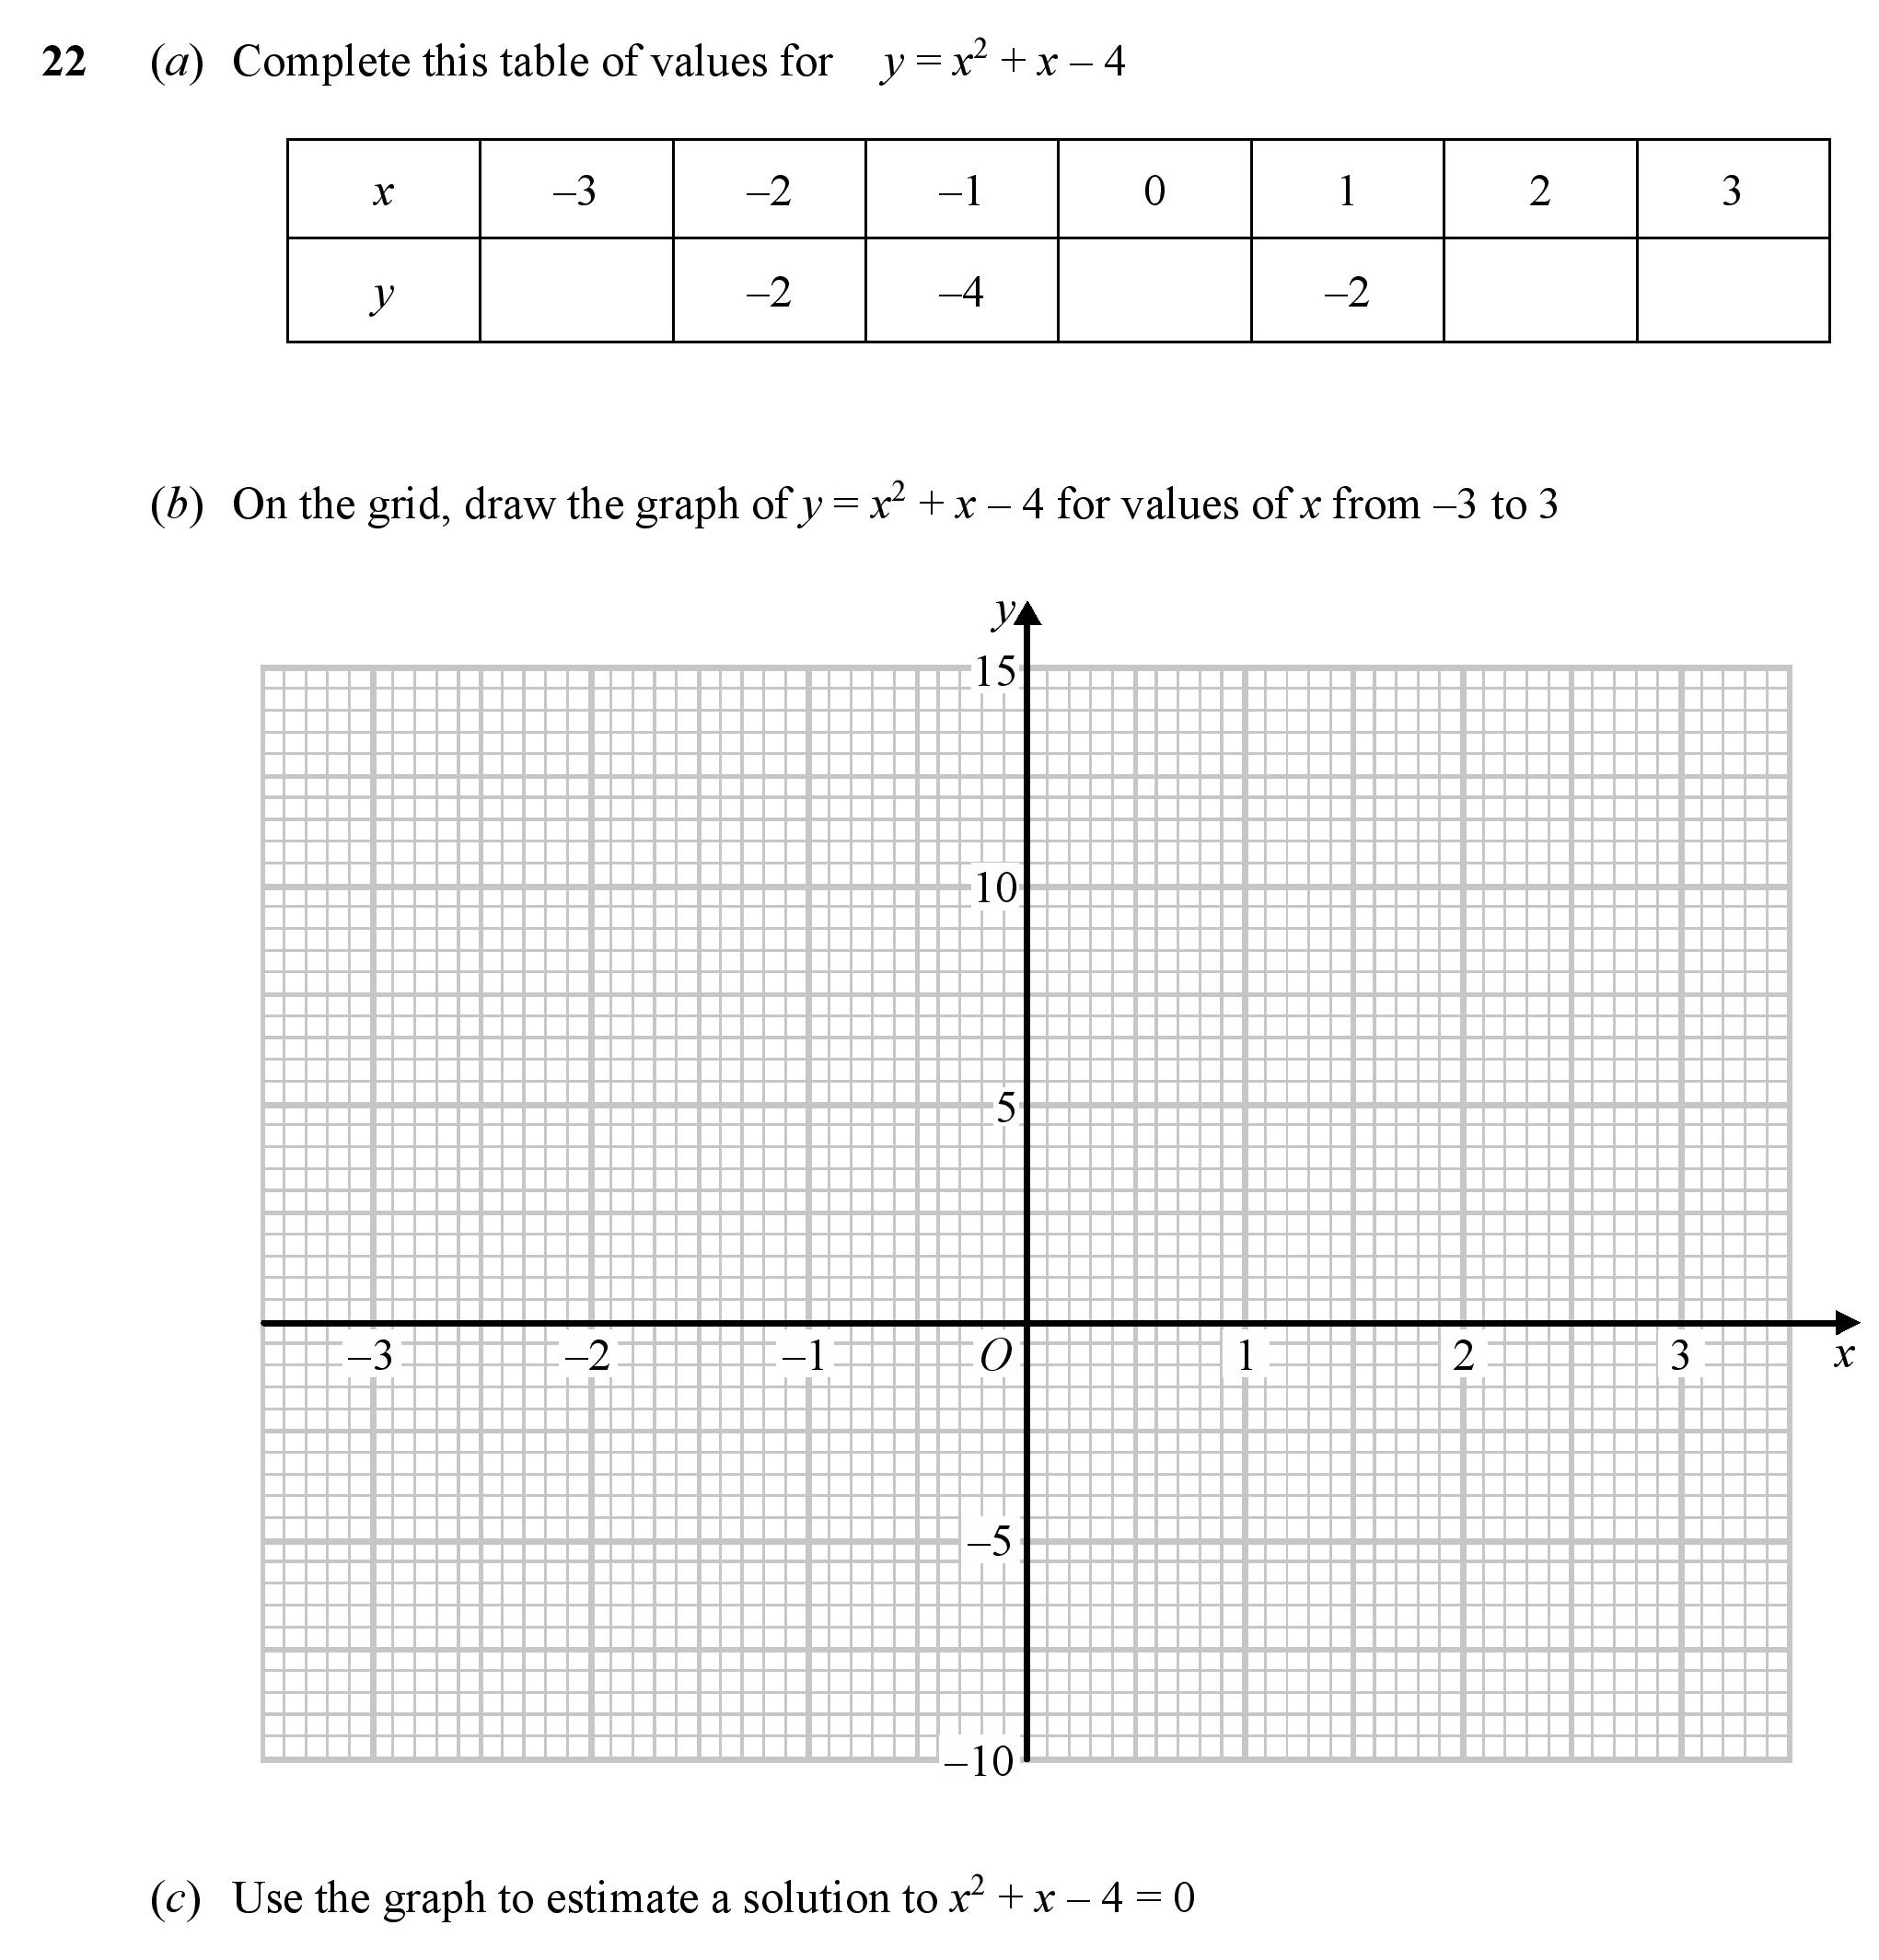
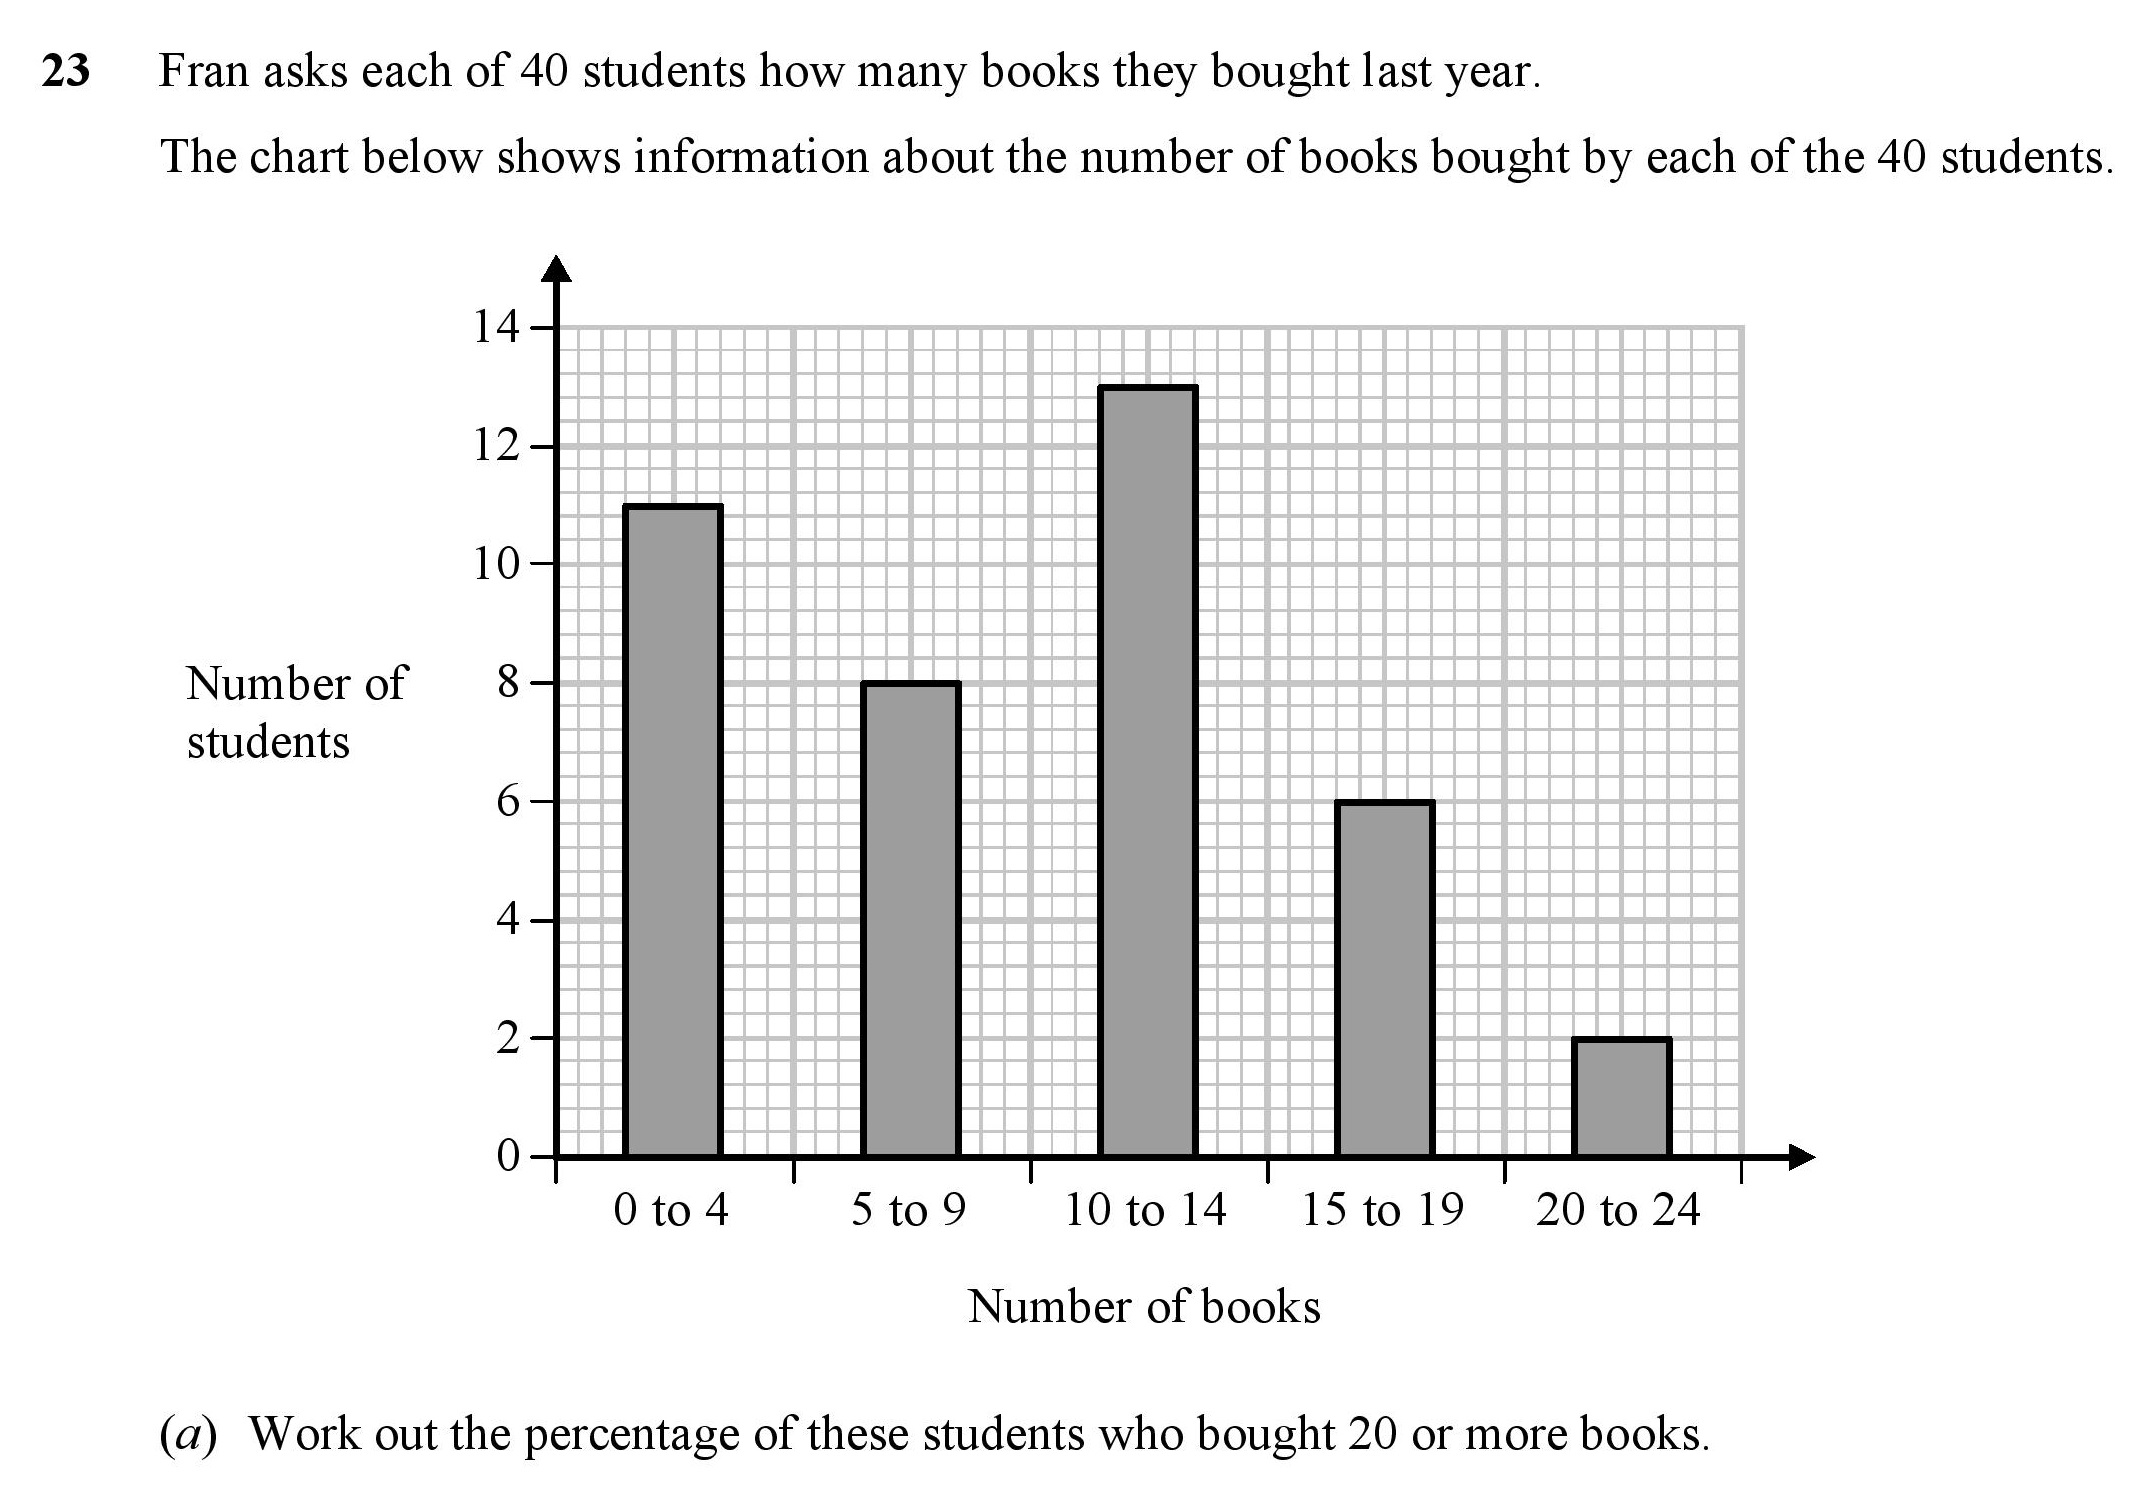
| Percentage from a Bar Chart | 1 | 2 | 0.5 | 0.34 | 0.16 | |
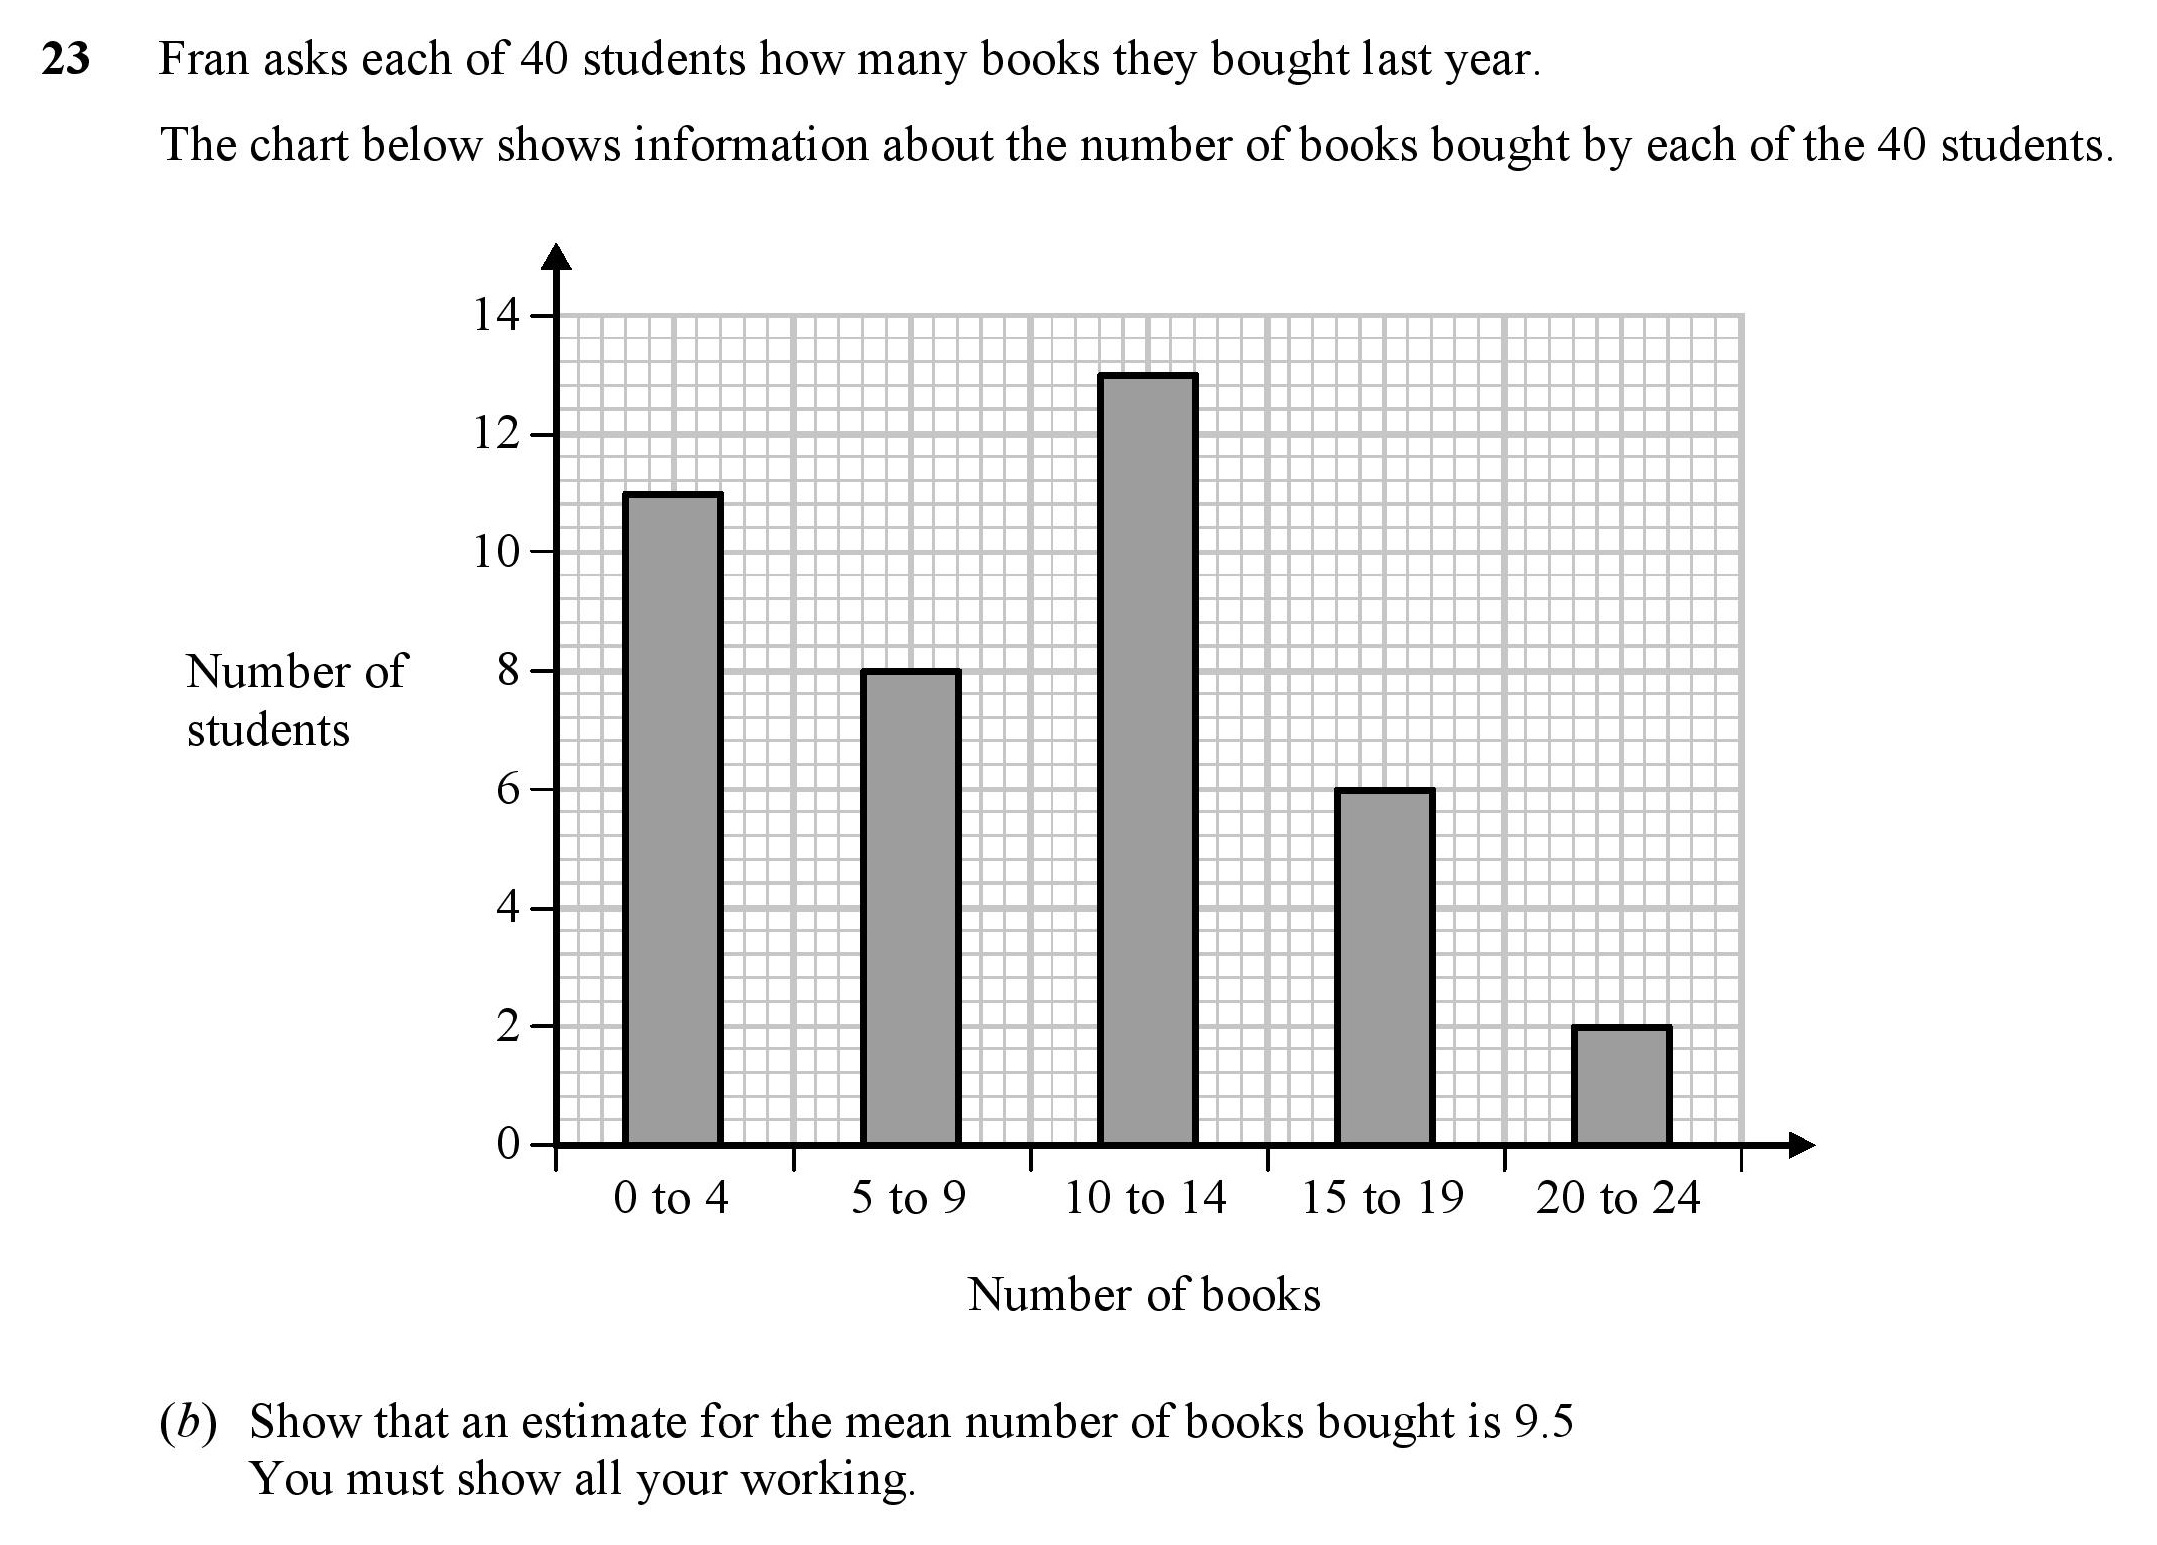
| Mean form Grouped Bar Chart | 2 | 4 | 0.38 | 0.09 | 0.29 | |
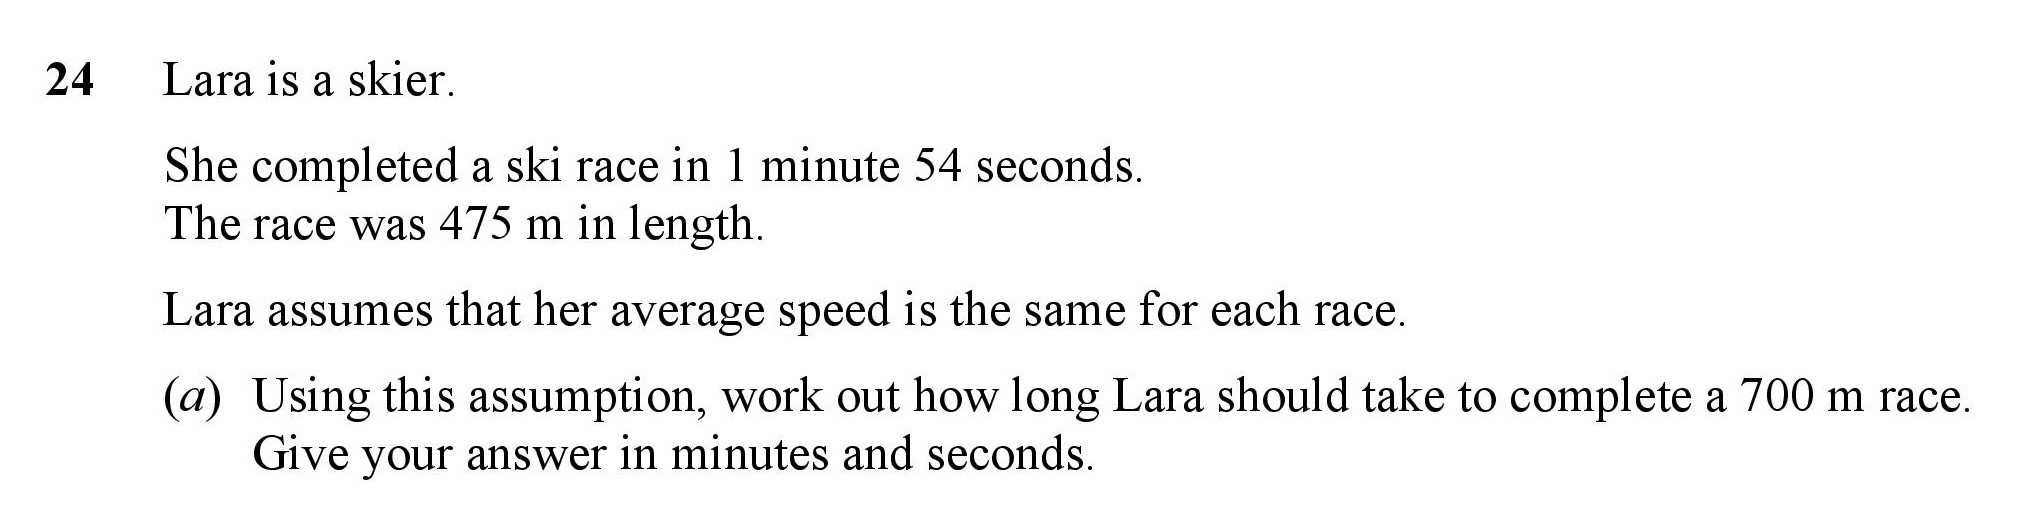
| Speed Problems | 3 | 3 | 0.33 | 0.17 | 0.16 | |
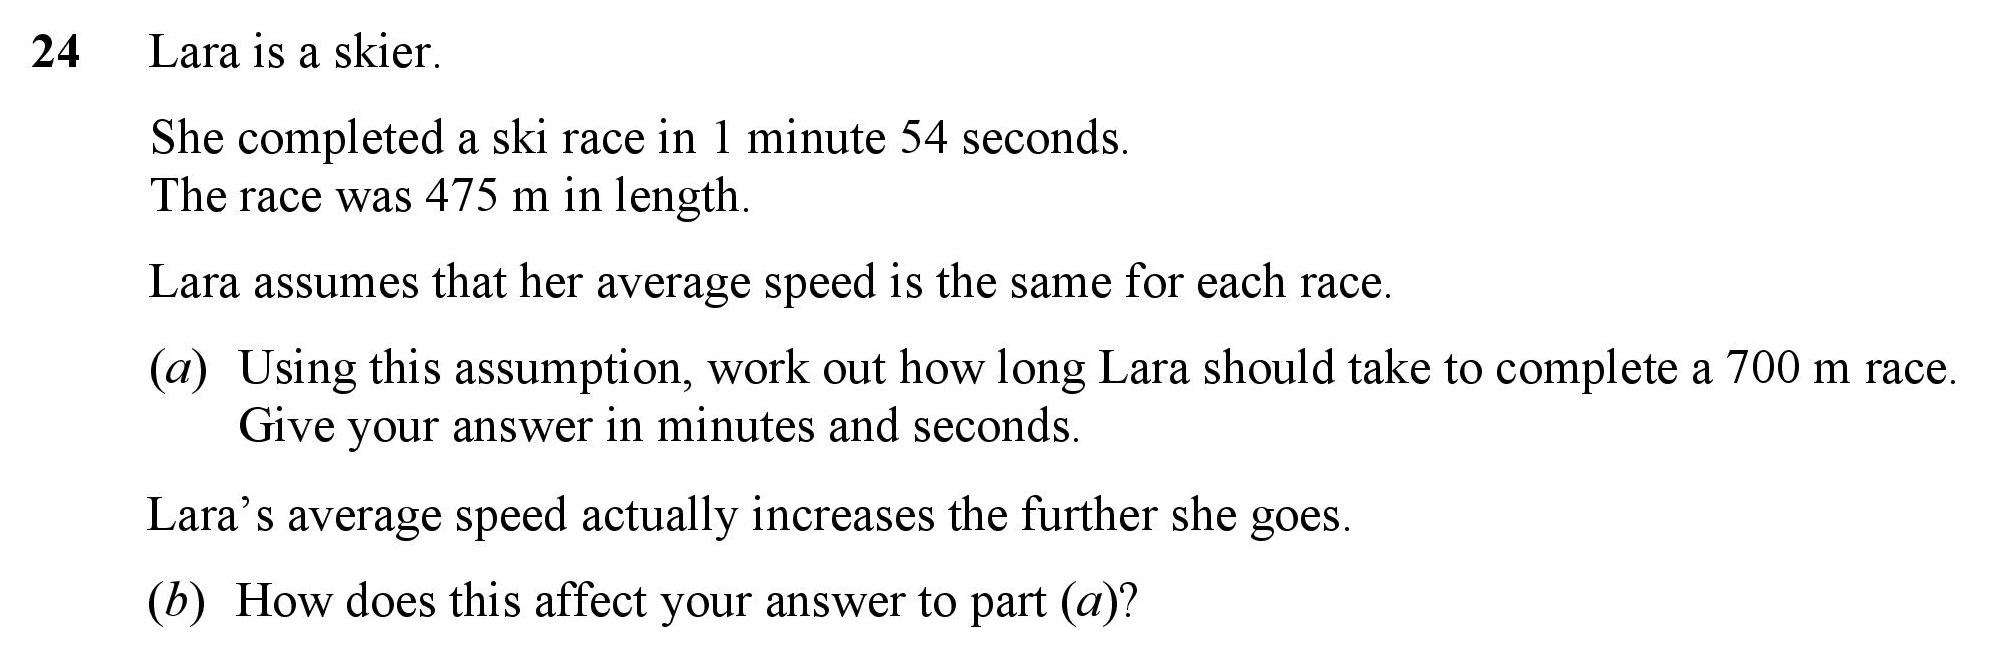
| Speed Assumptions | 2 | 1 | 1.5 | 0.32 | 1.18 | |
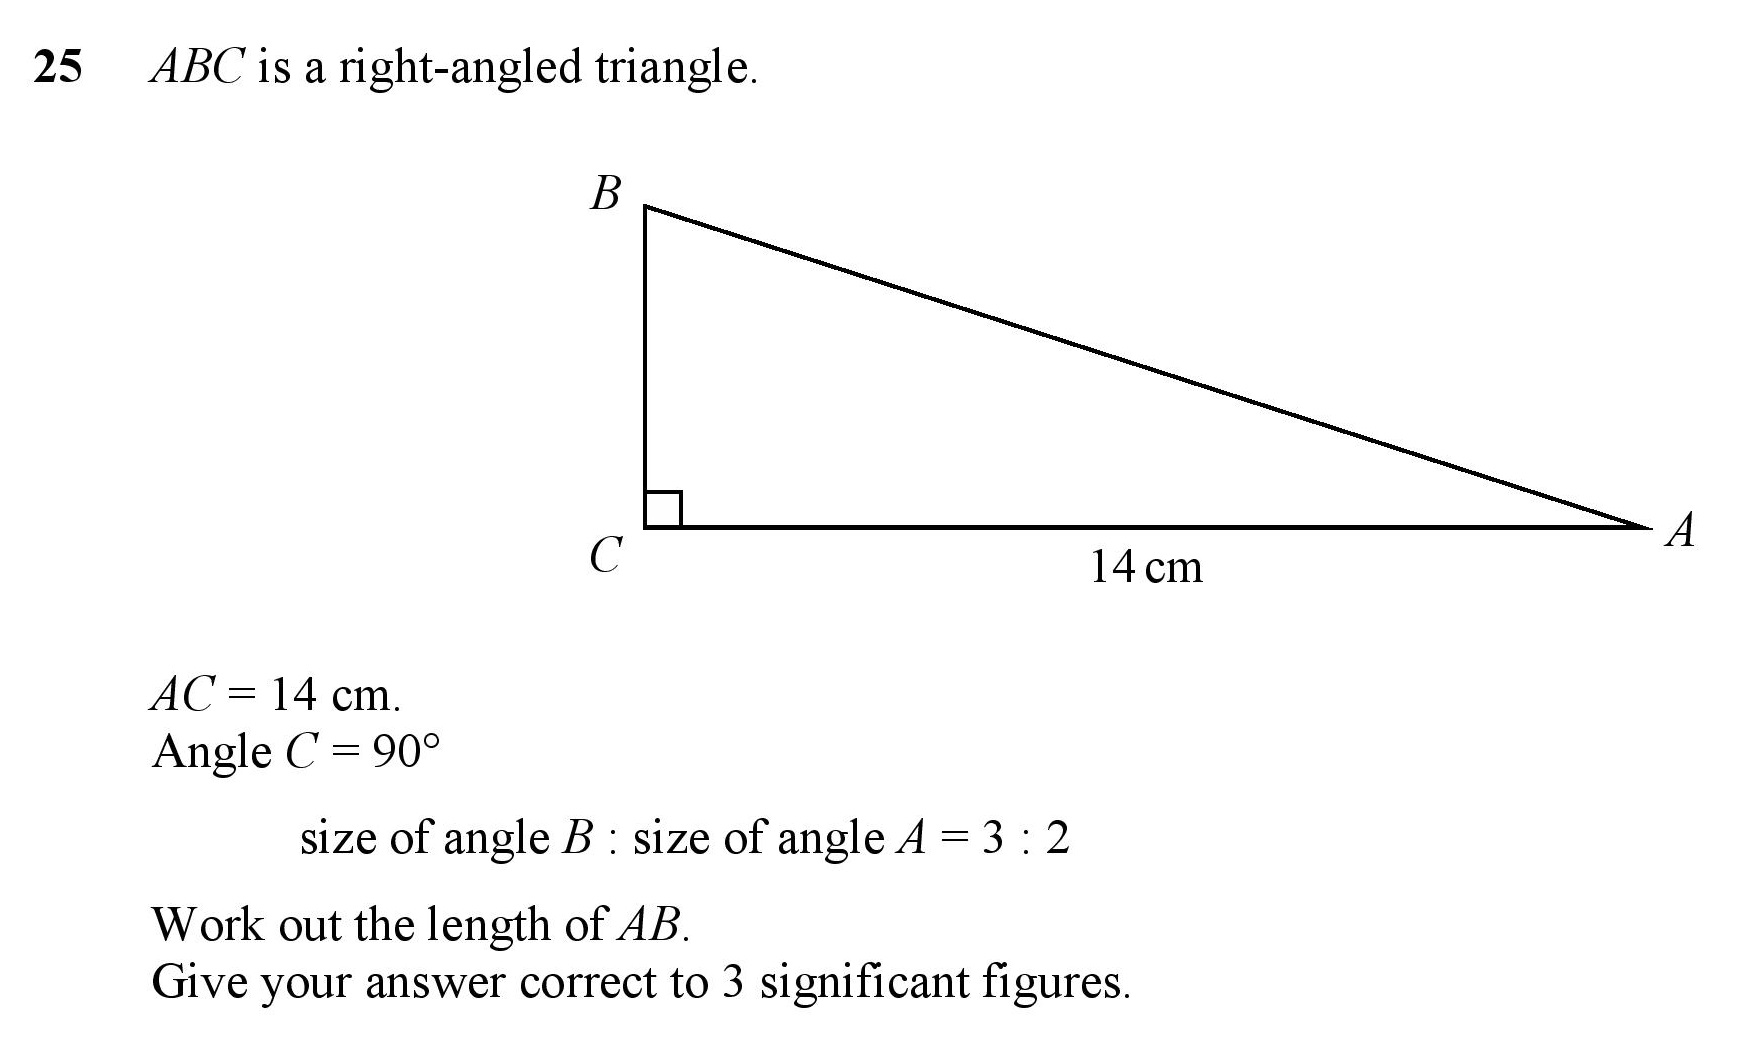
| Ratio and Trigonometry | 3 | 4 | 0.25 | 0.06 | 0.19 | |
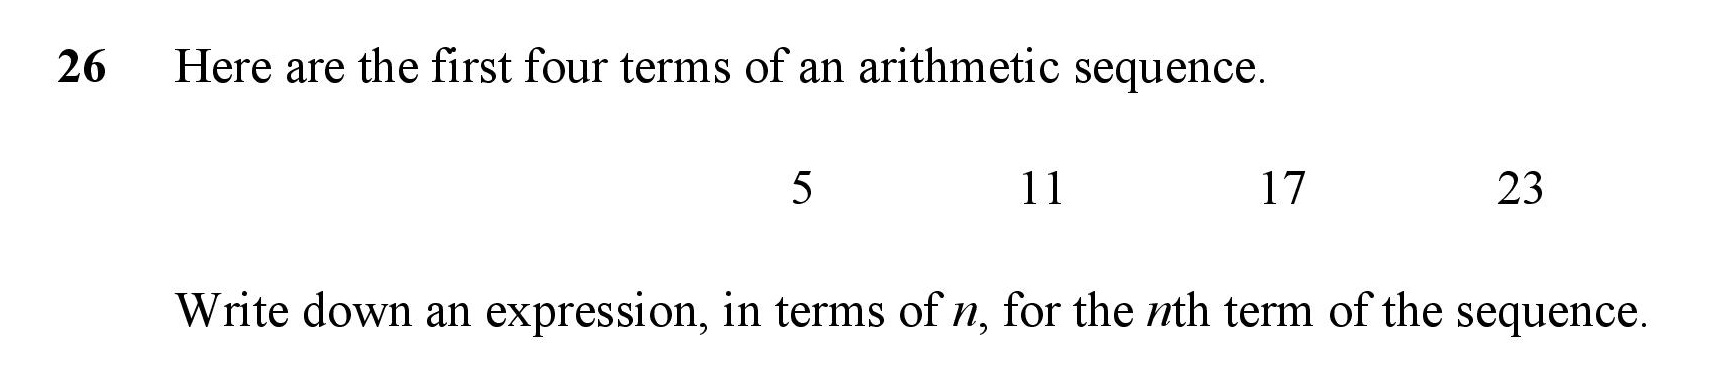
| Sequences | 1 | 2 | 0.75 | 0.36 | 0.39 |