Einstein QLA: Its all relative!
Average marks for your class or department are compared to all the other pinpoint schools
who have uploaded for this test.
Average marks for your class or department are compared to all the other pinpoint schools
who have uploaded for this test.
| Question | Topic | AO Strand | Max Mark | SetA Average per mark | Pinpoint Average | Average Difference |
|---|---|---|---|---|---|---|
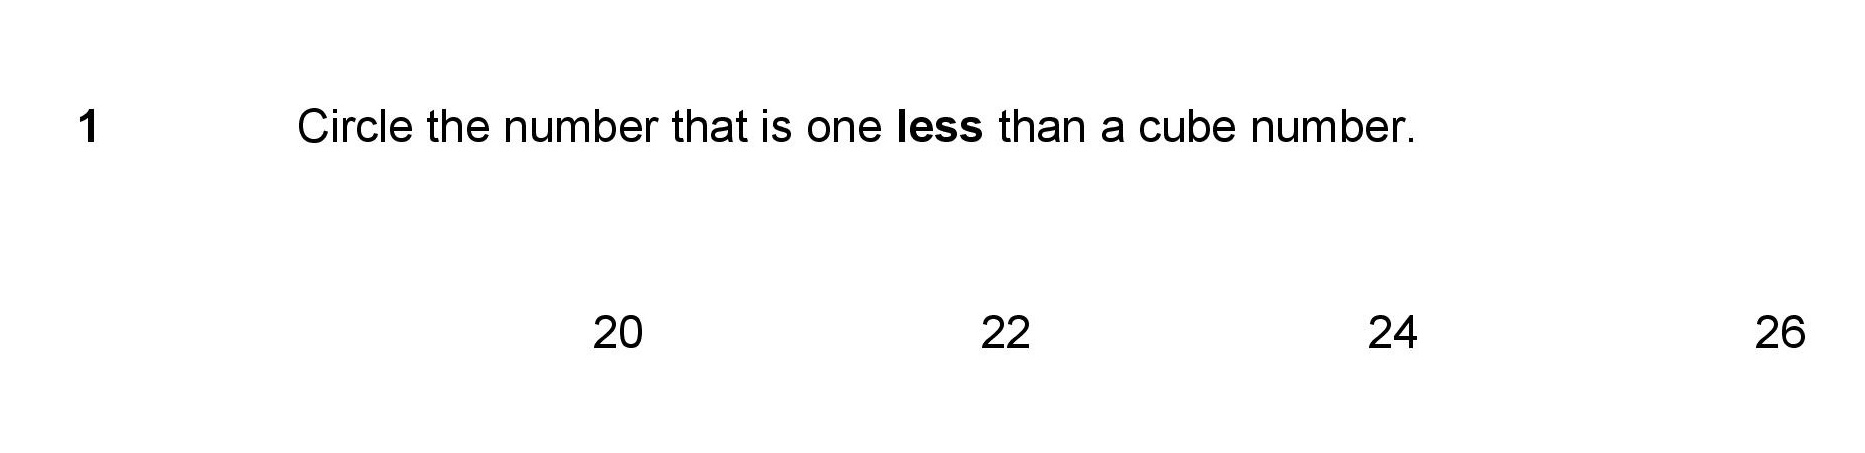
| Multiples, Squares, Primes, Factors and Cubes | 1 | 1 | 1 | 0.54 | 0.46 | |
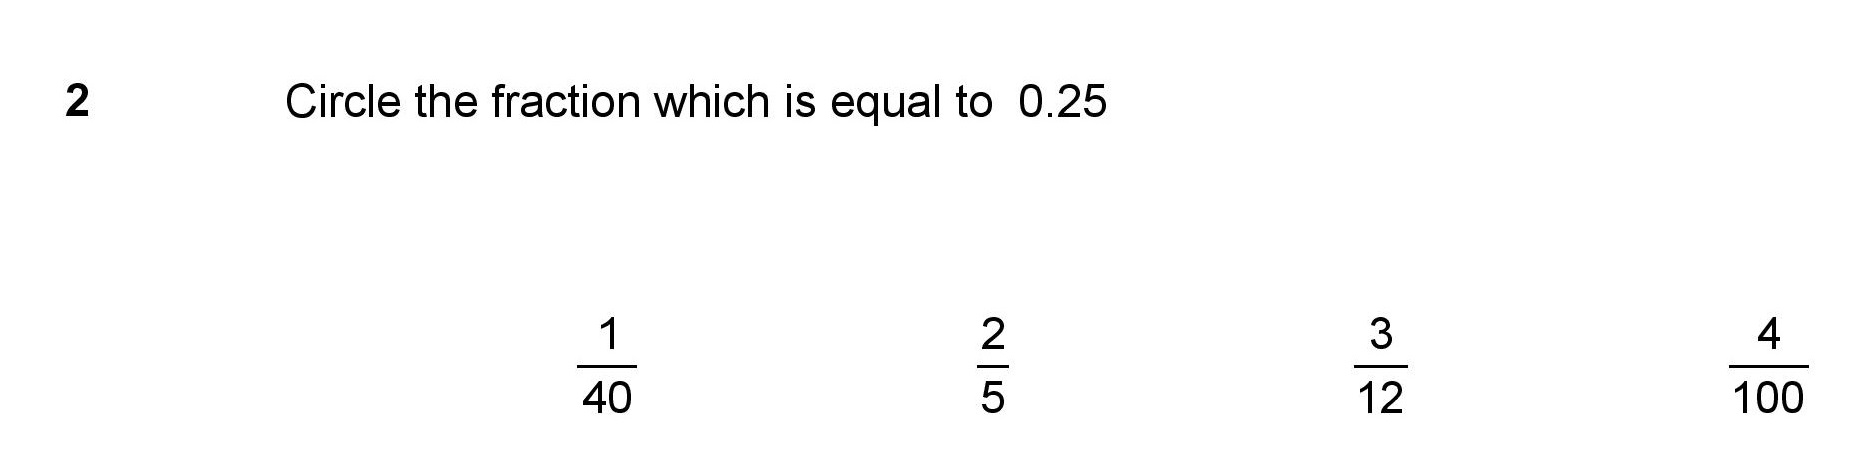
| Fractions and Decimals | 1 | 1 | 0.5 | 0.66 | -0.16 | |
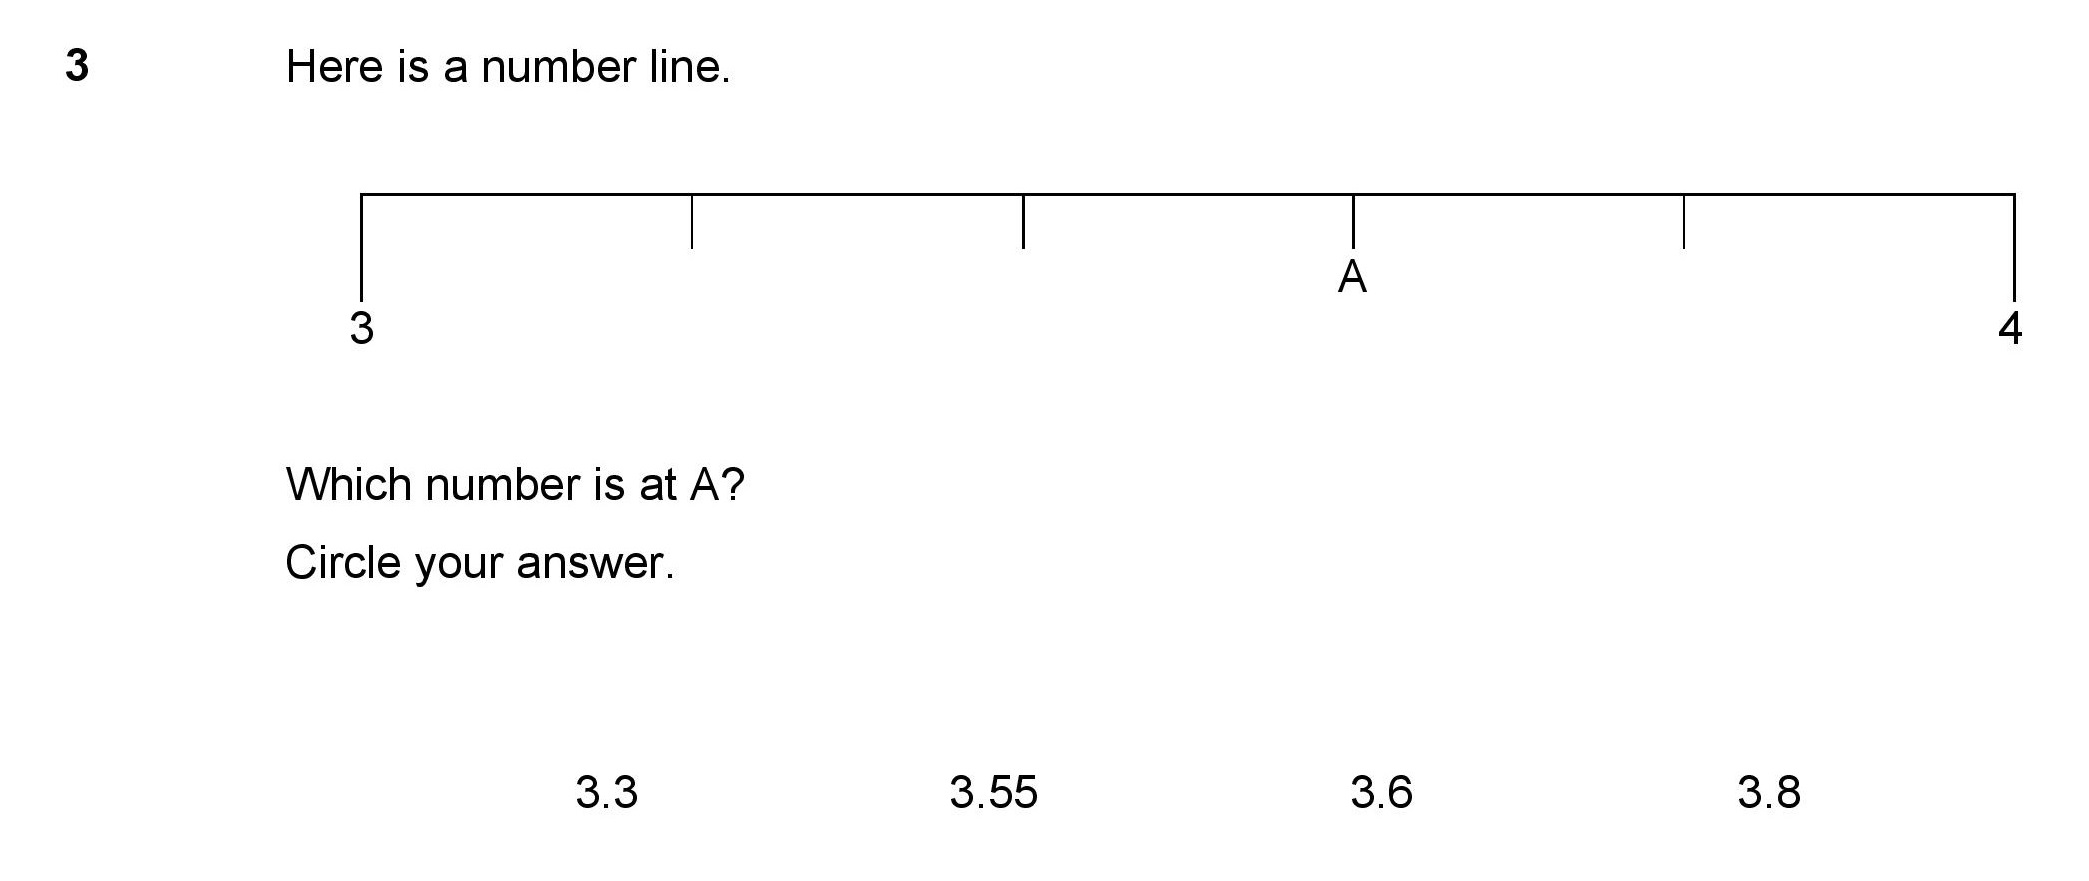
| Reading Scales | 1 | 1 | 1 | 0.82 | 0.18 | |
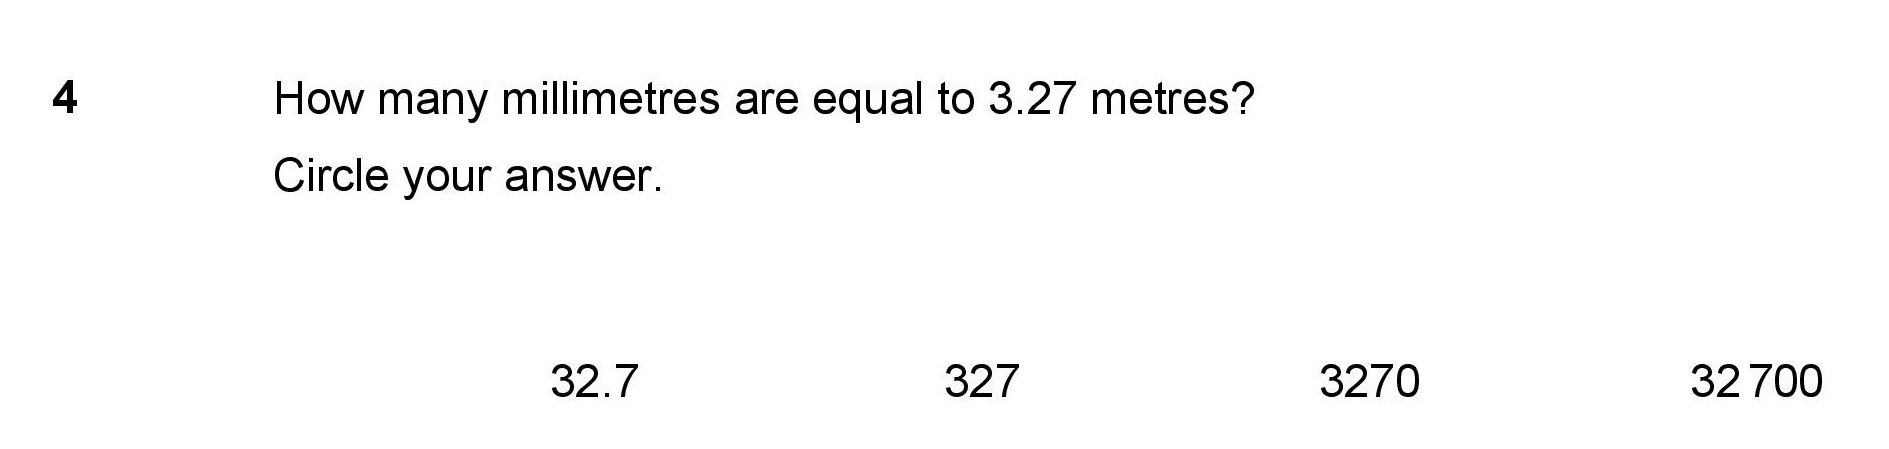
| Metric Conversions | 1 | 1 | 0.5 | 0.6 | -0.1 | |
| Units of Time | 1 | 3 | 0.33 | 0.56 | -0.23 | |
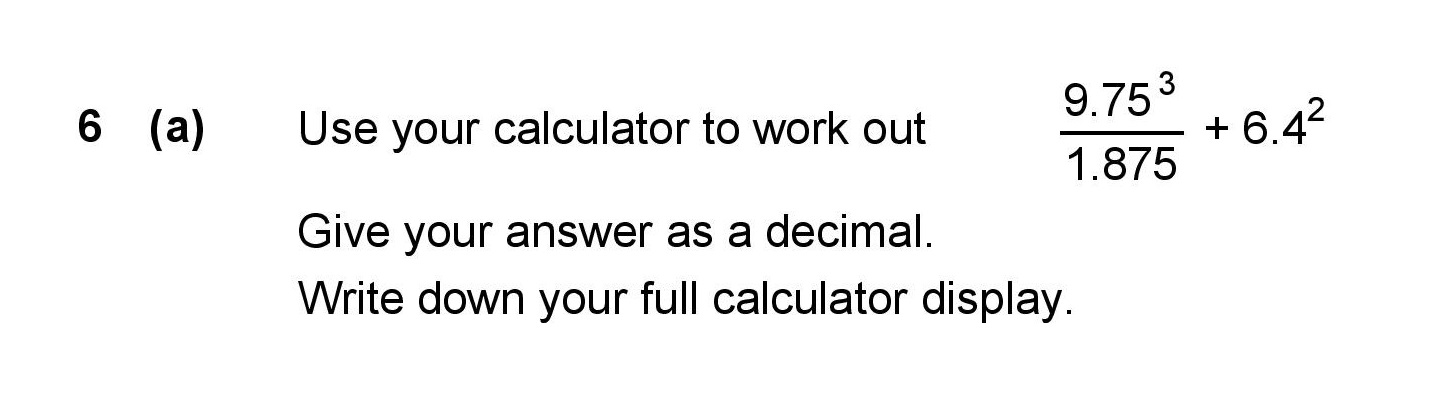
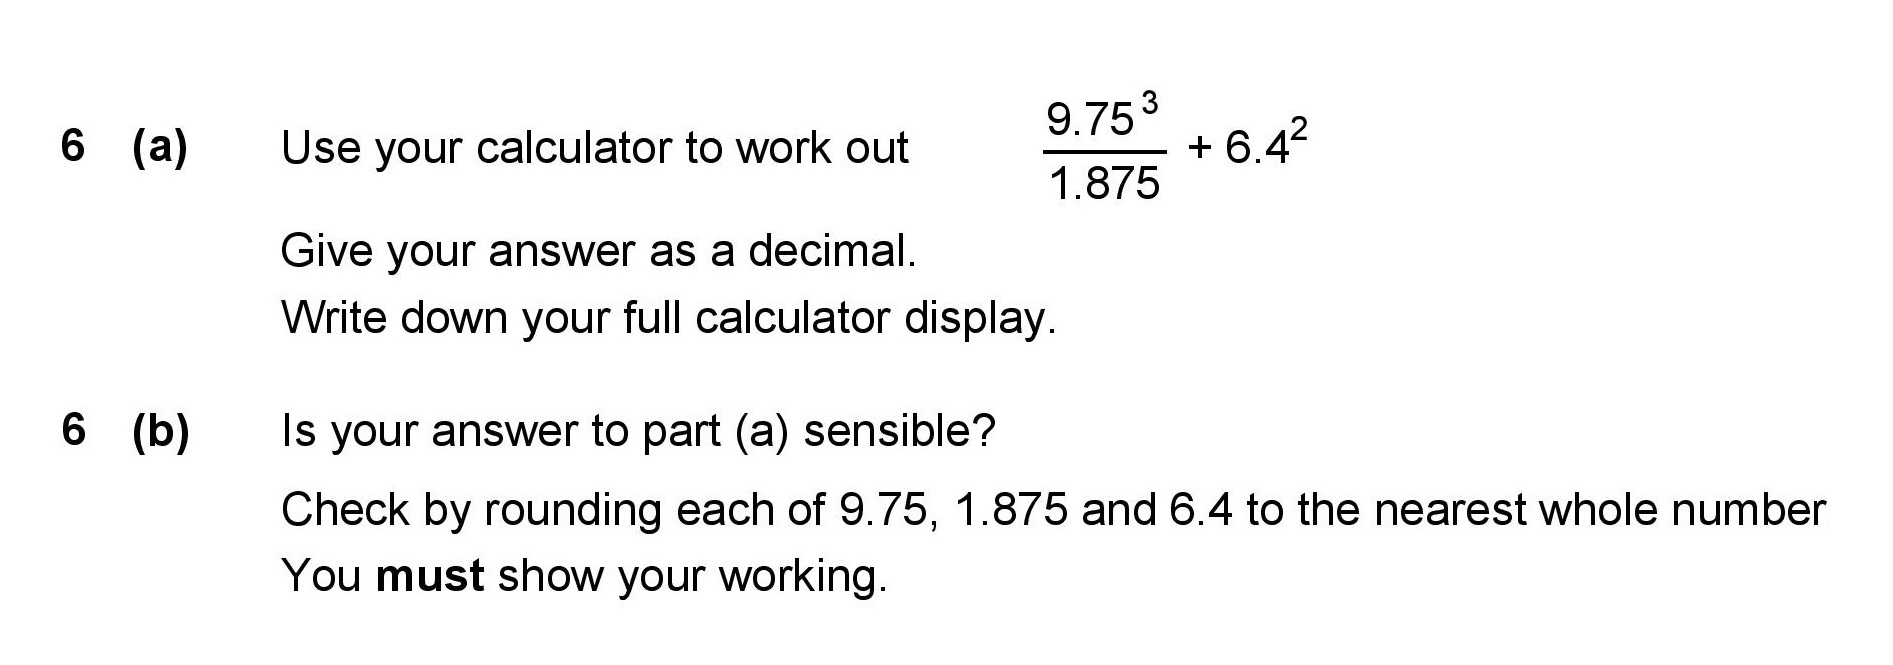
| Using a Calculator | 1 | 2 | 0.5 | 0.77 | -0.27 | |
| Estimation and Reasoning | 2 | 3 | 0.5 | 0.46 | 0.04 | |
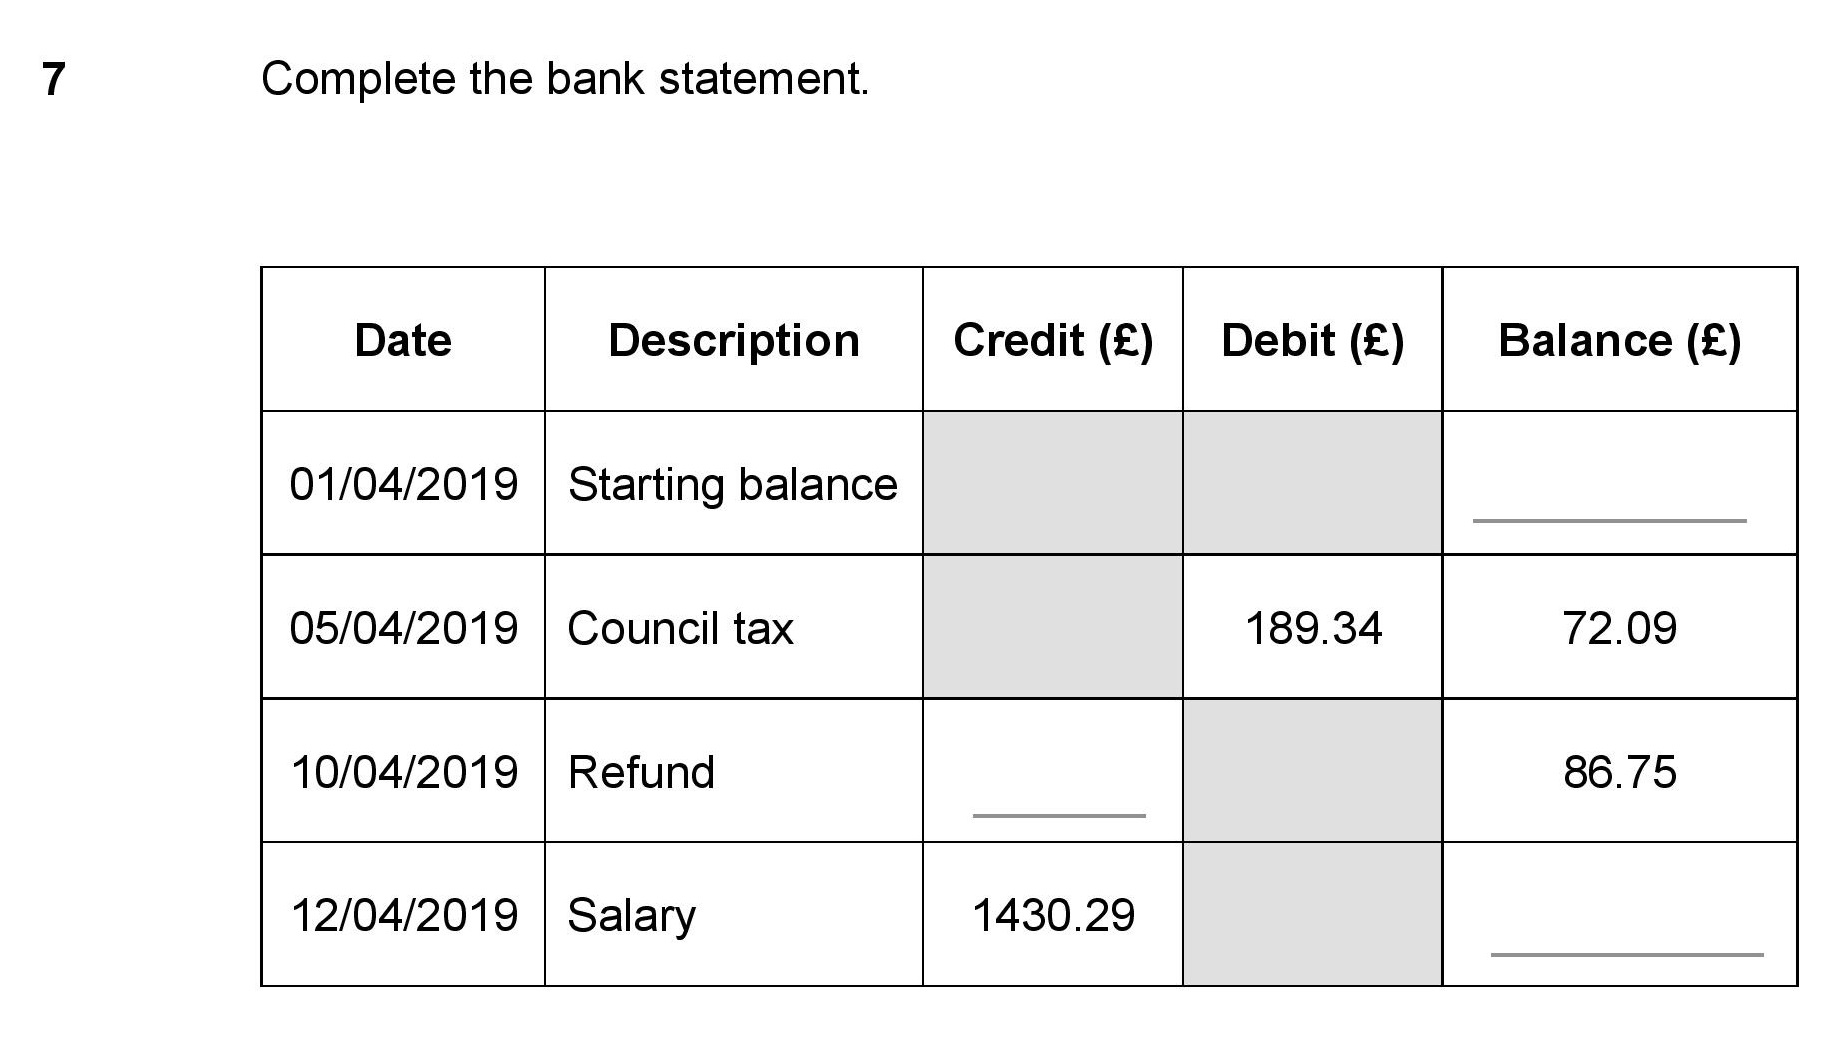
| Bank statements | 1 | 3 | 0.33 | 0.33 | 0 | |
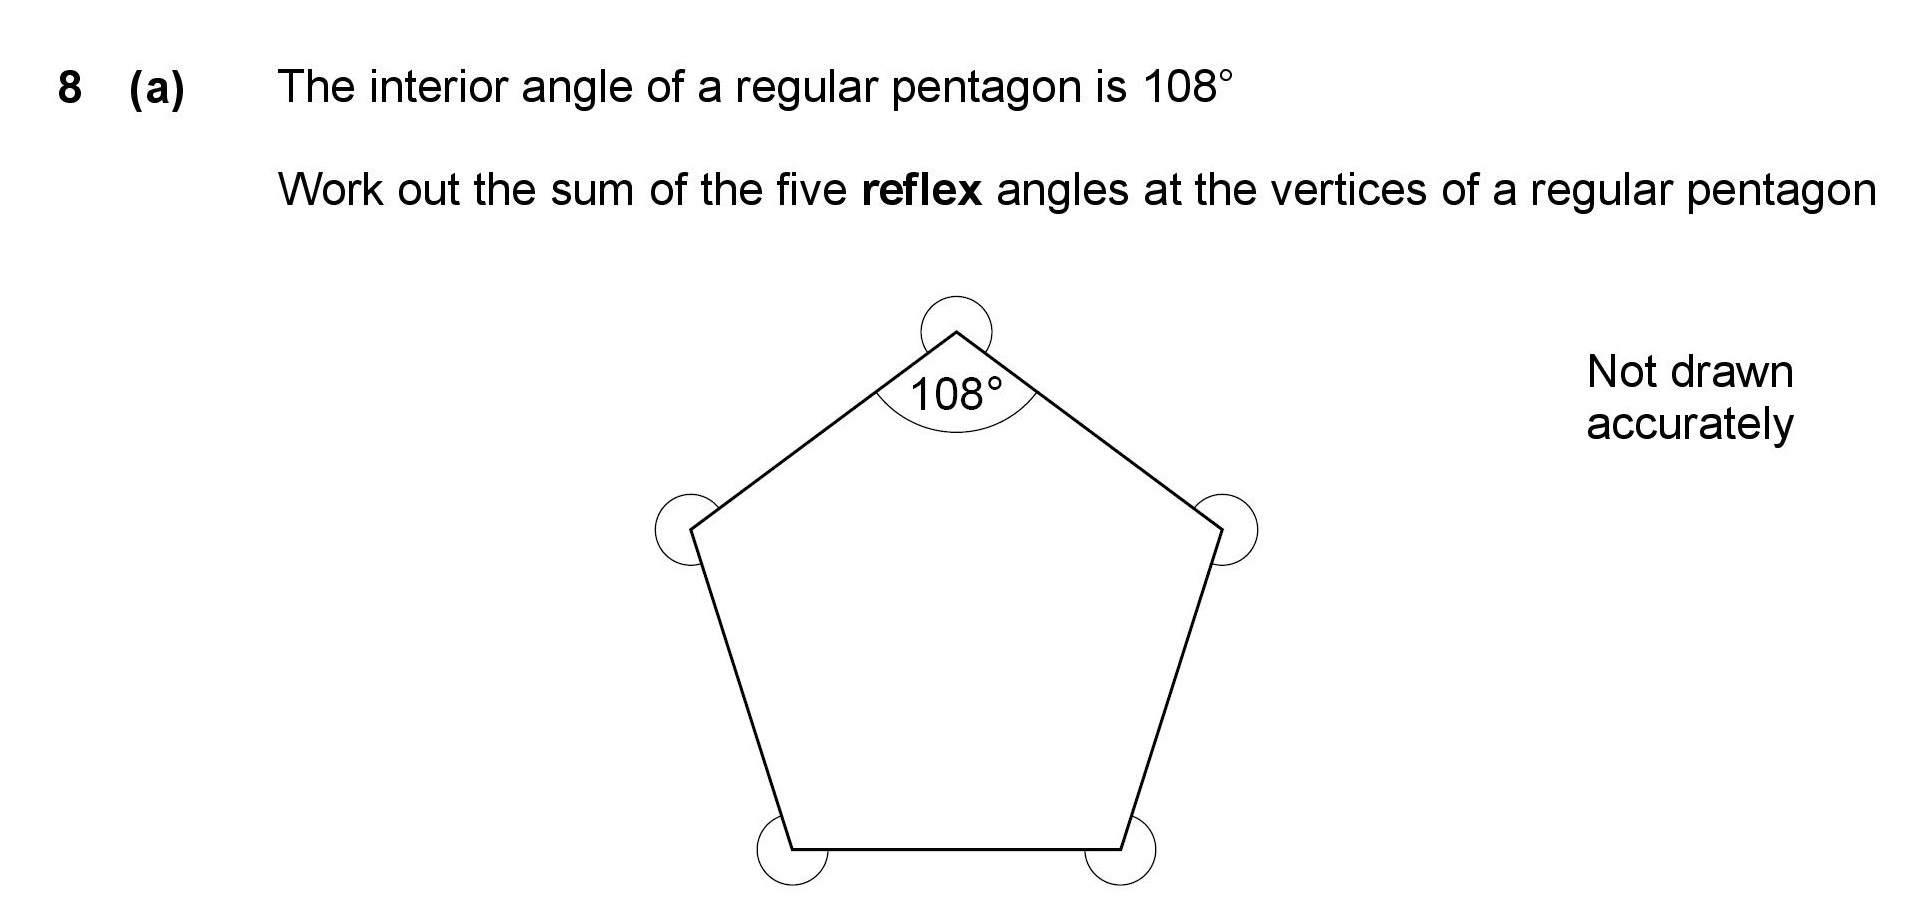
| Sum of Reflex Angles | 1 | 3 | 0.5 | 0.31 | 0.19 | |
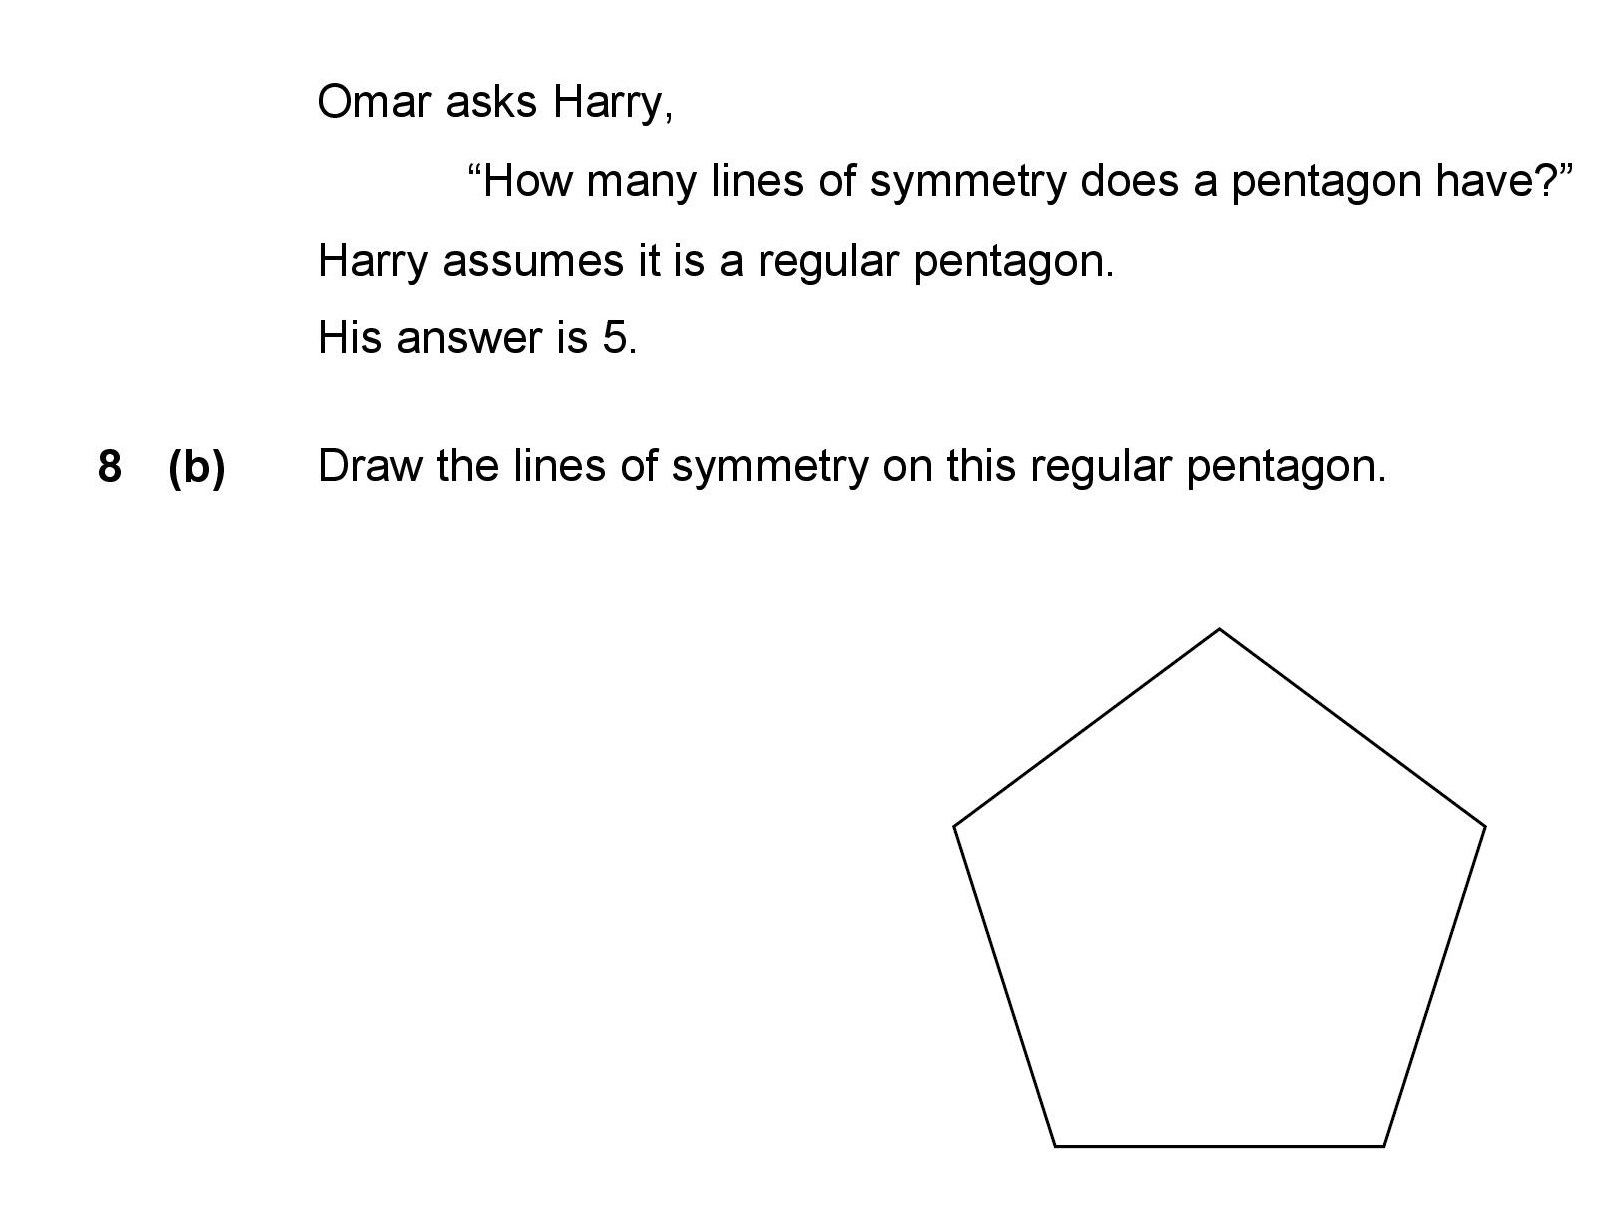
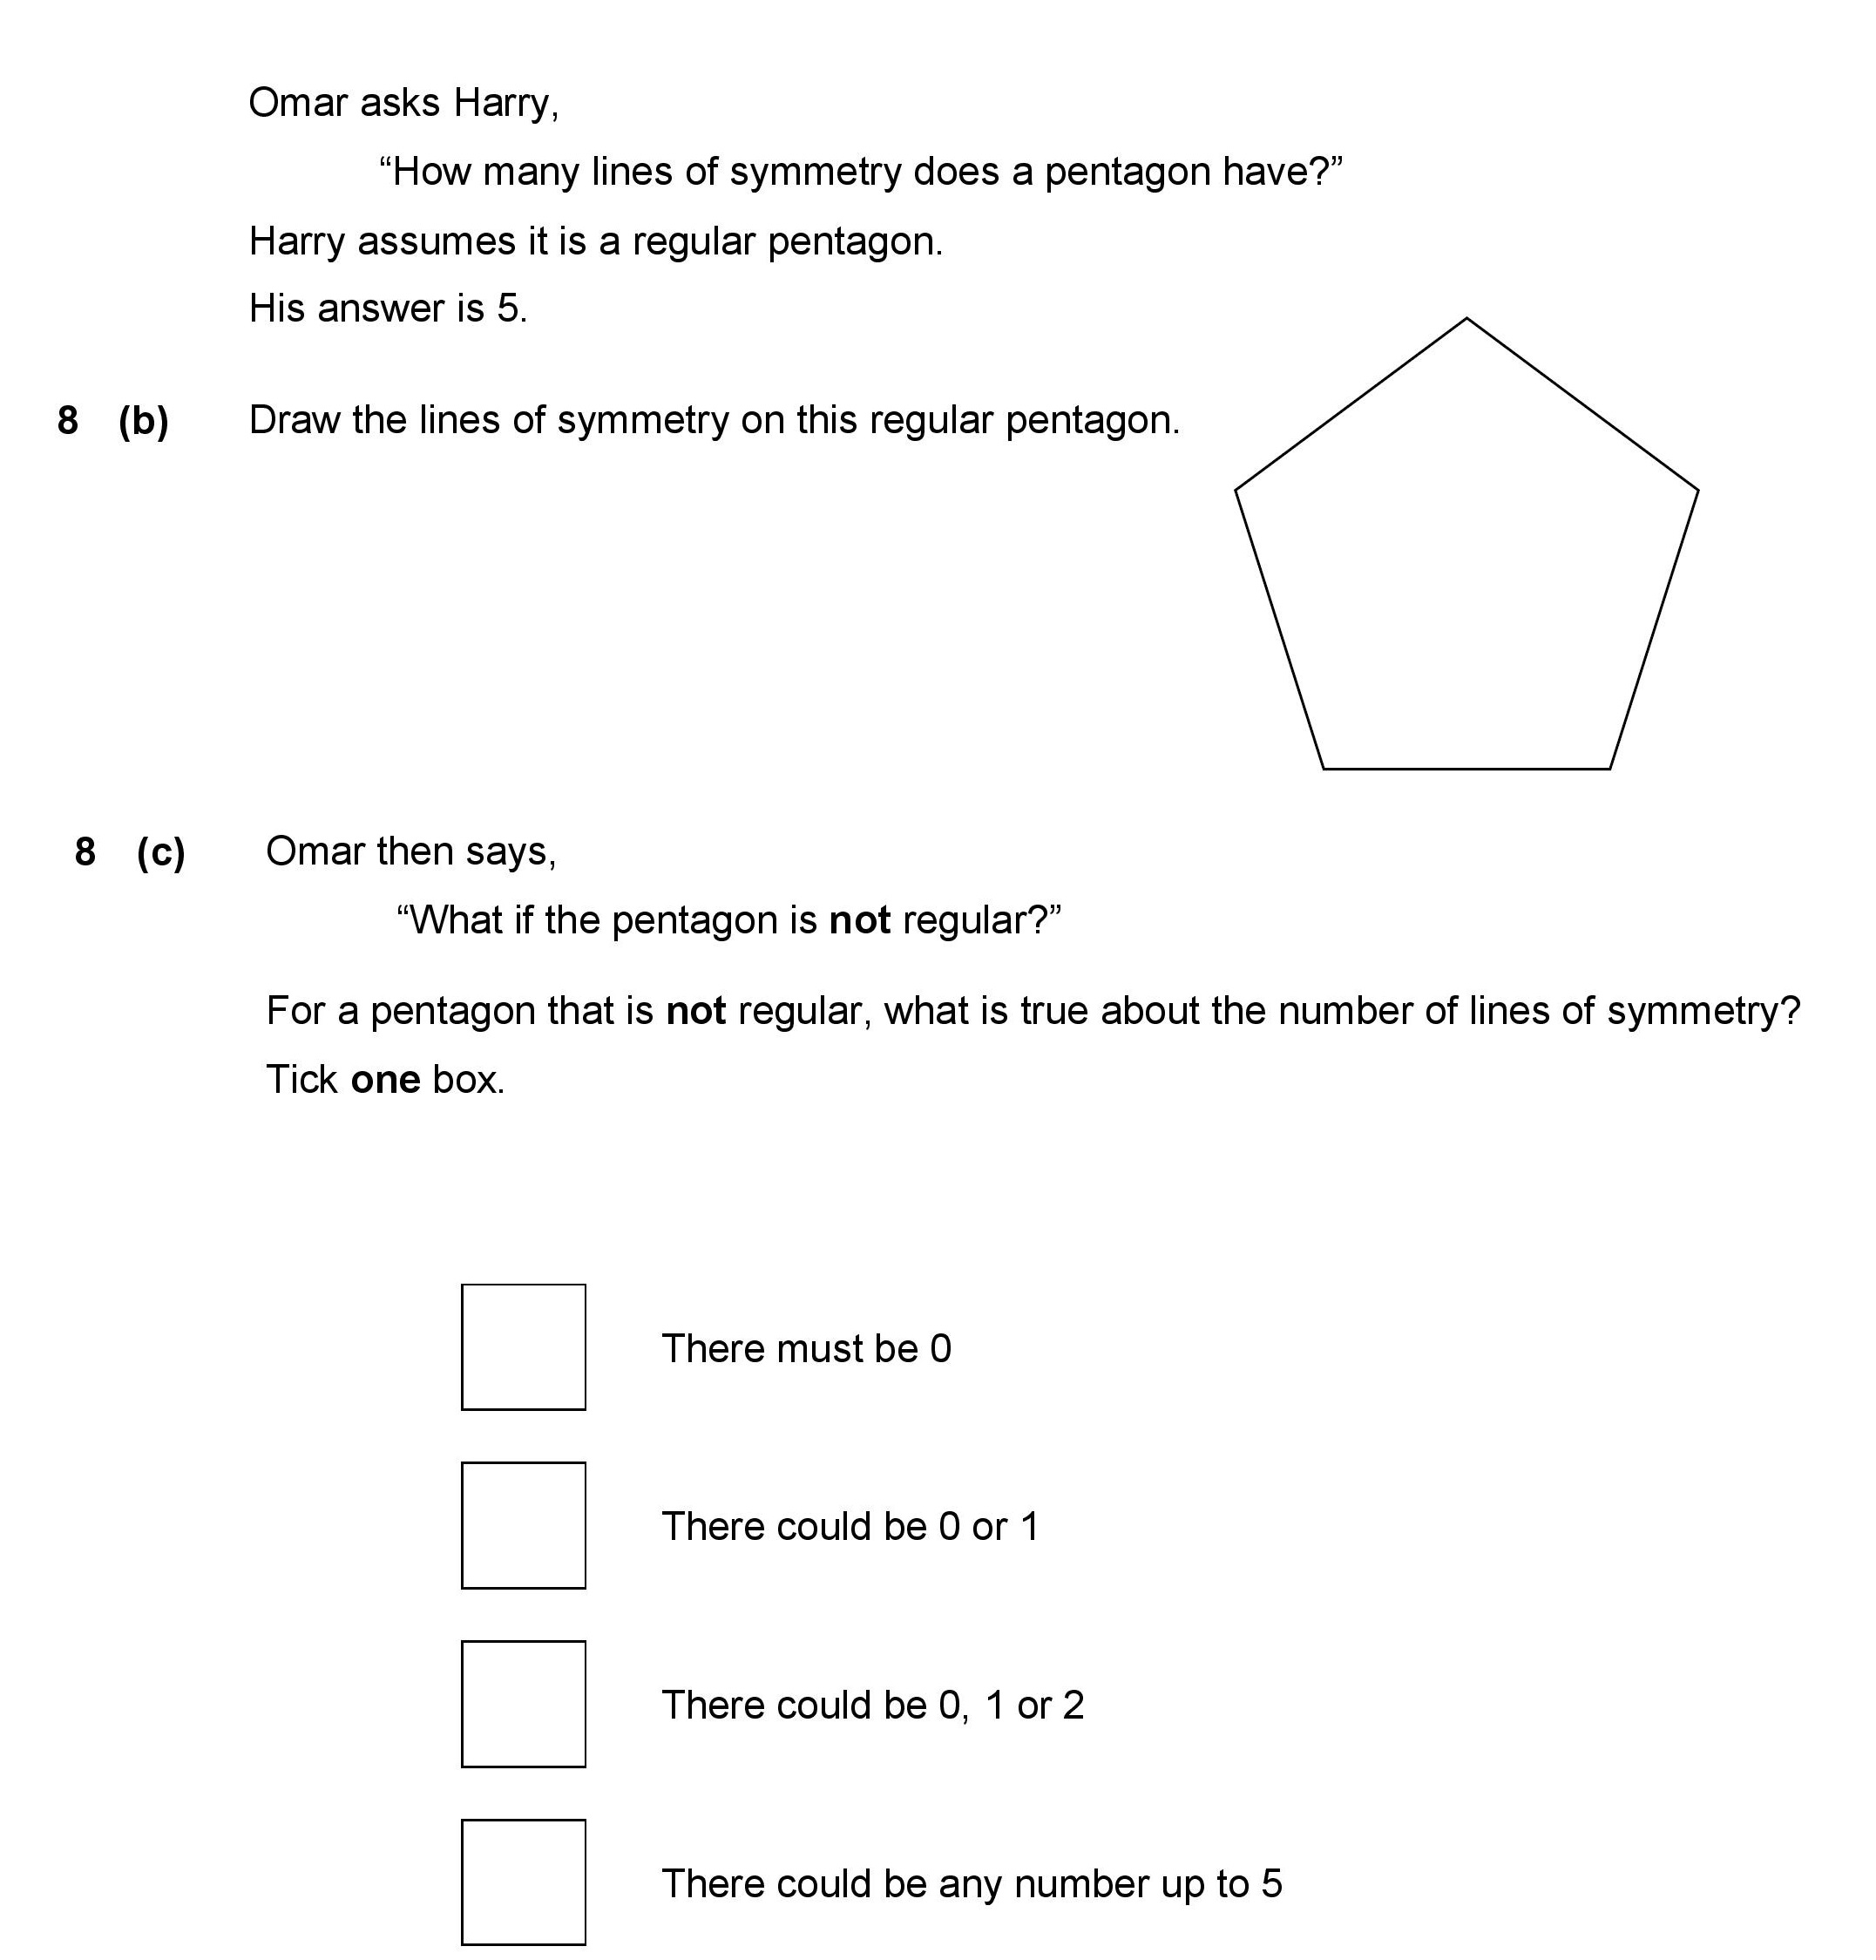
| Symmetry | 1 | 1 | 1 | 0.27 | 0.73 | |
| Symmetry of Irregular Polygon | 2 | 1 | 1.5 | 0.33 | 1.17 | |
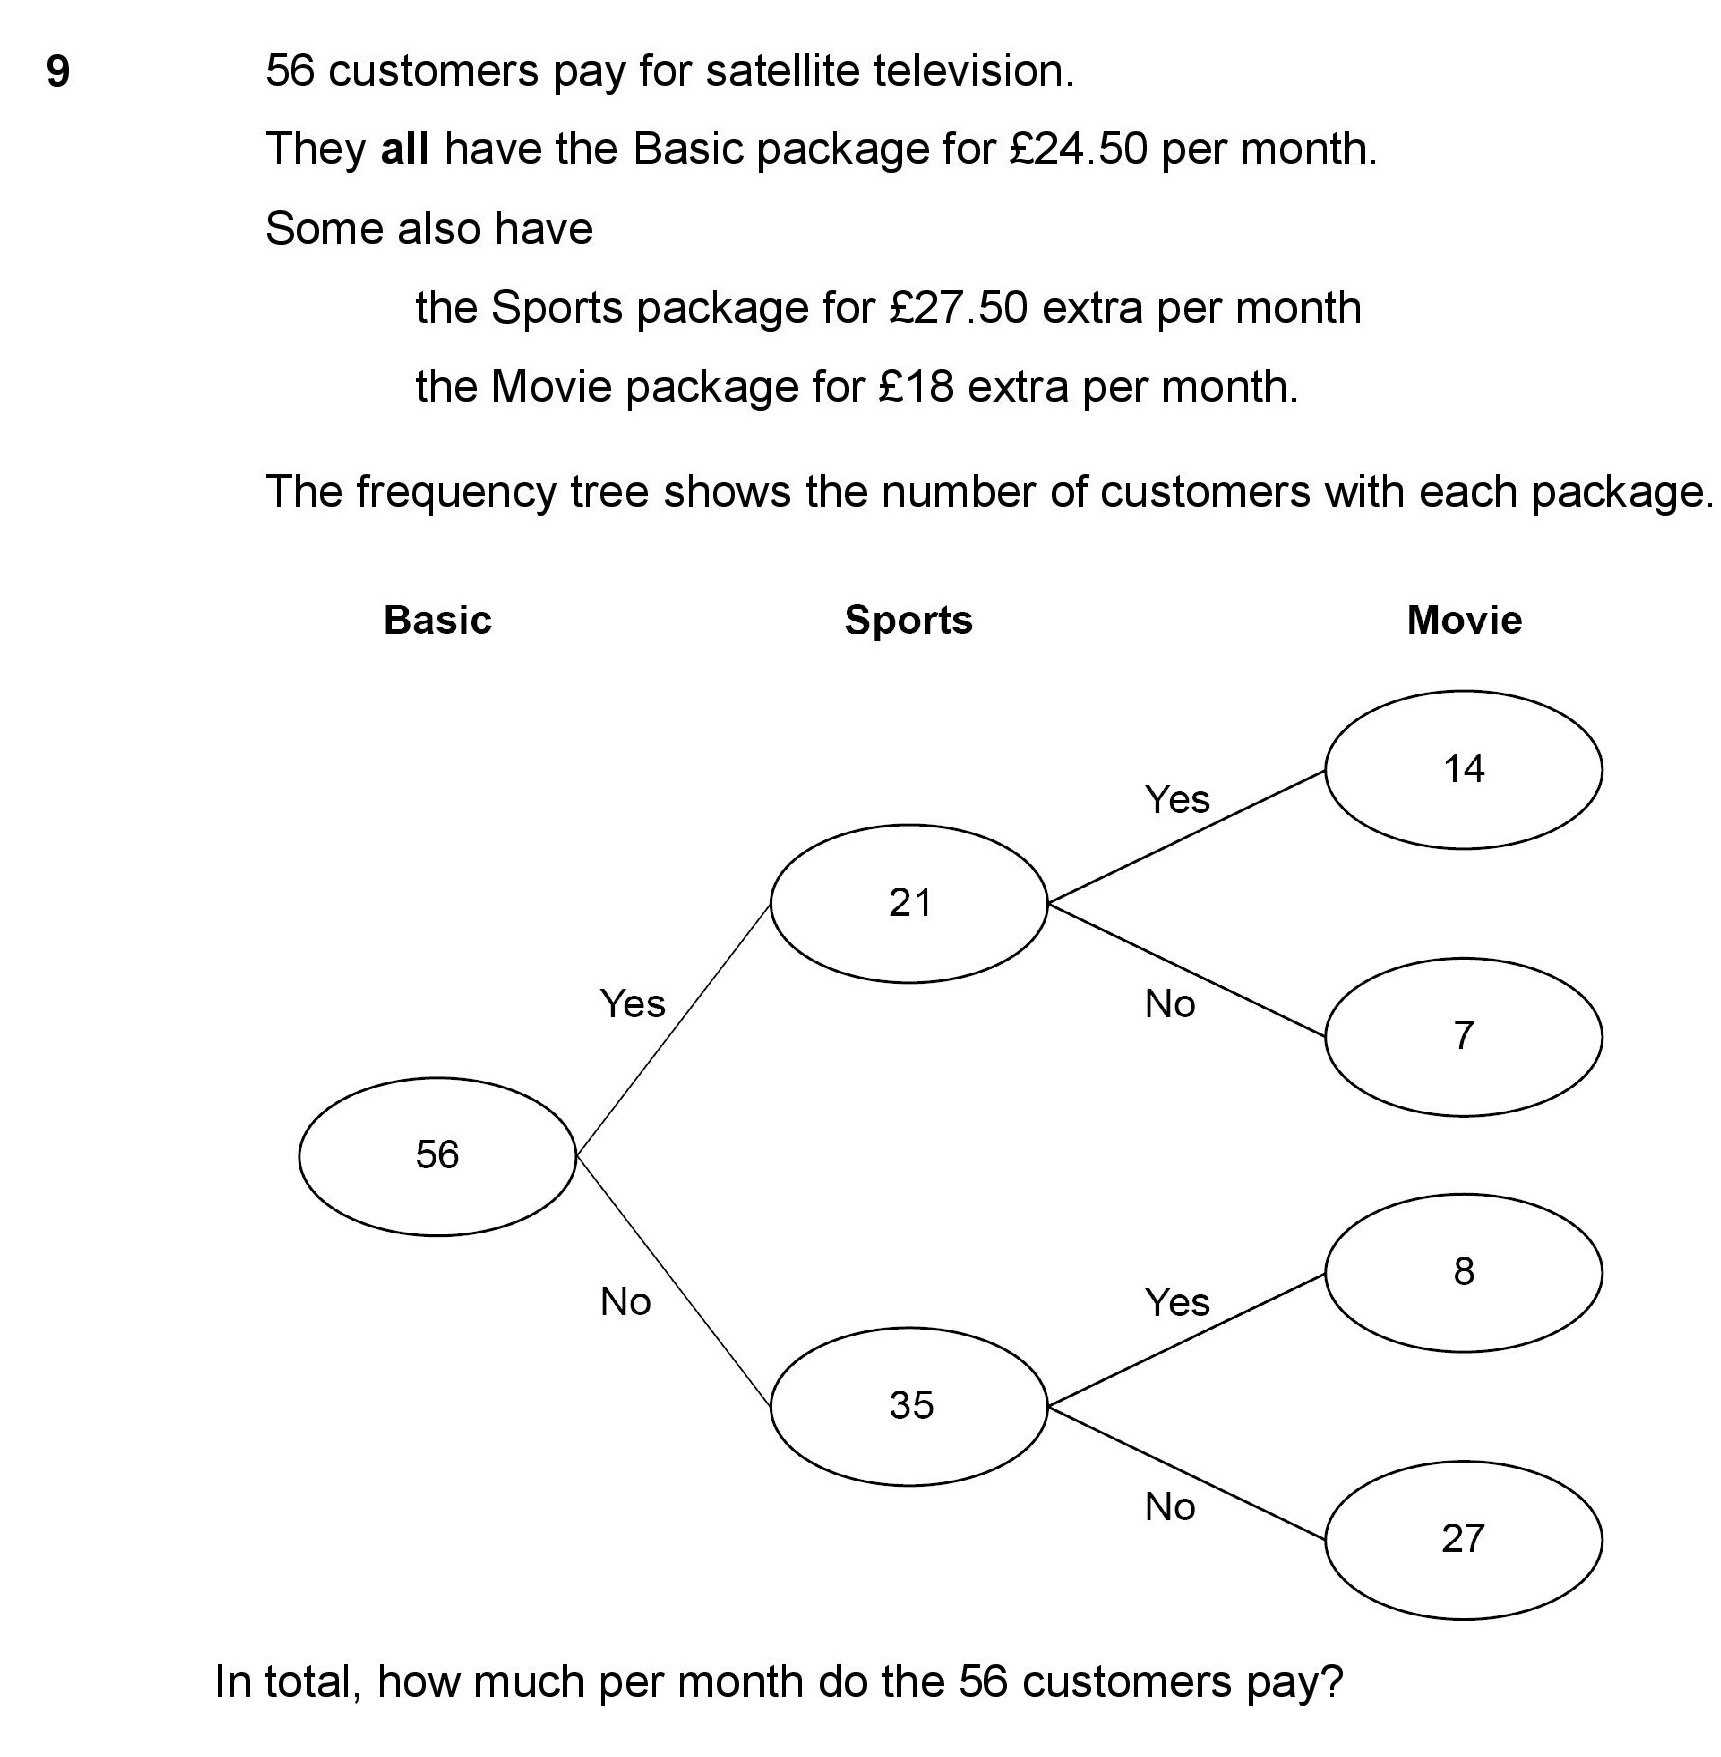
| Frequency trees | 1 | 4 | 0.25 | 0.46 | -0.21 | |
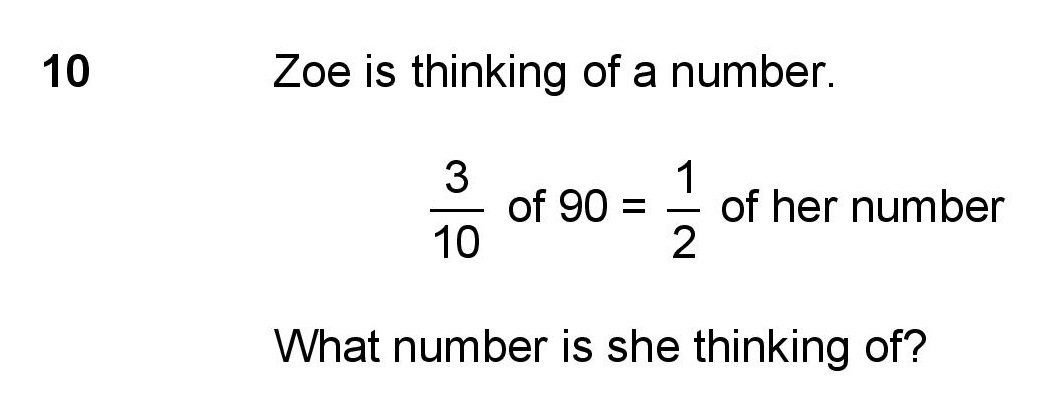
| Reverse Fraction Problems | 1 | 3 | 0.5 | 0.51 | -0.01 | |
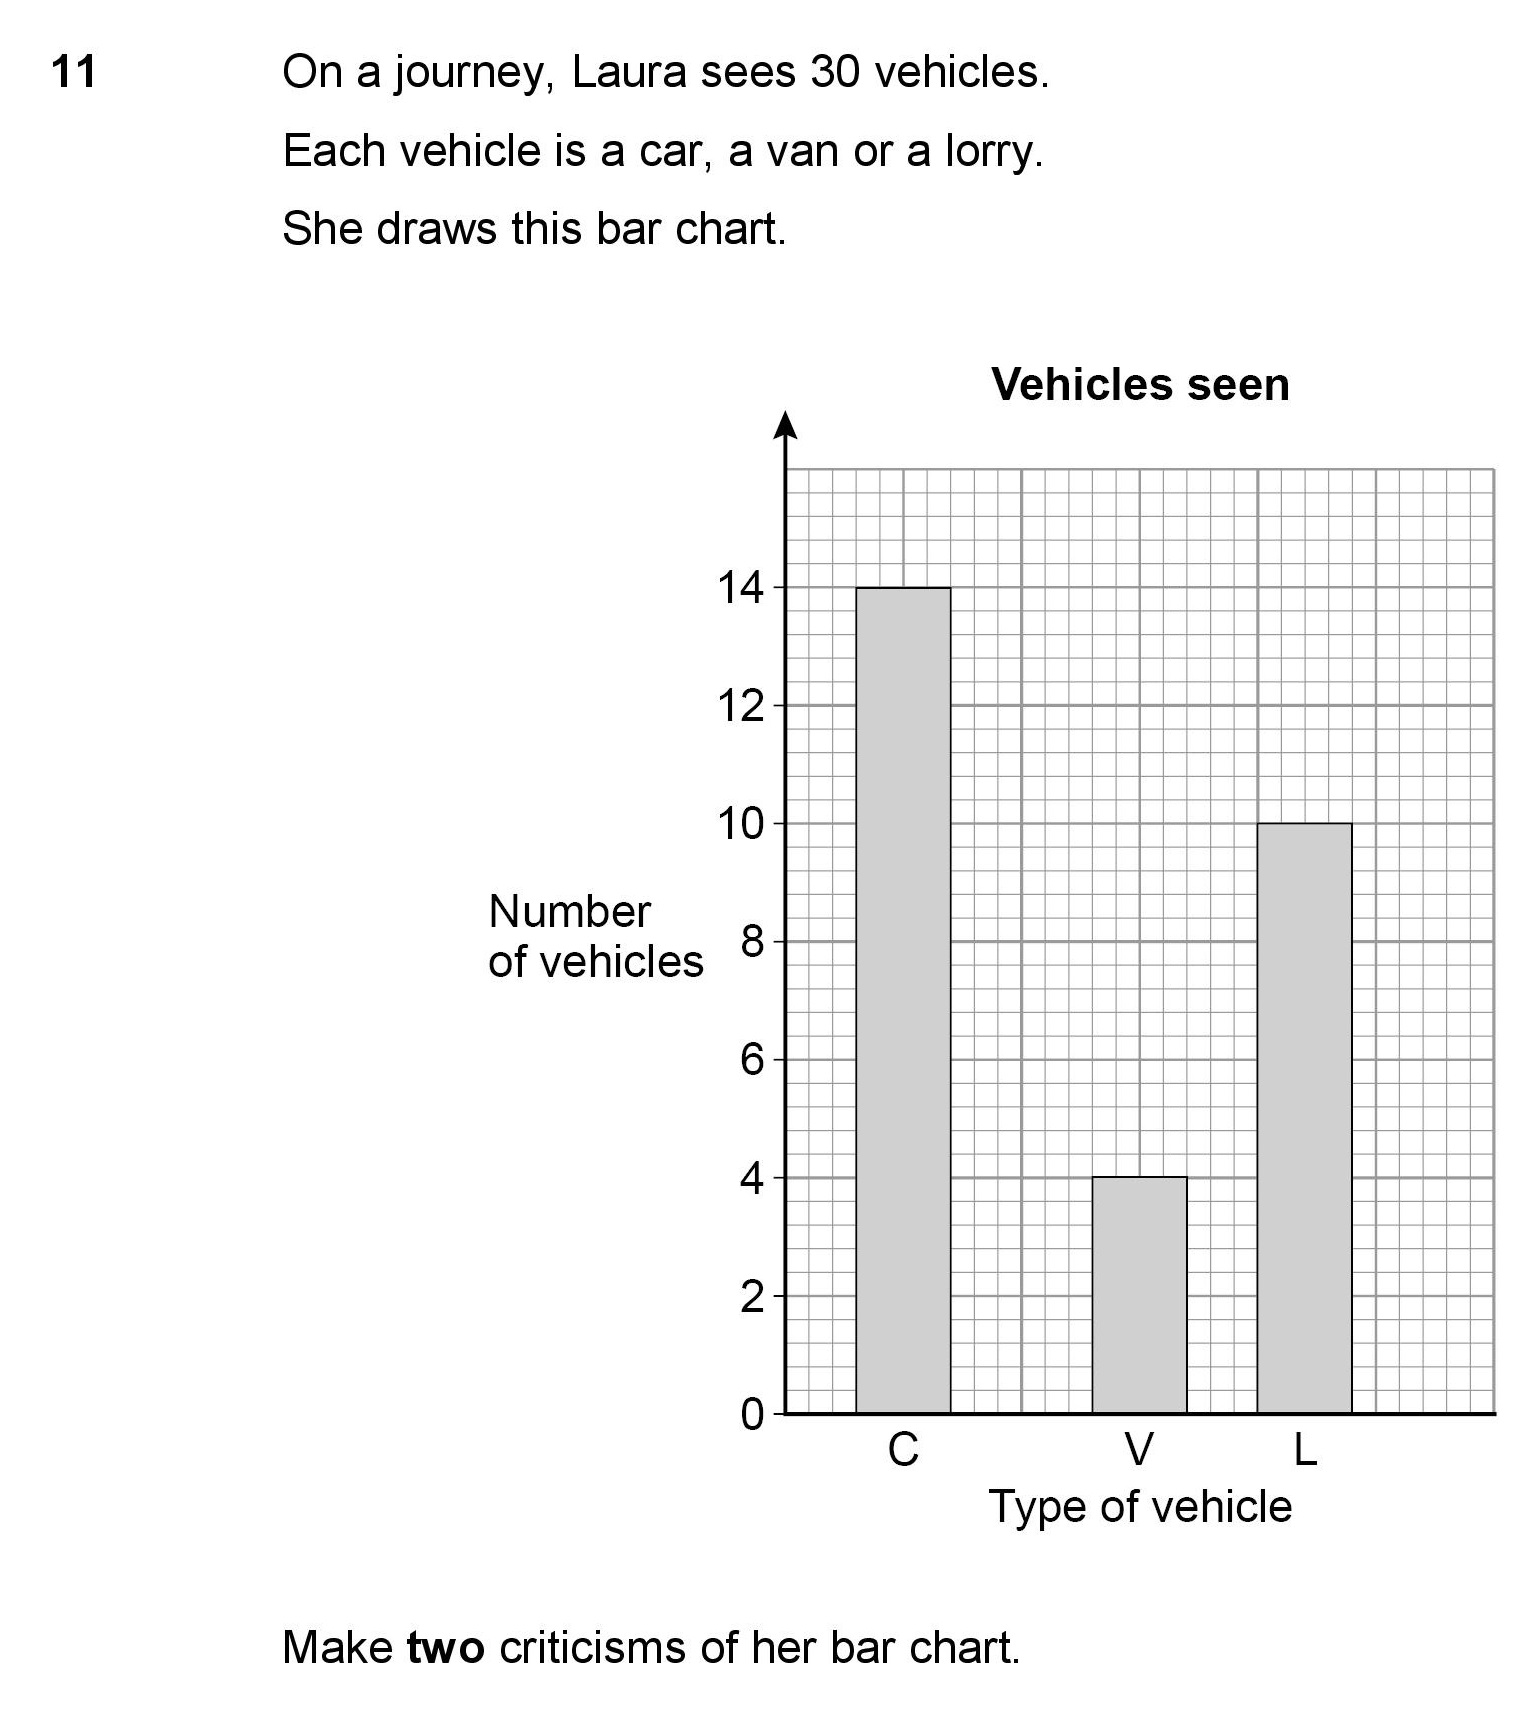
| Criticize a Bar Chart | 2 | 2 | 0.5 | 0.62 | -0.12 | |
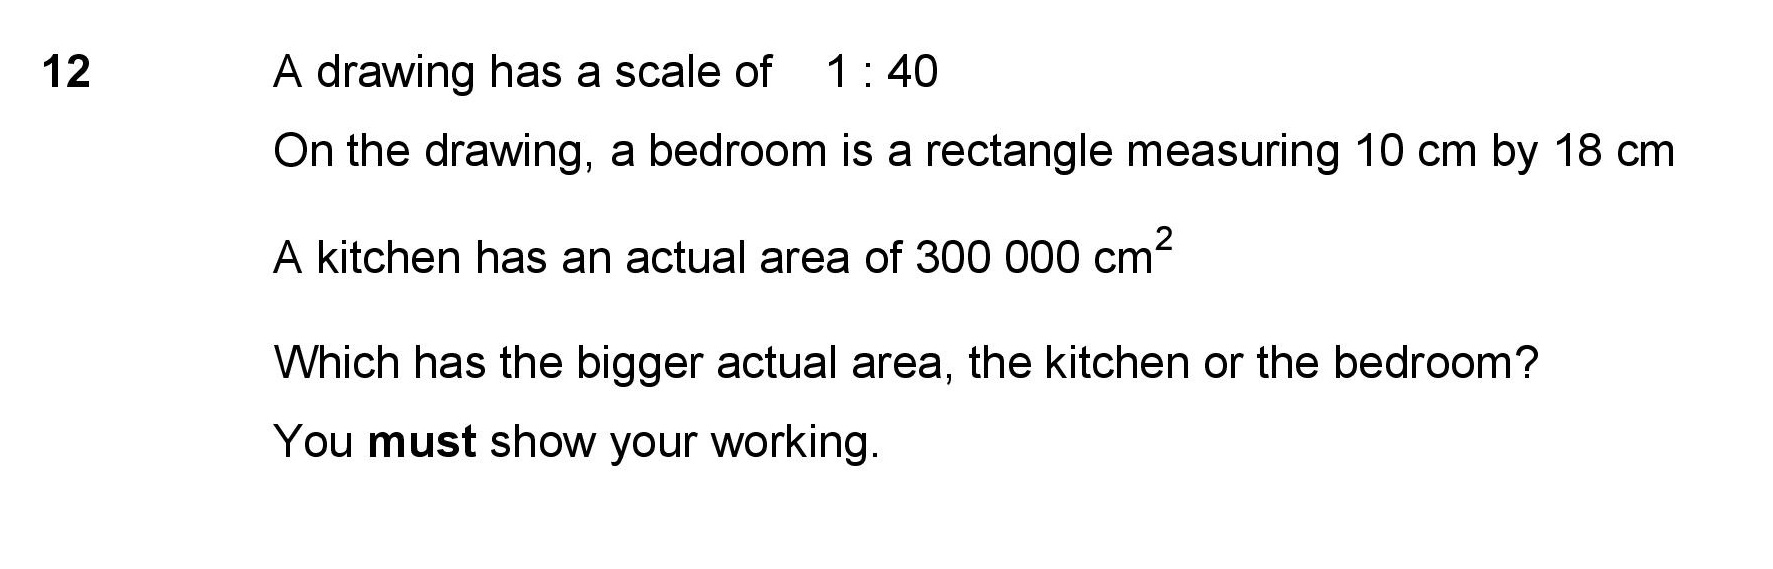
| Scales Diagrams | 2 | 4 | 0.38 | 0.18 | 0.2 | |
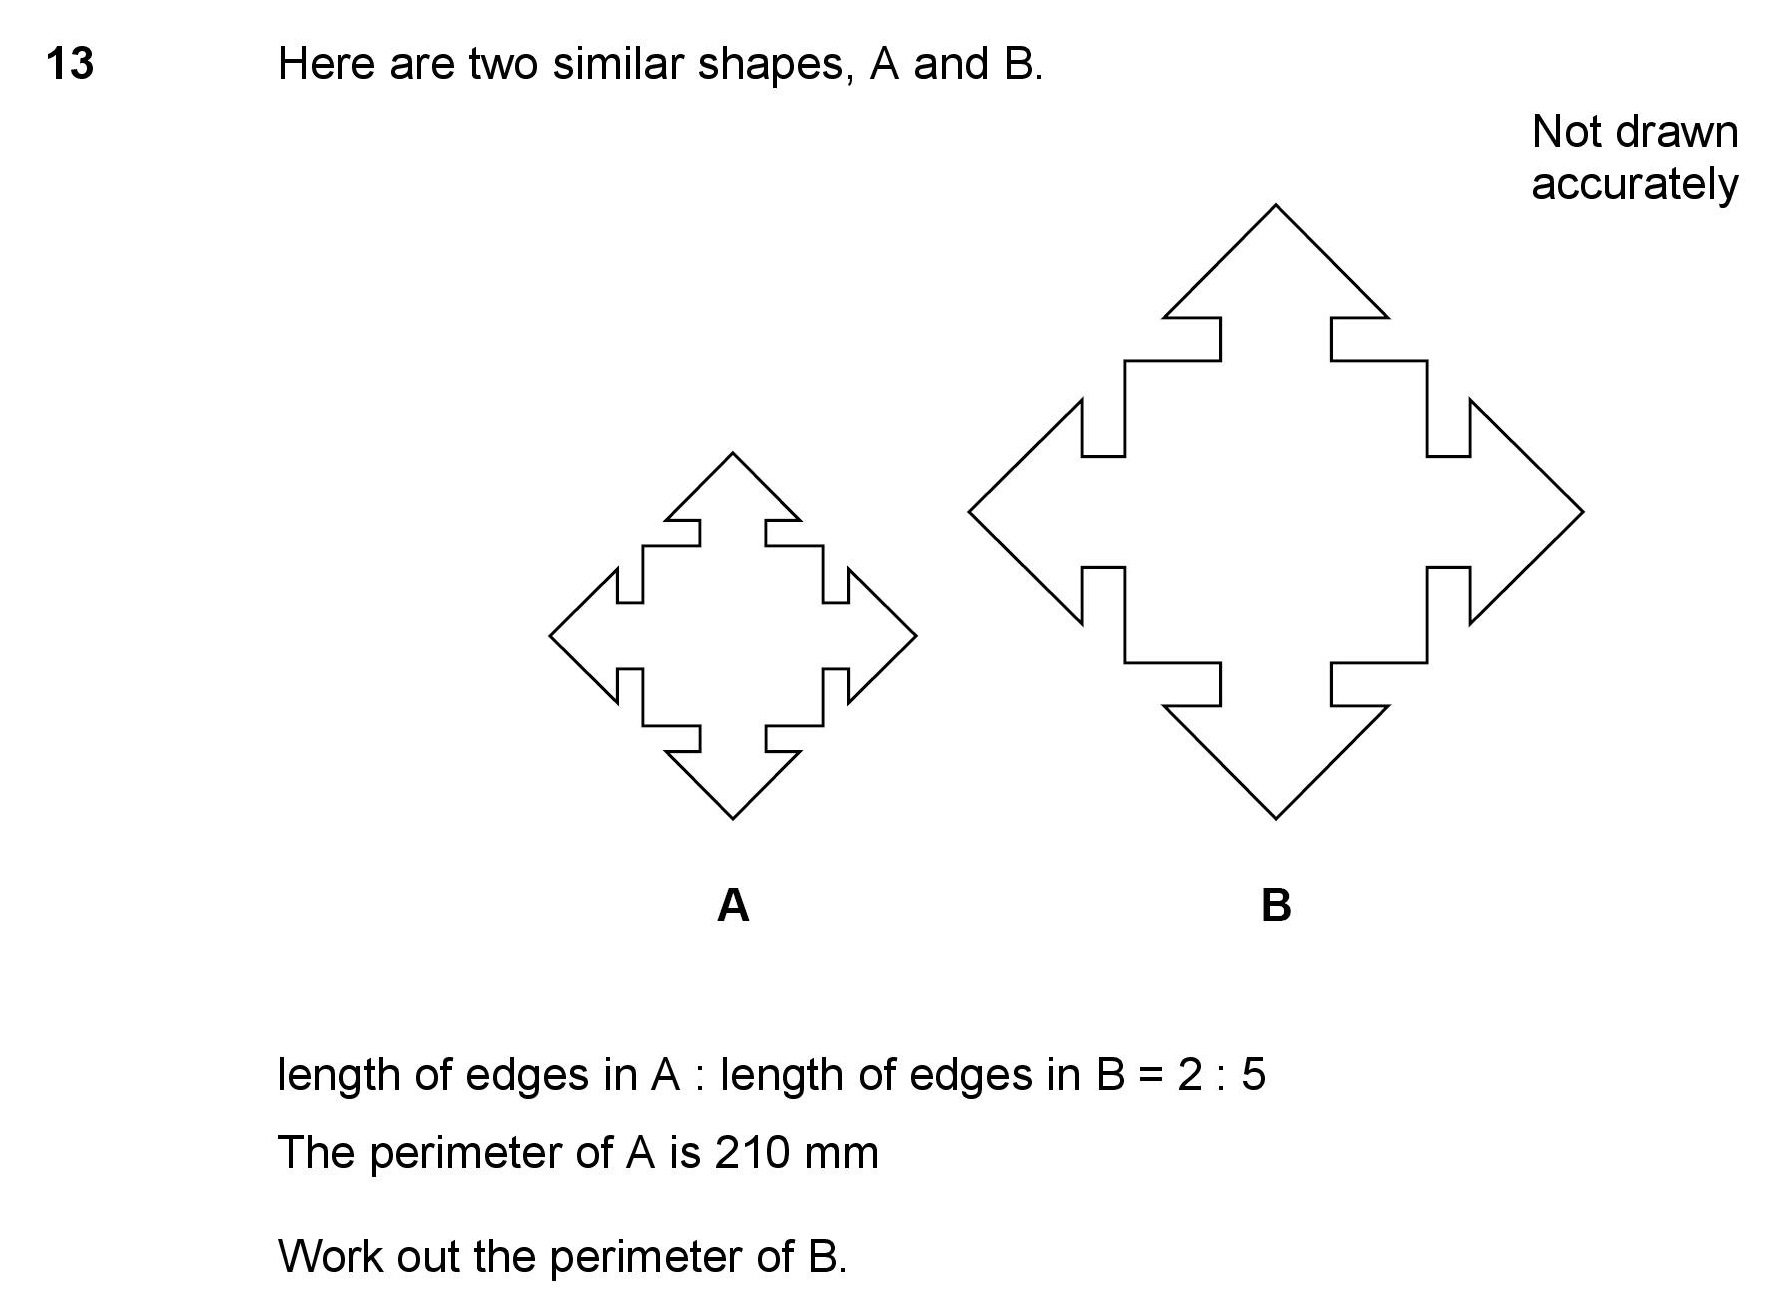
| Similar Shapes and Ratio | 1 | 2 | 0.5 | 0.26 | 0.24 | |
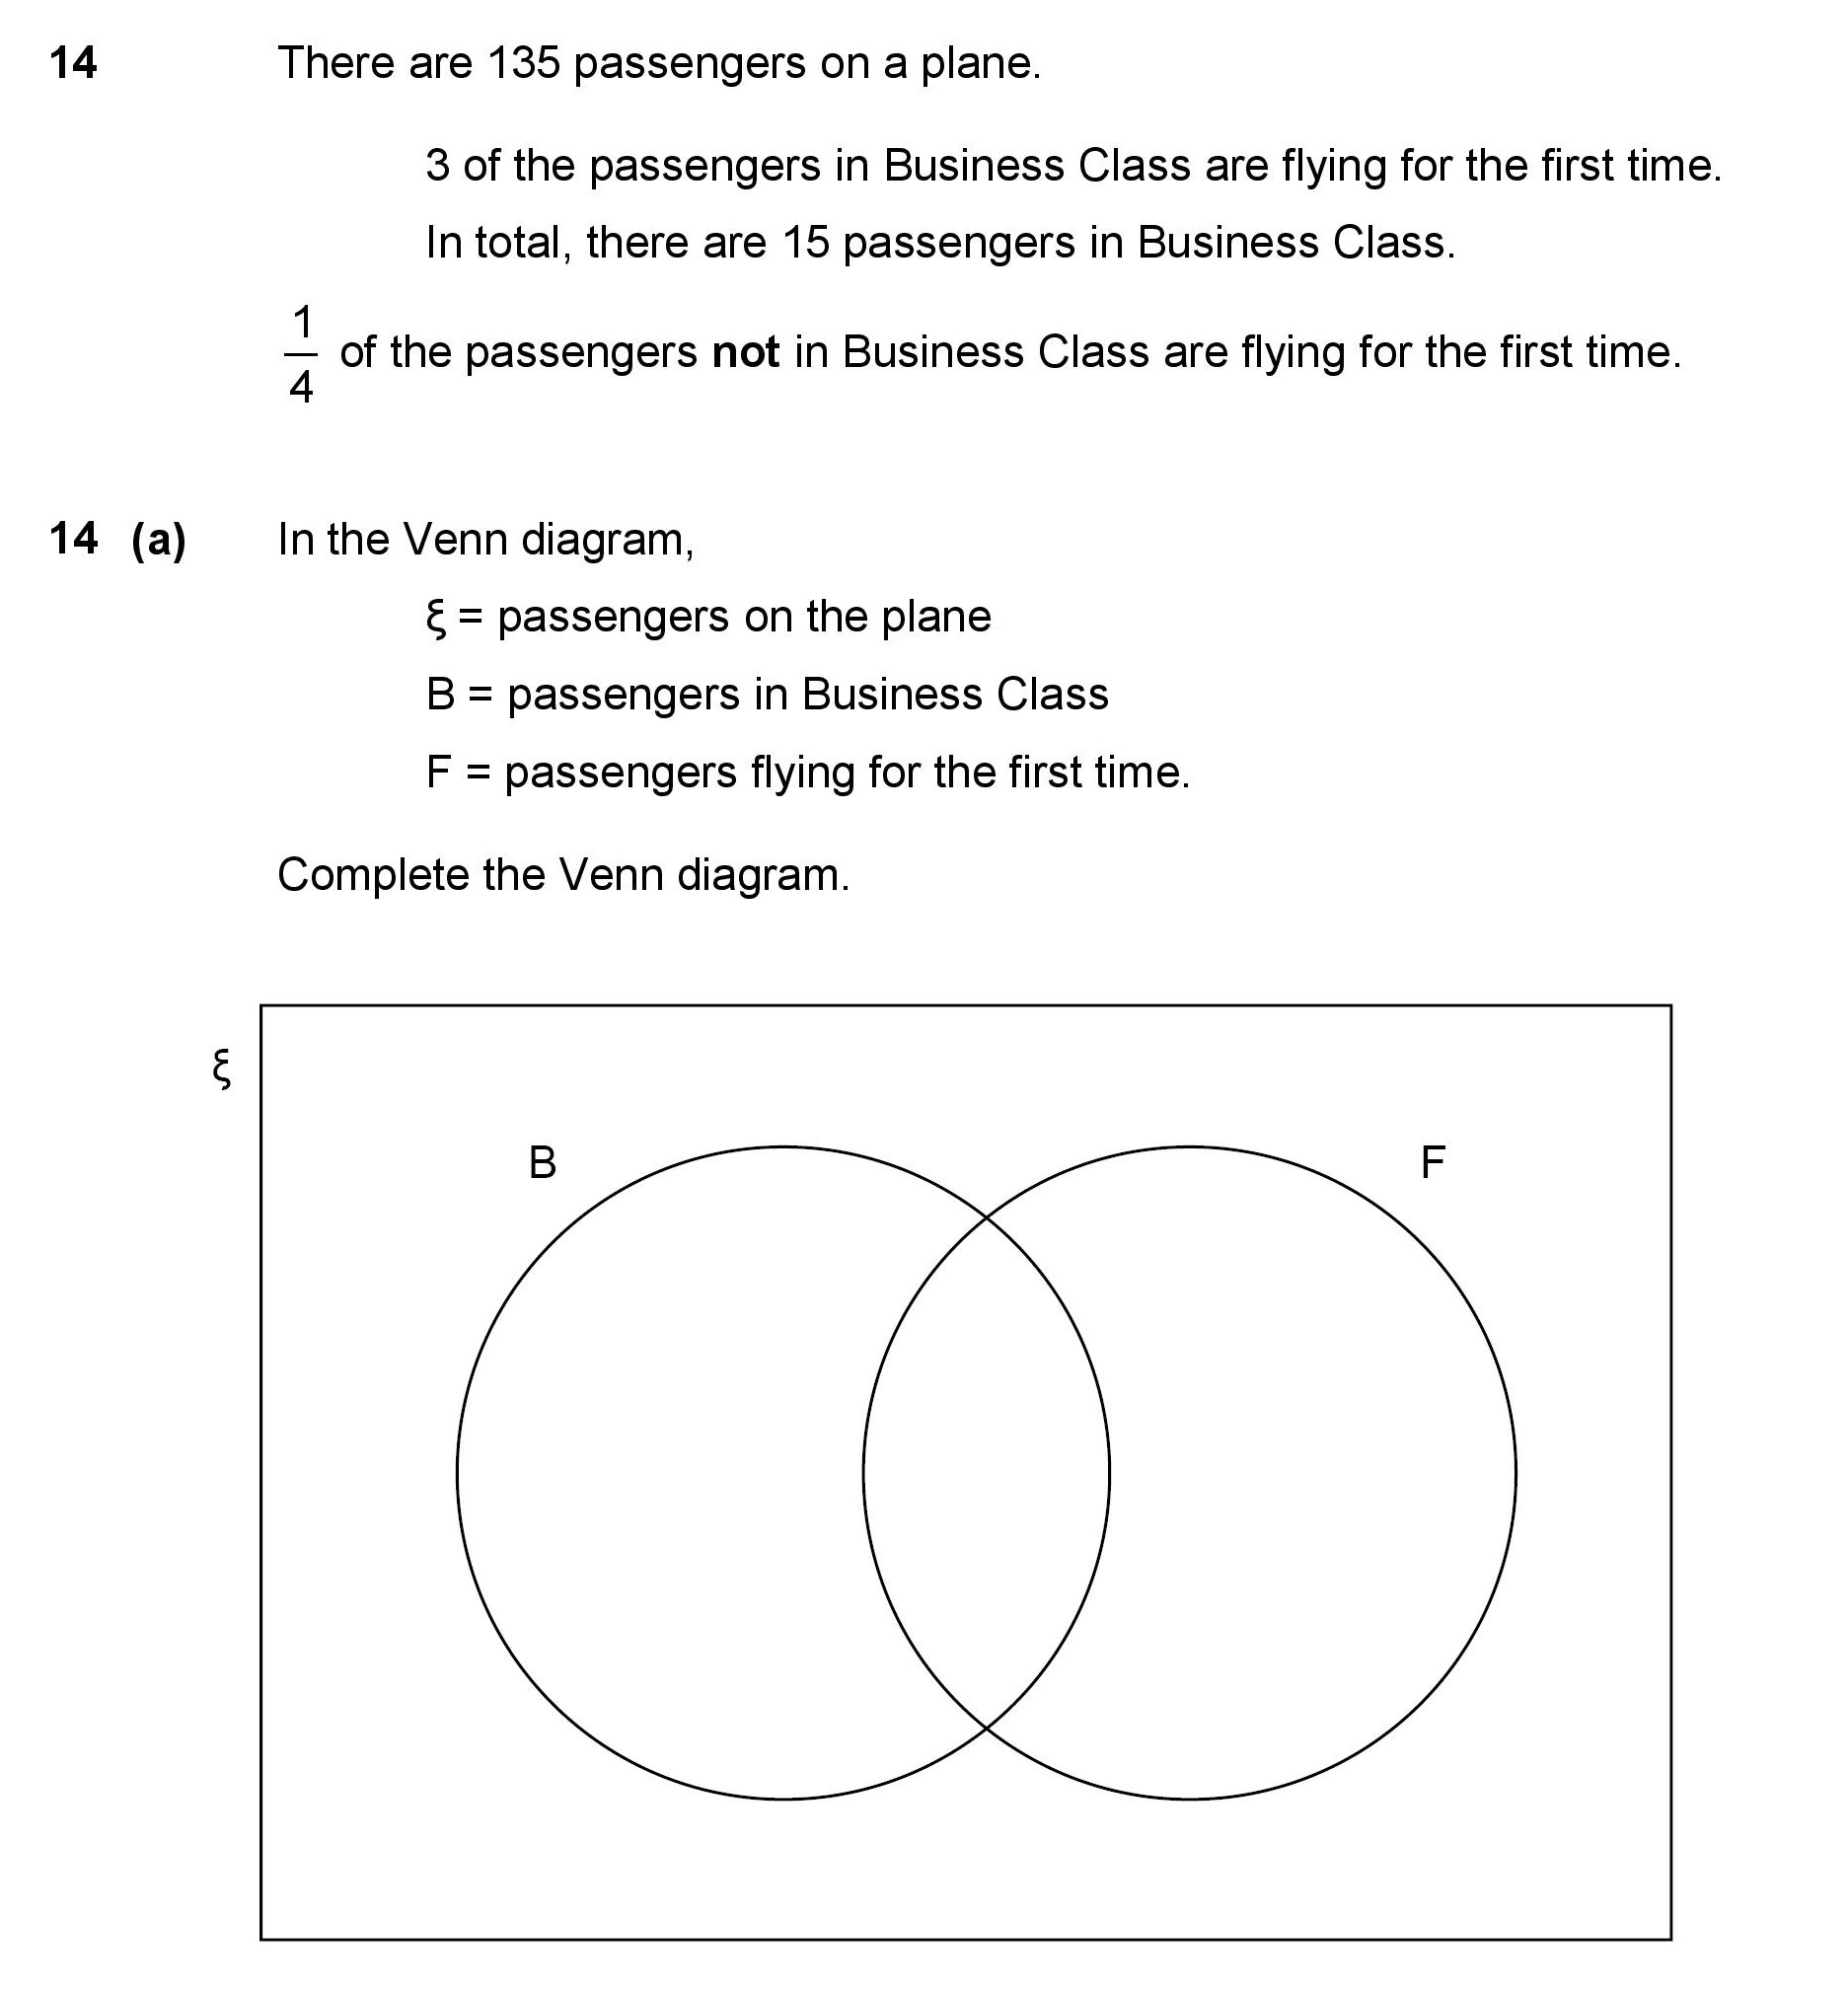
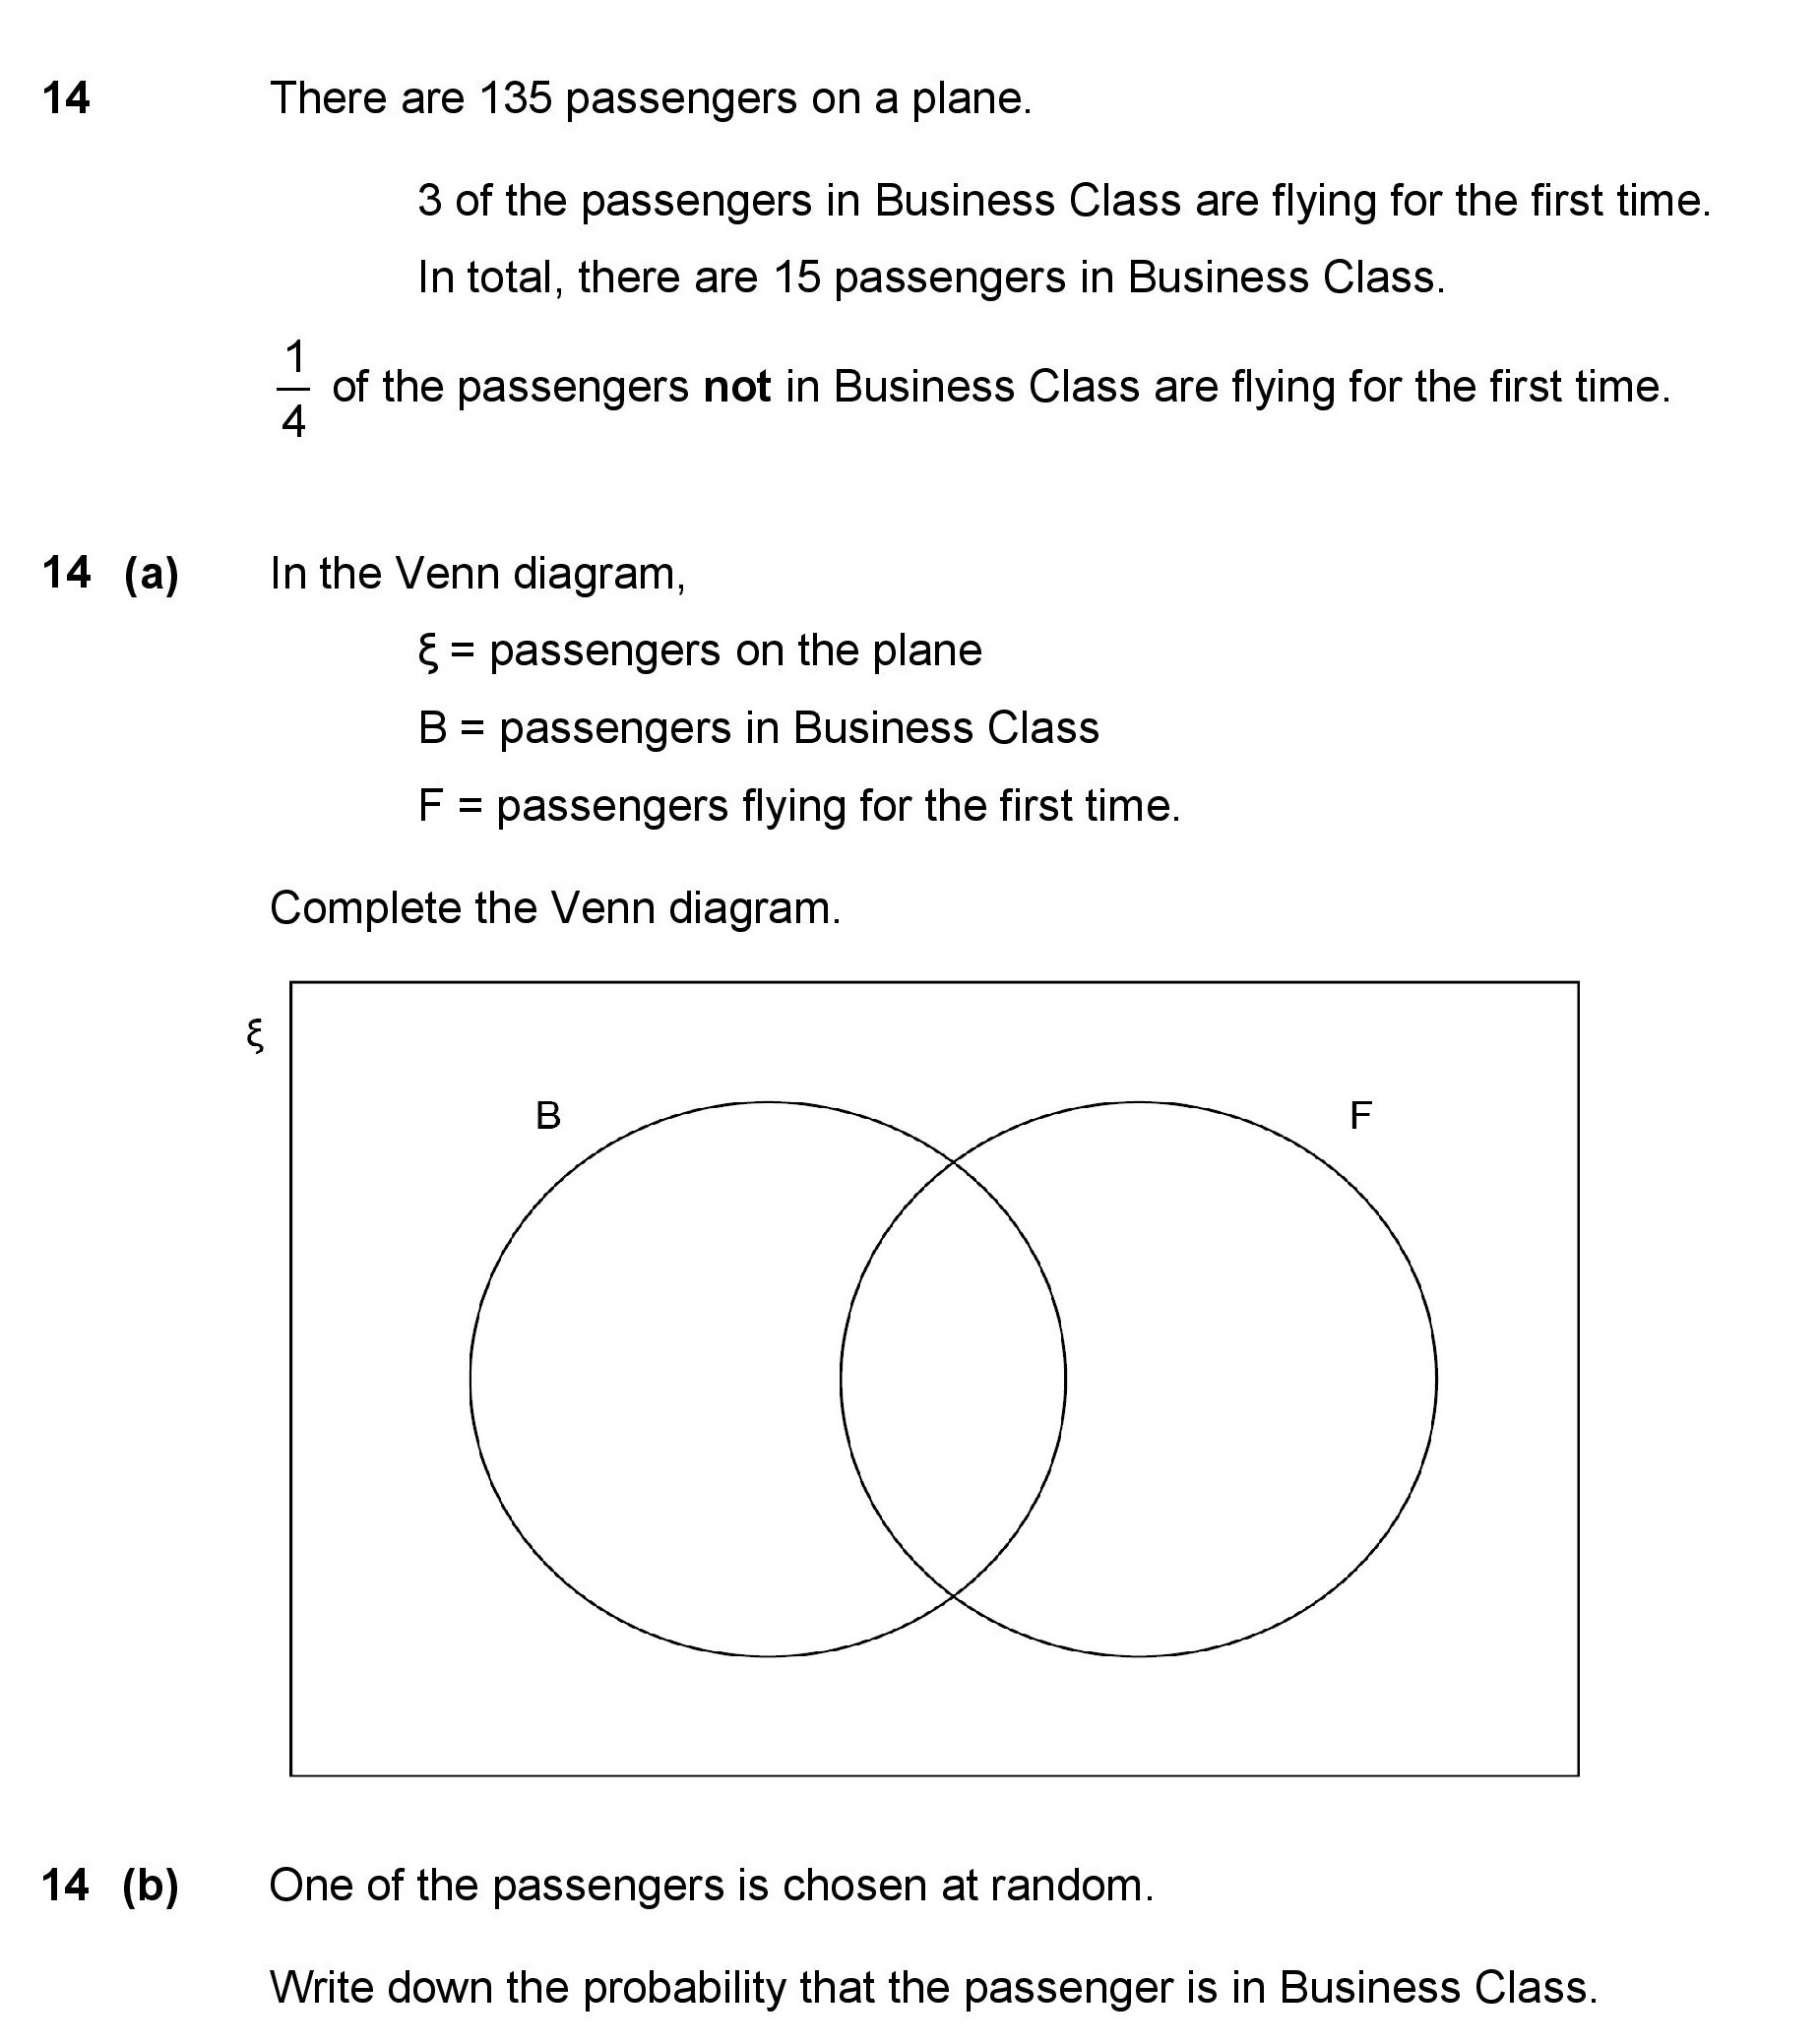
| Venn diagrams | 2 | 4 | 0.38 | 0.4 | -0.02 | |
| Venn Diagrams and Probability | 1 | 1 | 1 | 0.4 | 0.6 | |
| Find y-intercept | 1 | 1 | 1.5 | 0.23 | 1.27 | |
| Find x-intercept | 1 | 1 | 1 | 0.08 | 0.92 | |
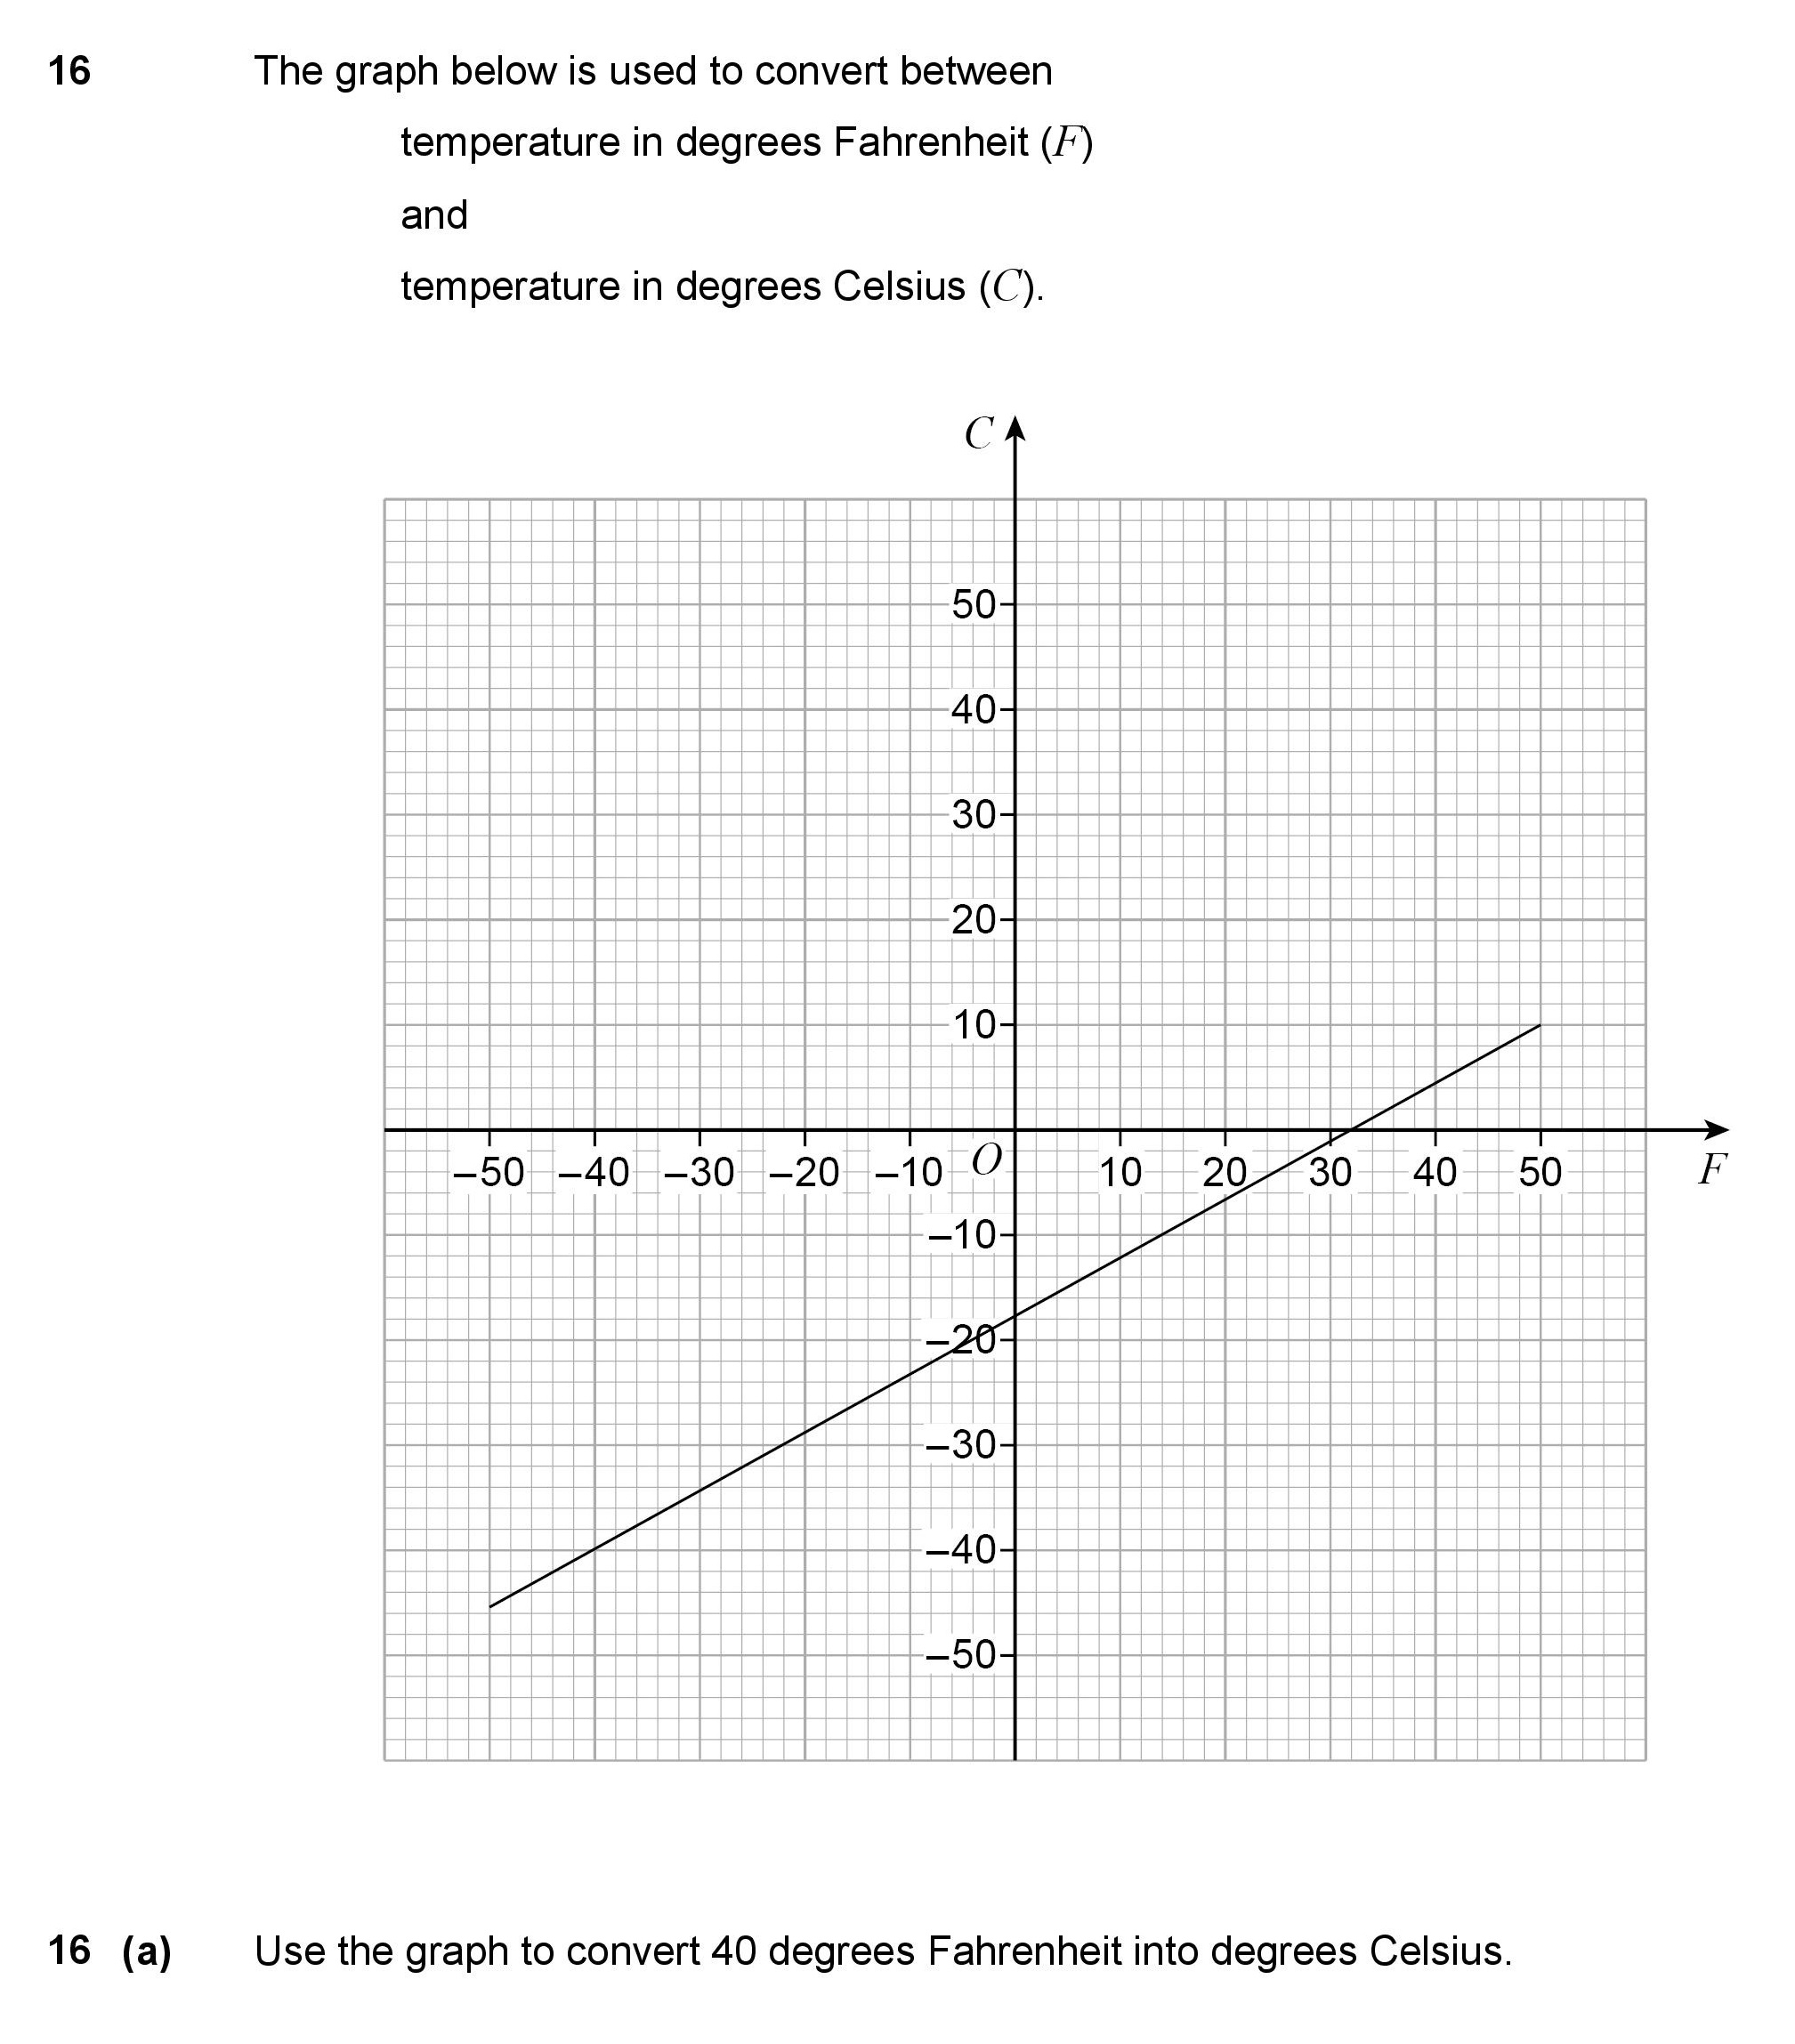
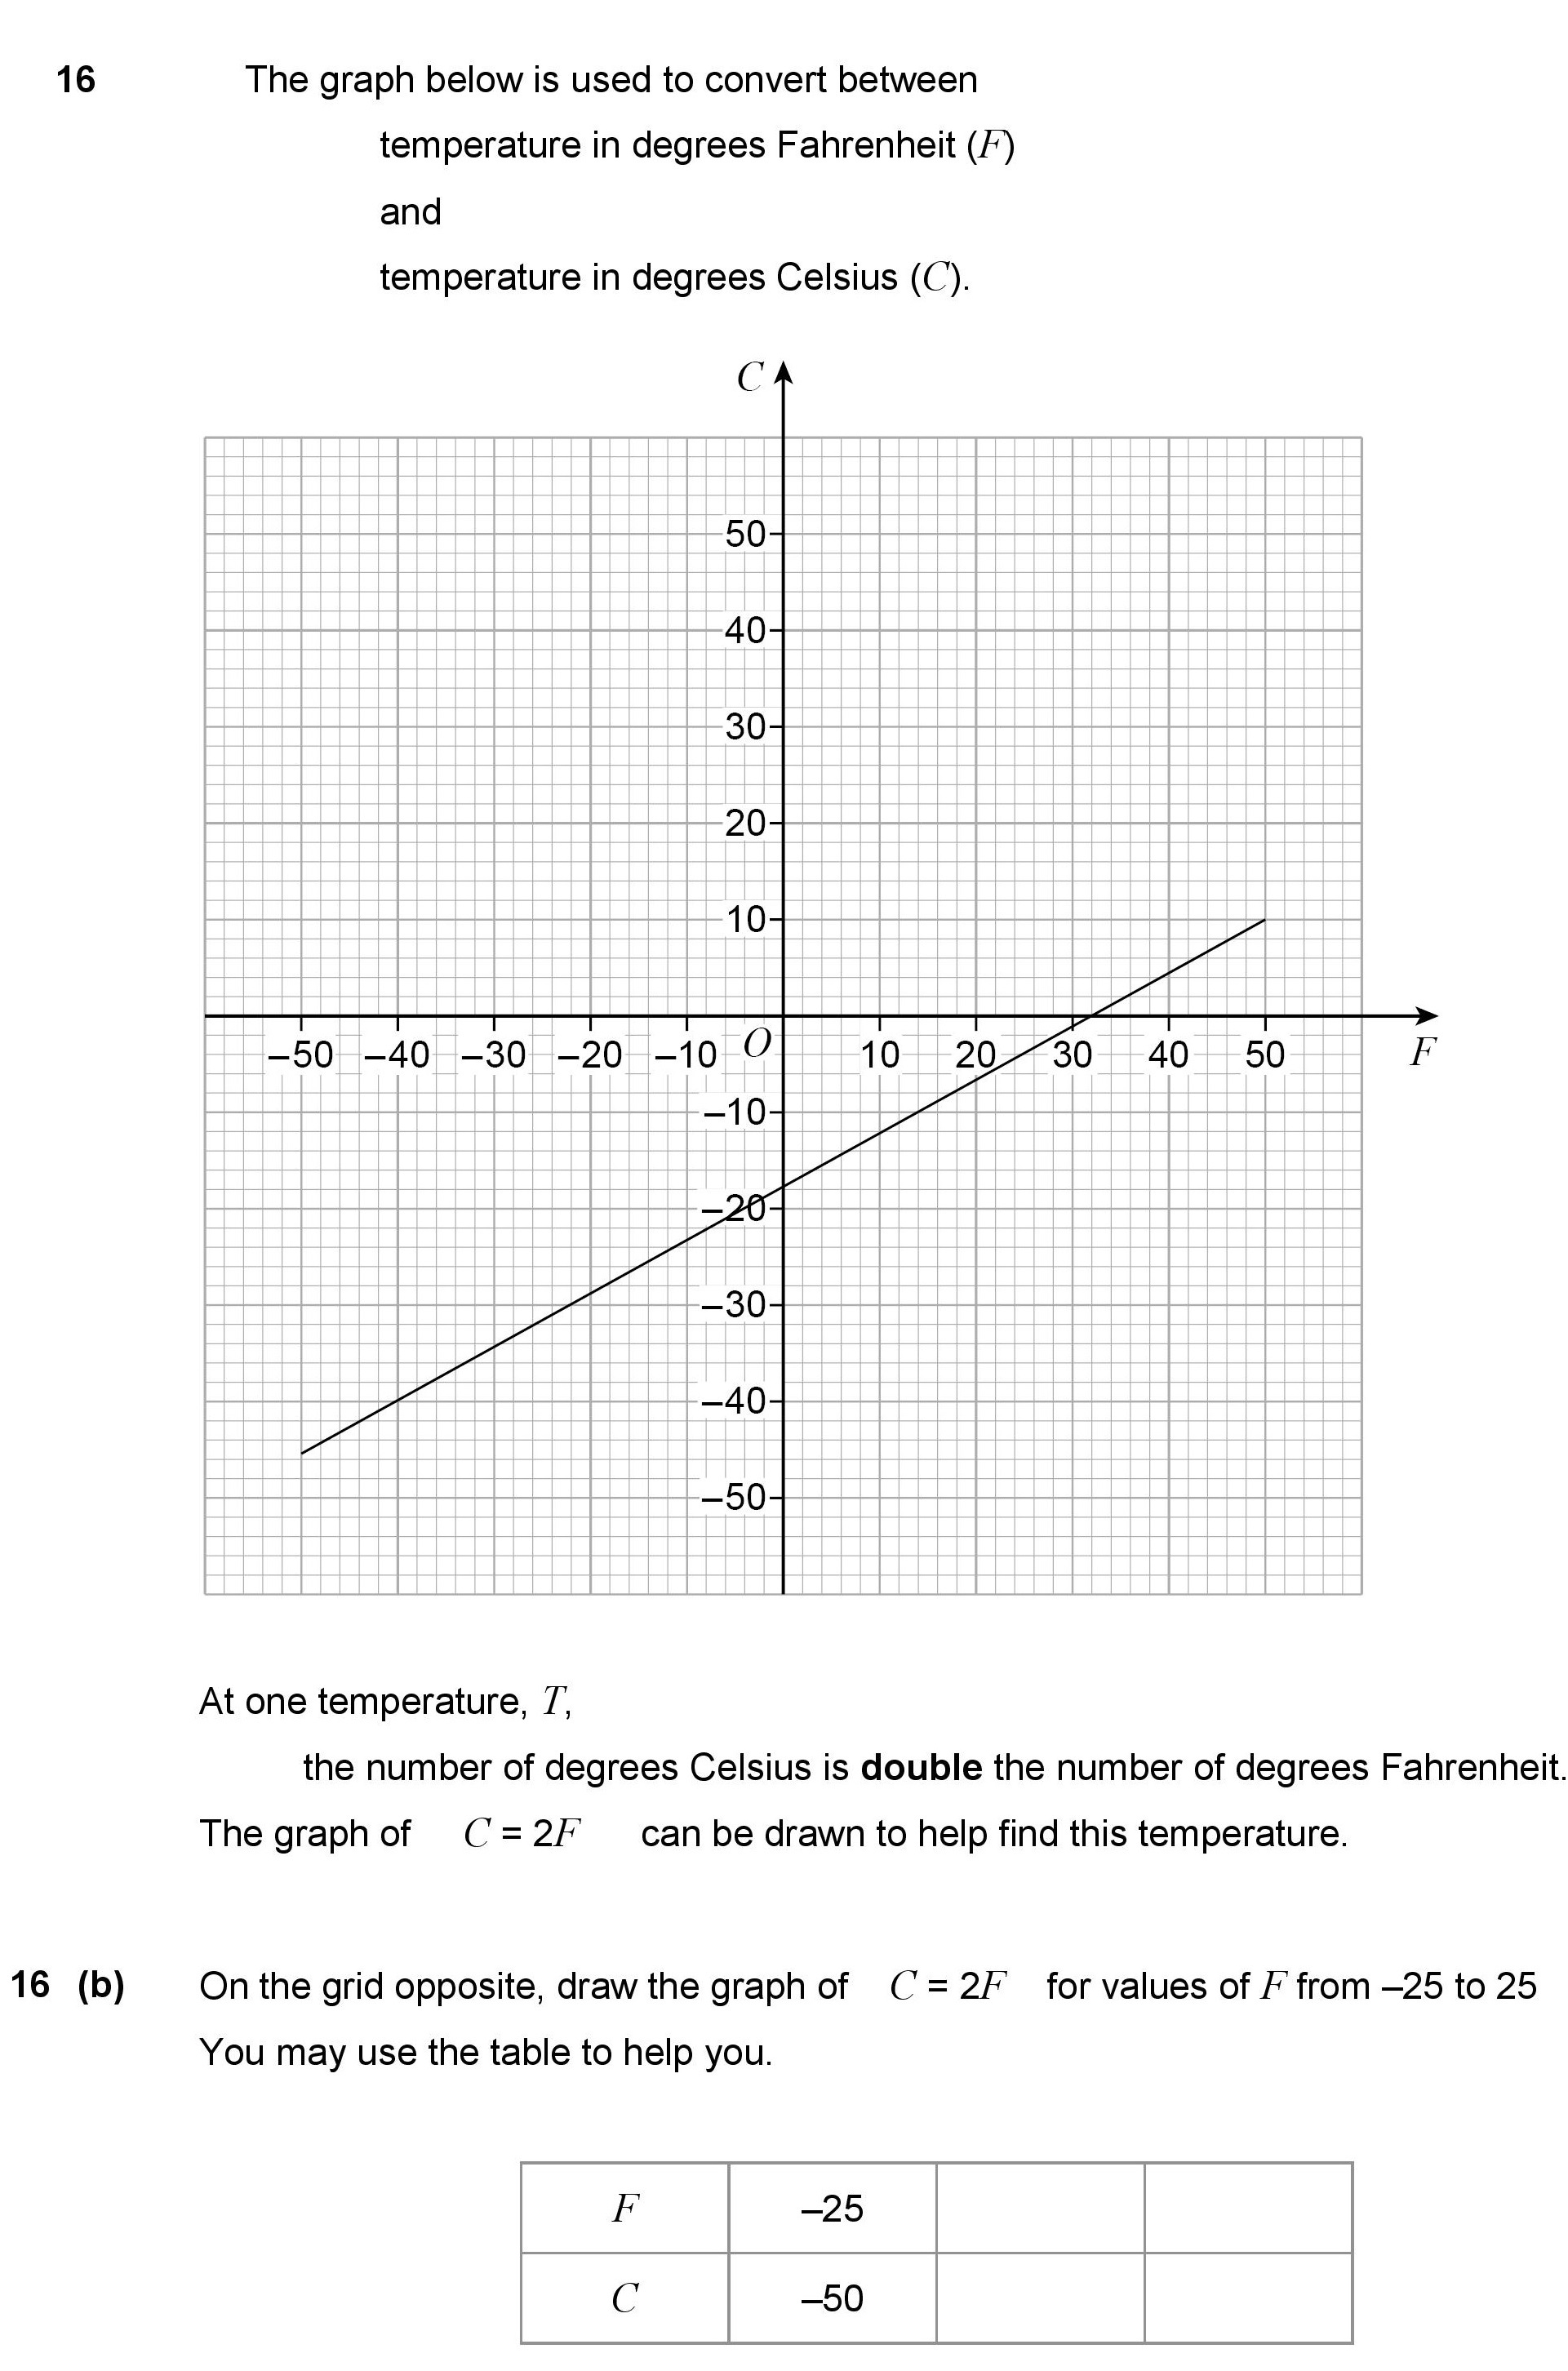
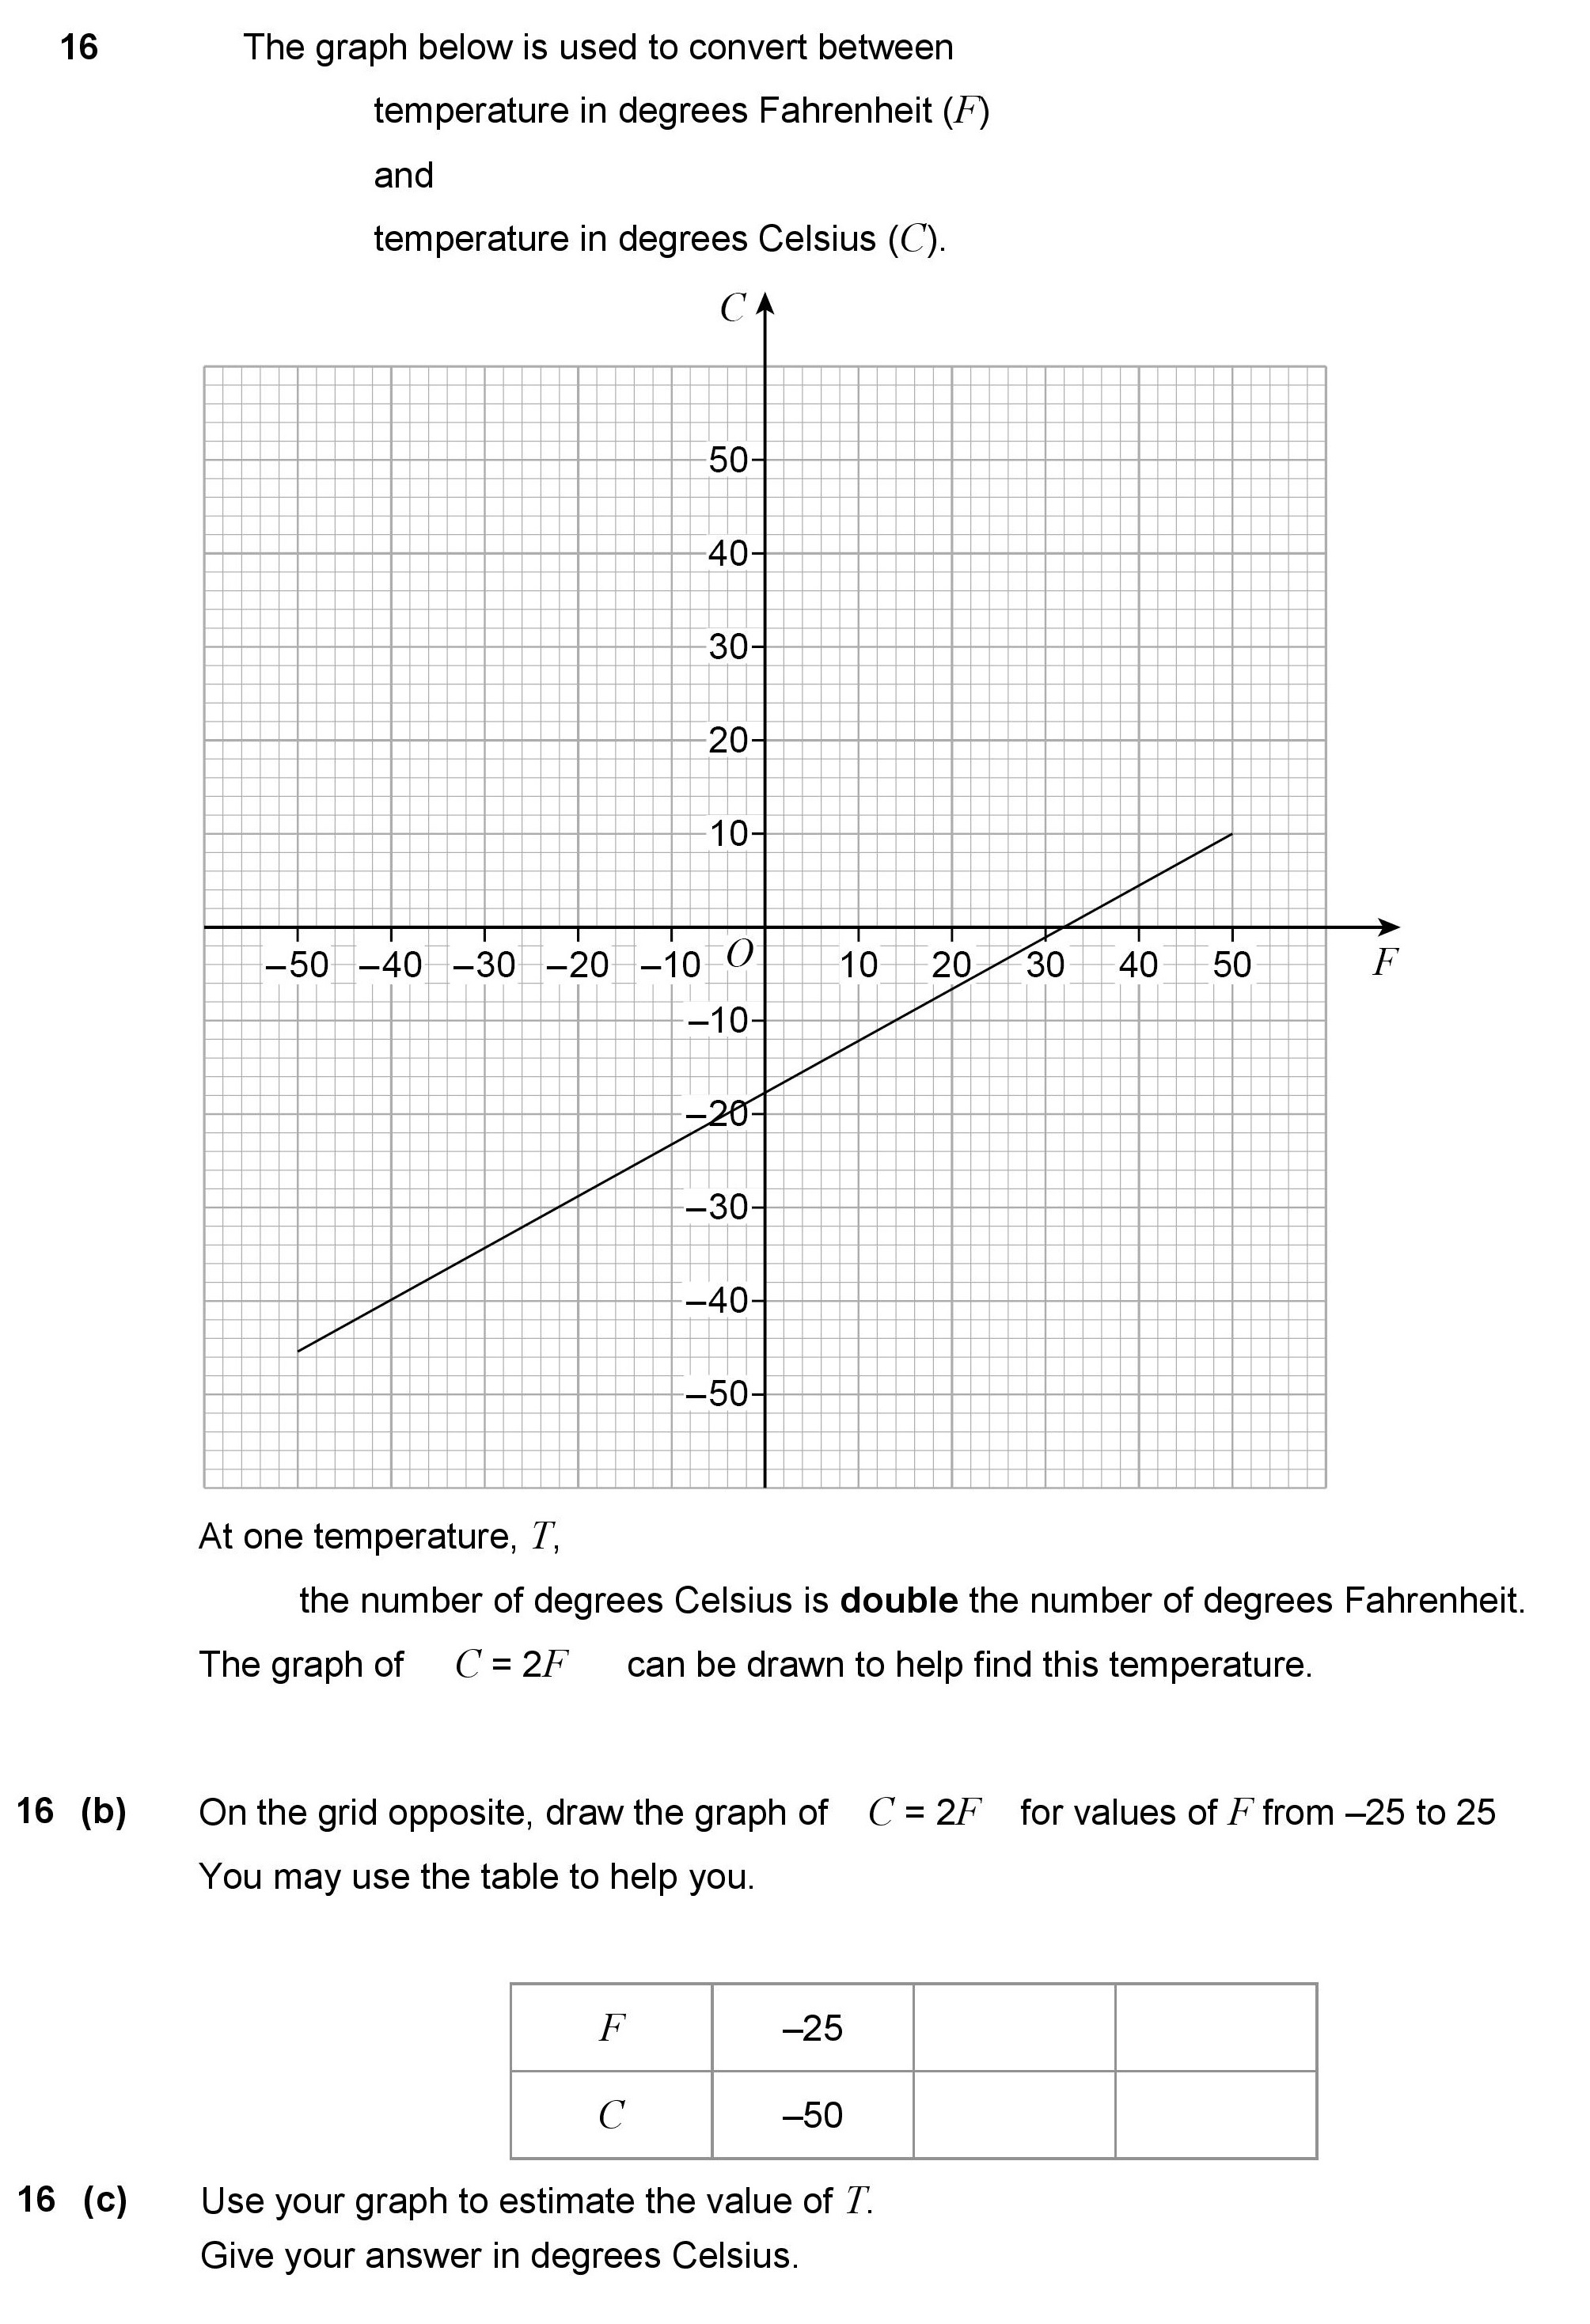
| Conversion Graphs | 1 | 1 | 1.5 | 0.33 | 1.17 | |
| Draw Straight Line in Context | 2 | 2 | 0.5 | 0.19 | 0.31 | |
| Intersection of Straight Line Graphs | 2 | 2 | 0.75 | 0.03 | 0.72 | |
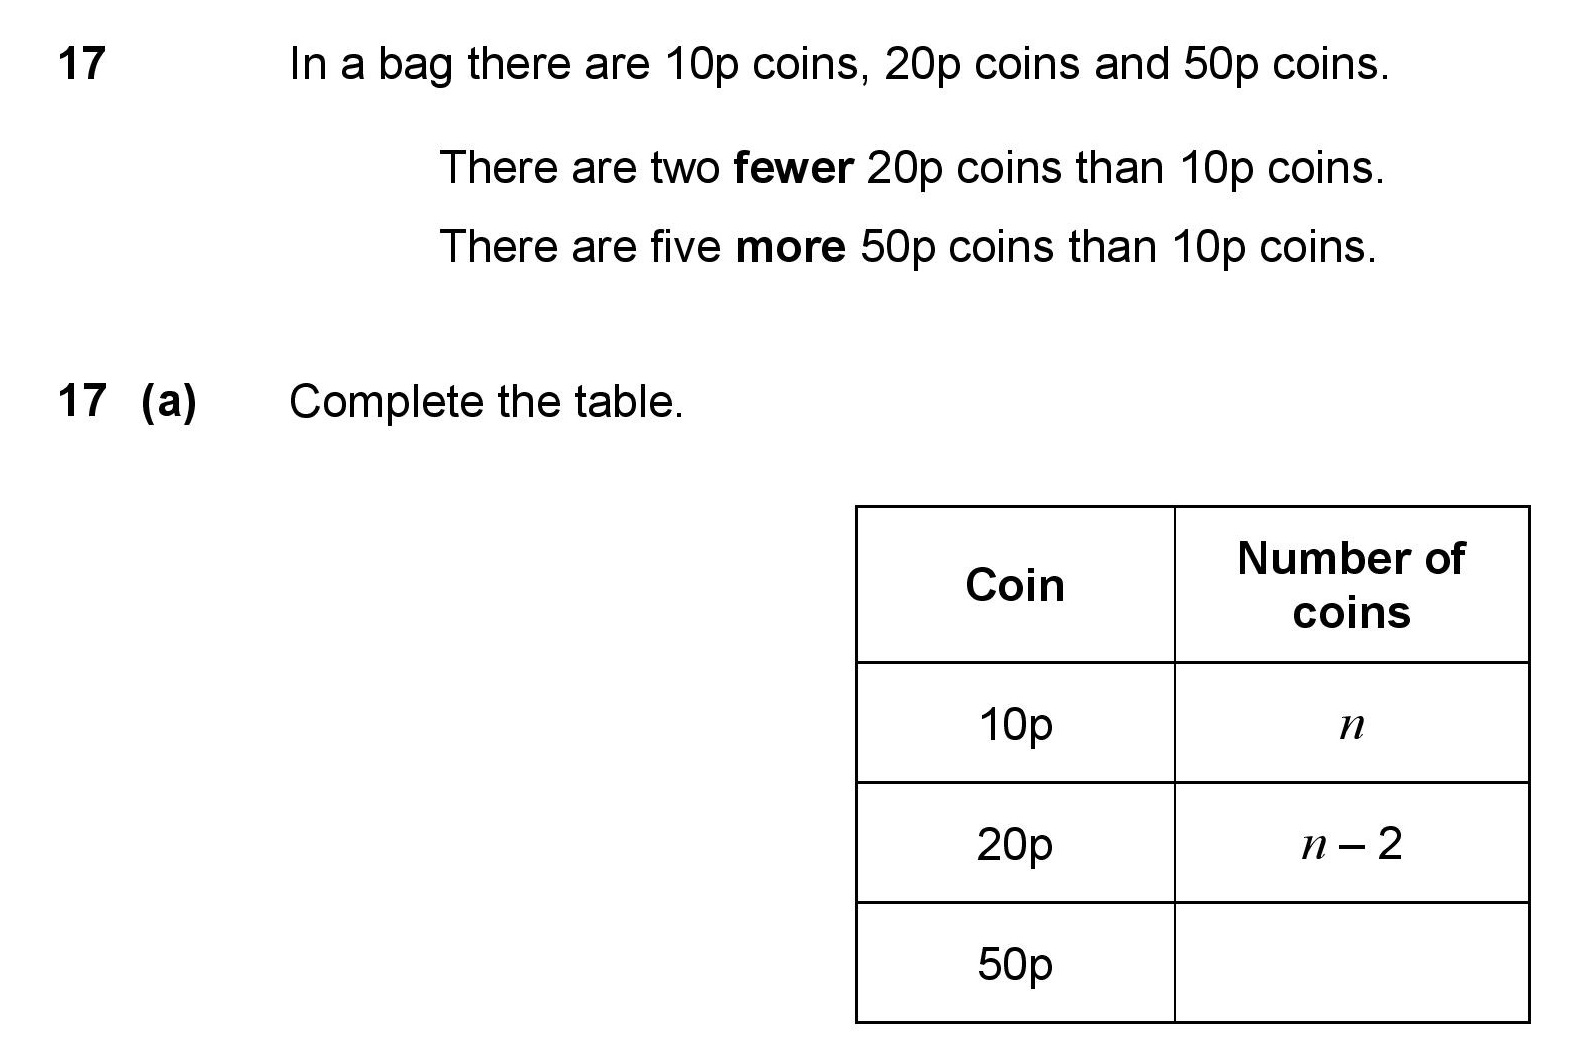
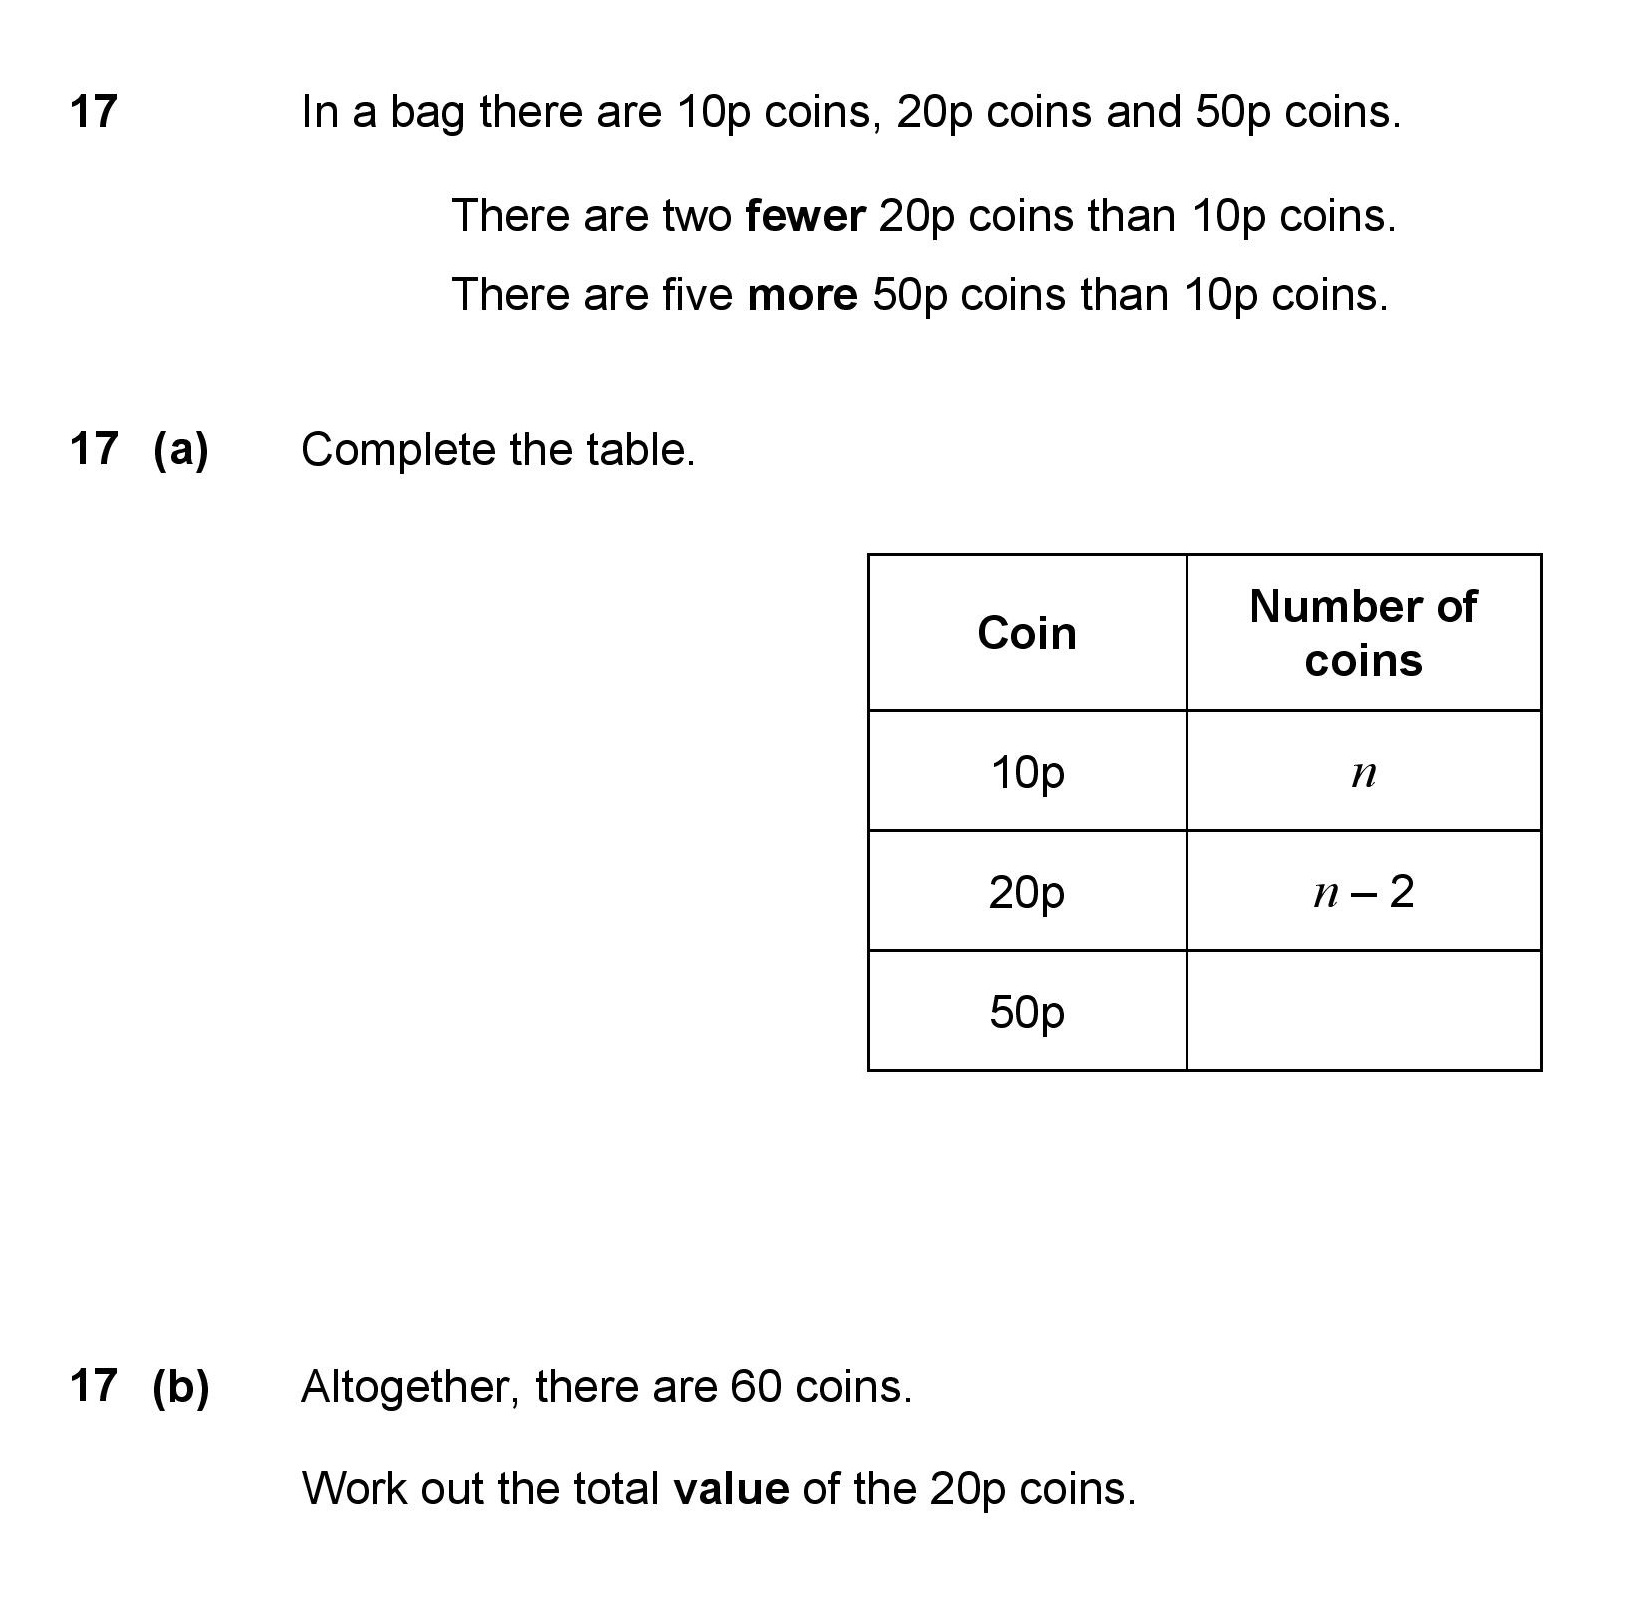
| Algebraic Expressions Worded Problems | 1 | 1 | 1 | 0.56 | 0.44 | |
| Forming equations from worded questions | 1 | 4 | 0.38 | 0.14 | 0.24 | |
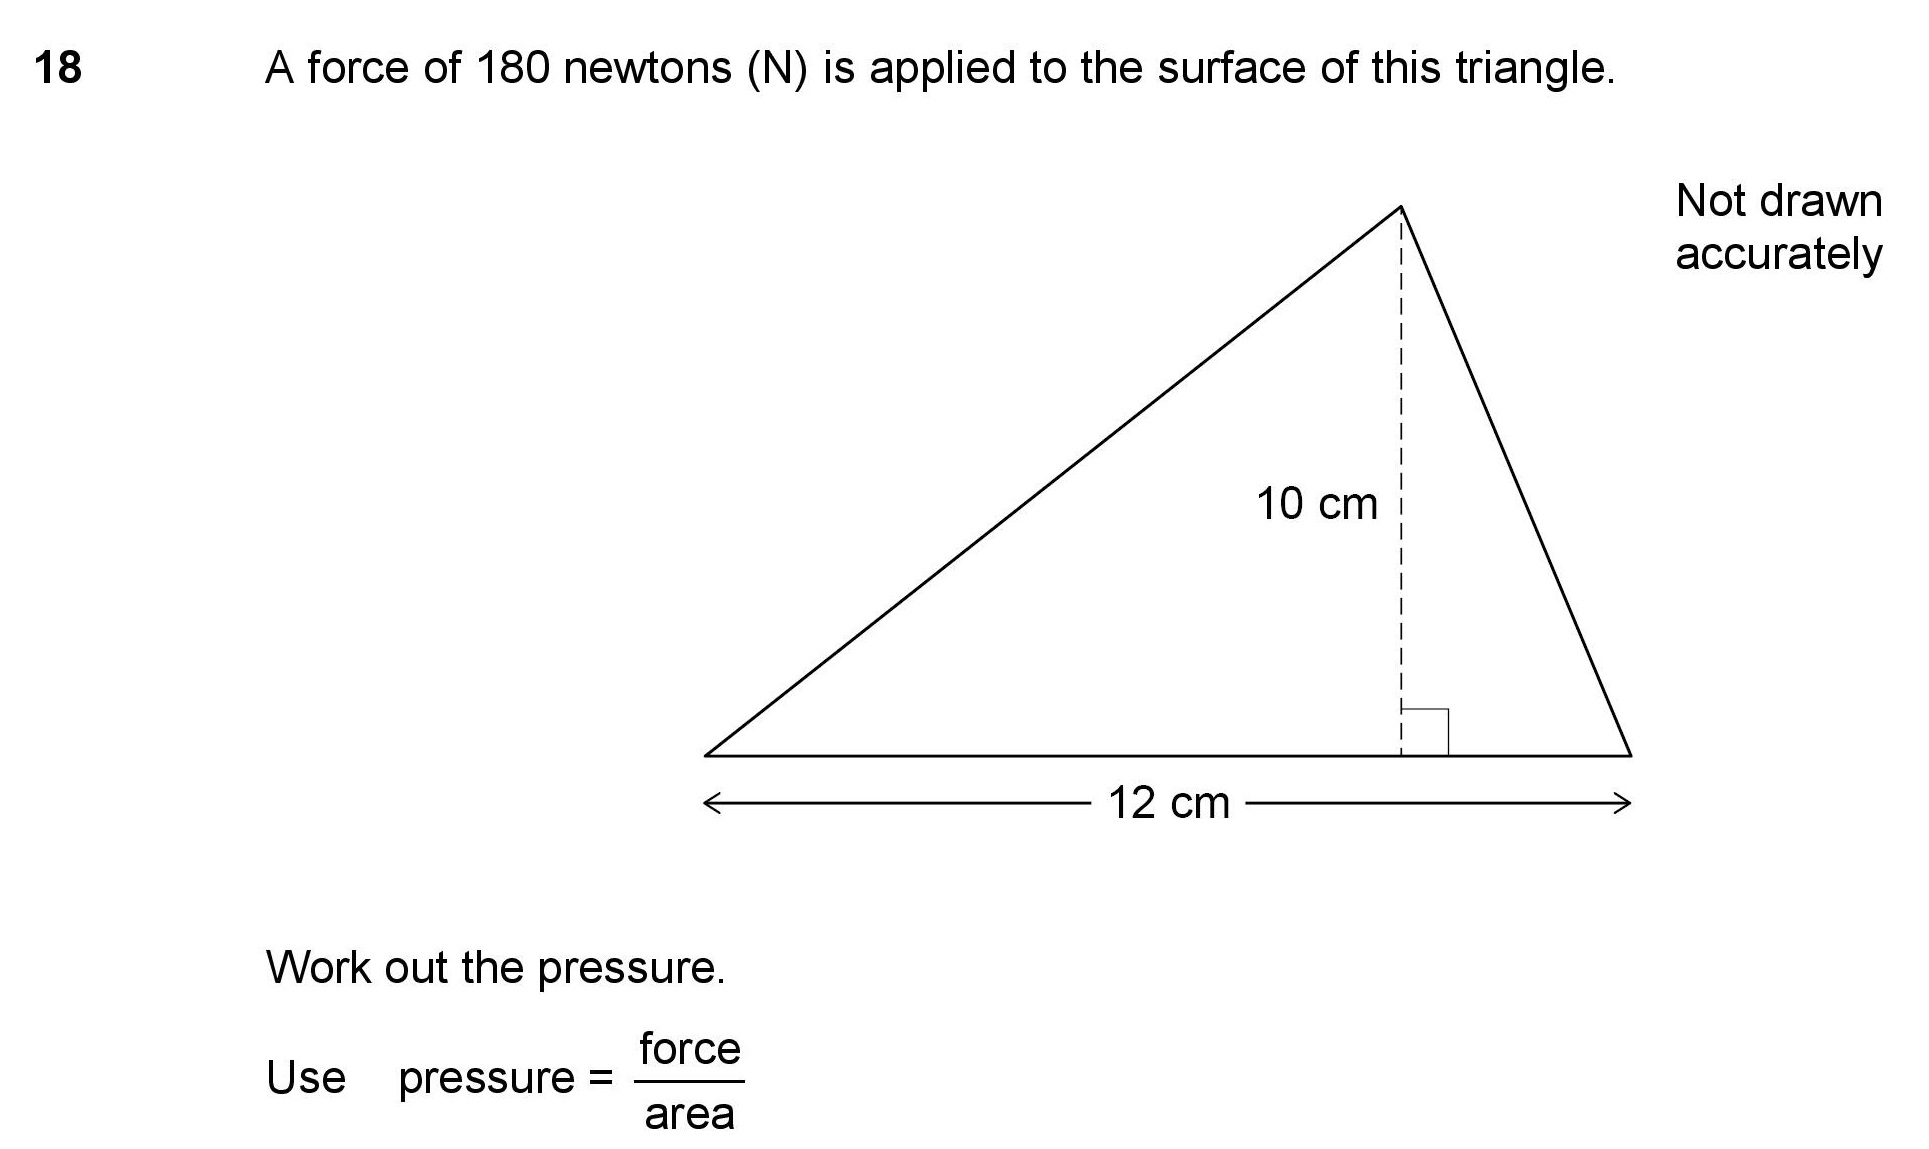
| Pressure and Density | 2 | 3 | 0.33 | 0.35 | -0.02 | |
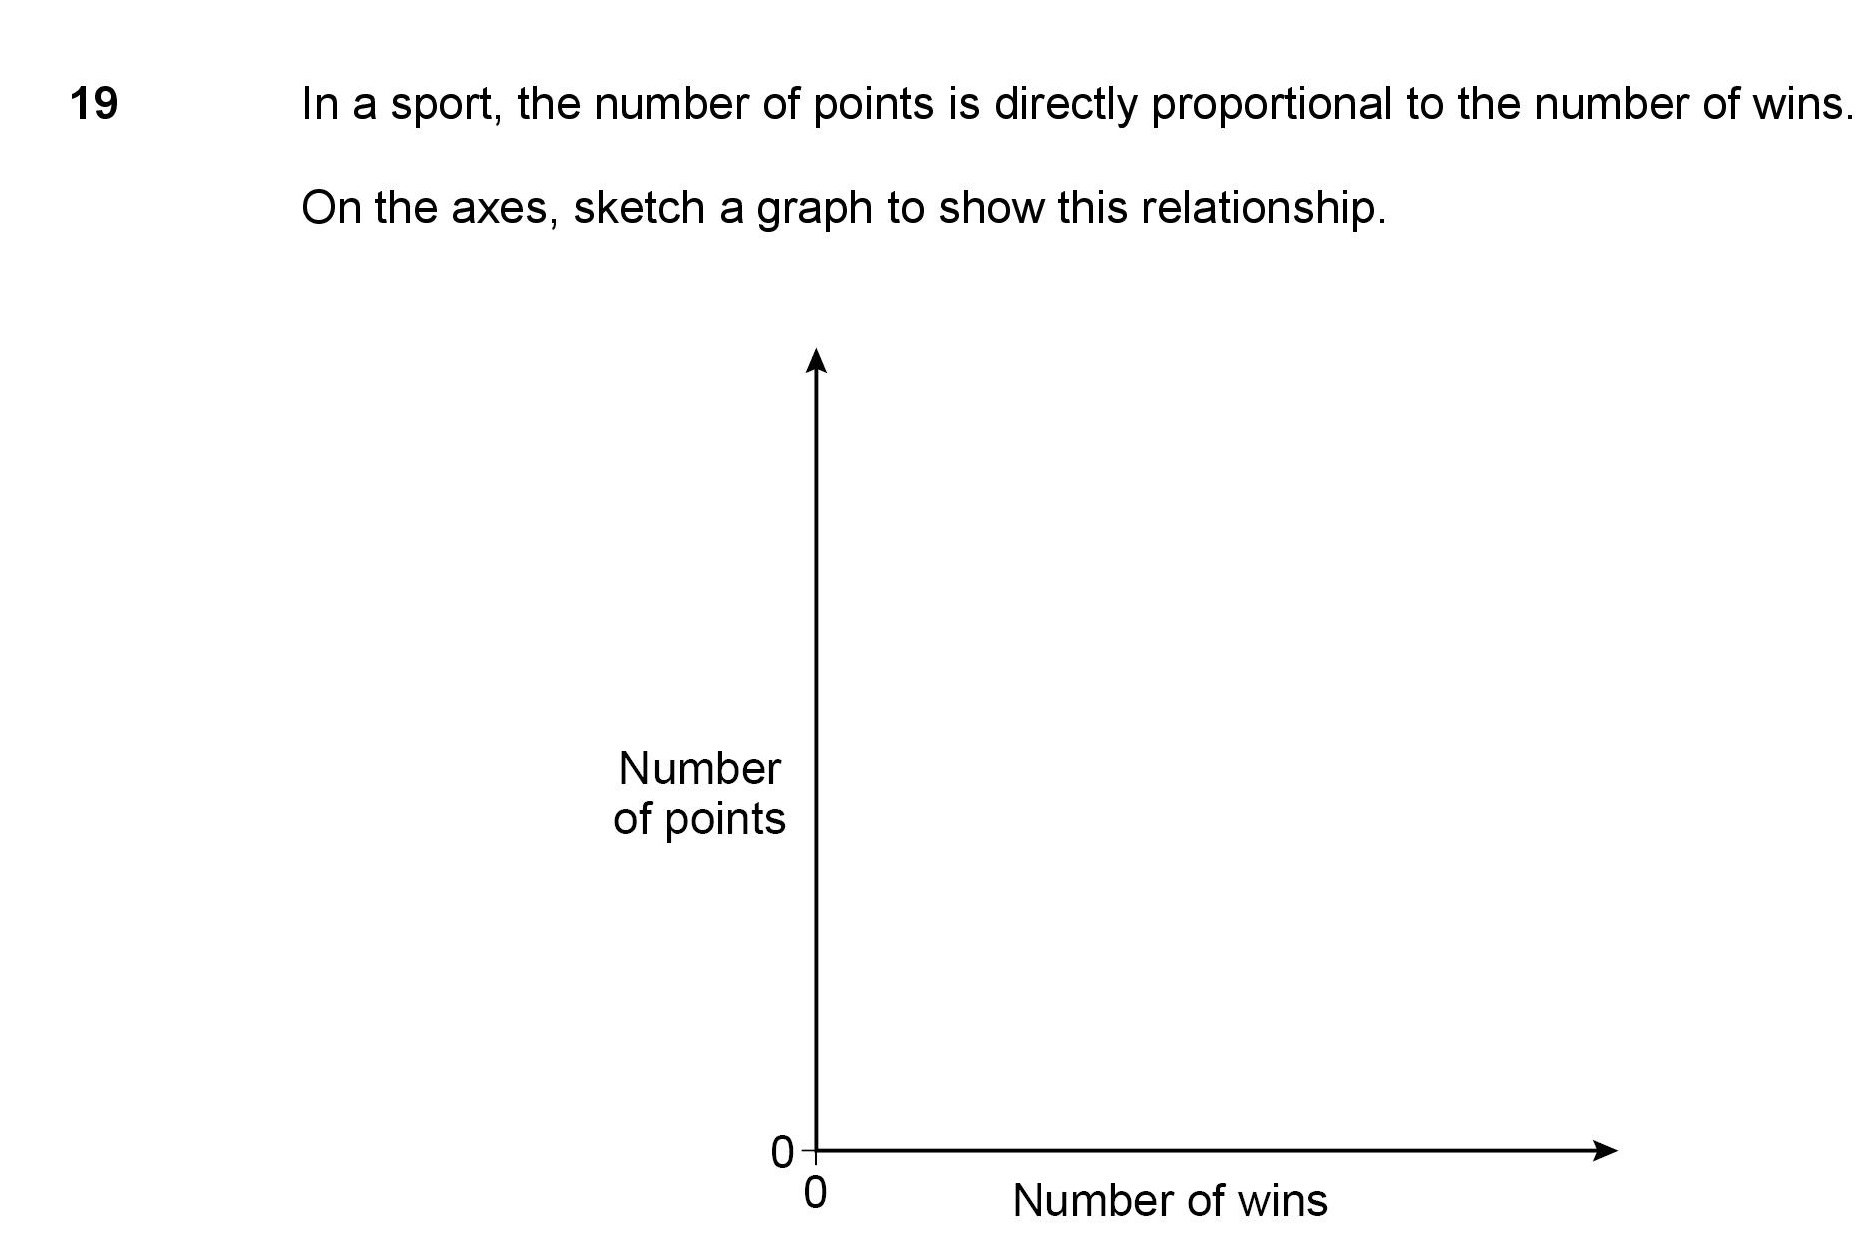
| Direct Proportion as a Graph | 2 | 1 | 1.5 | 0.47 | 1.03 | |
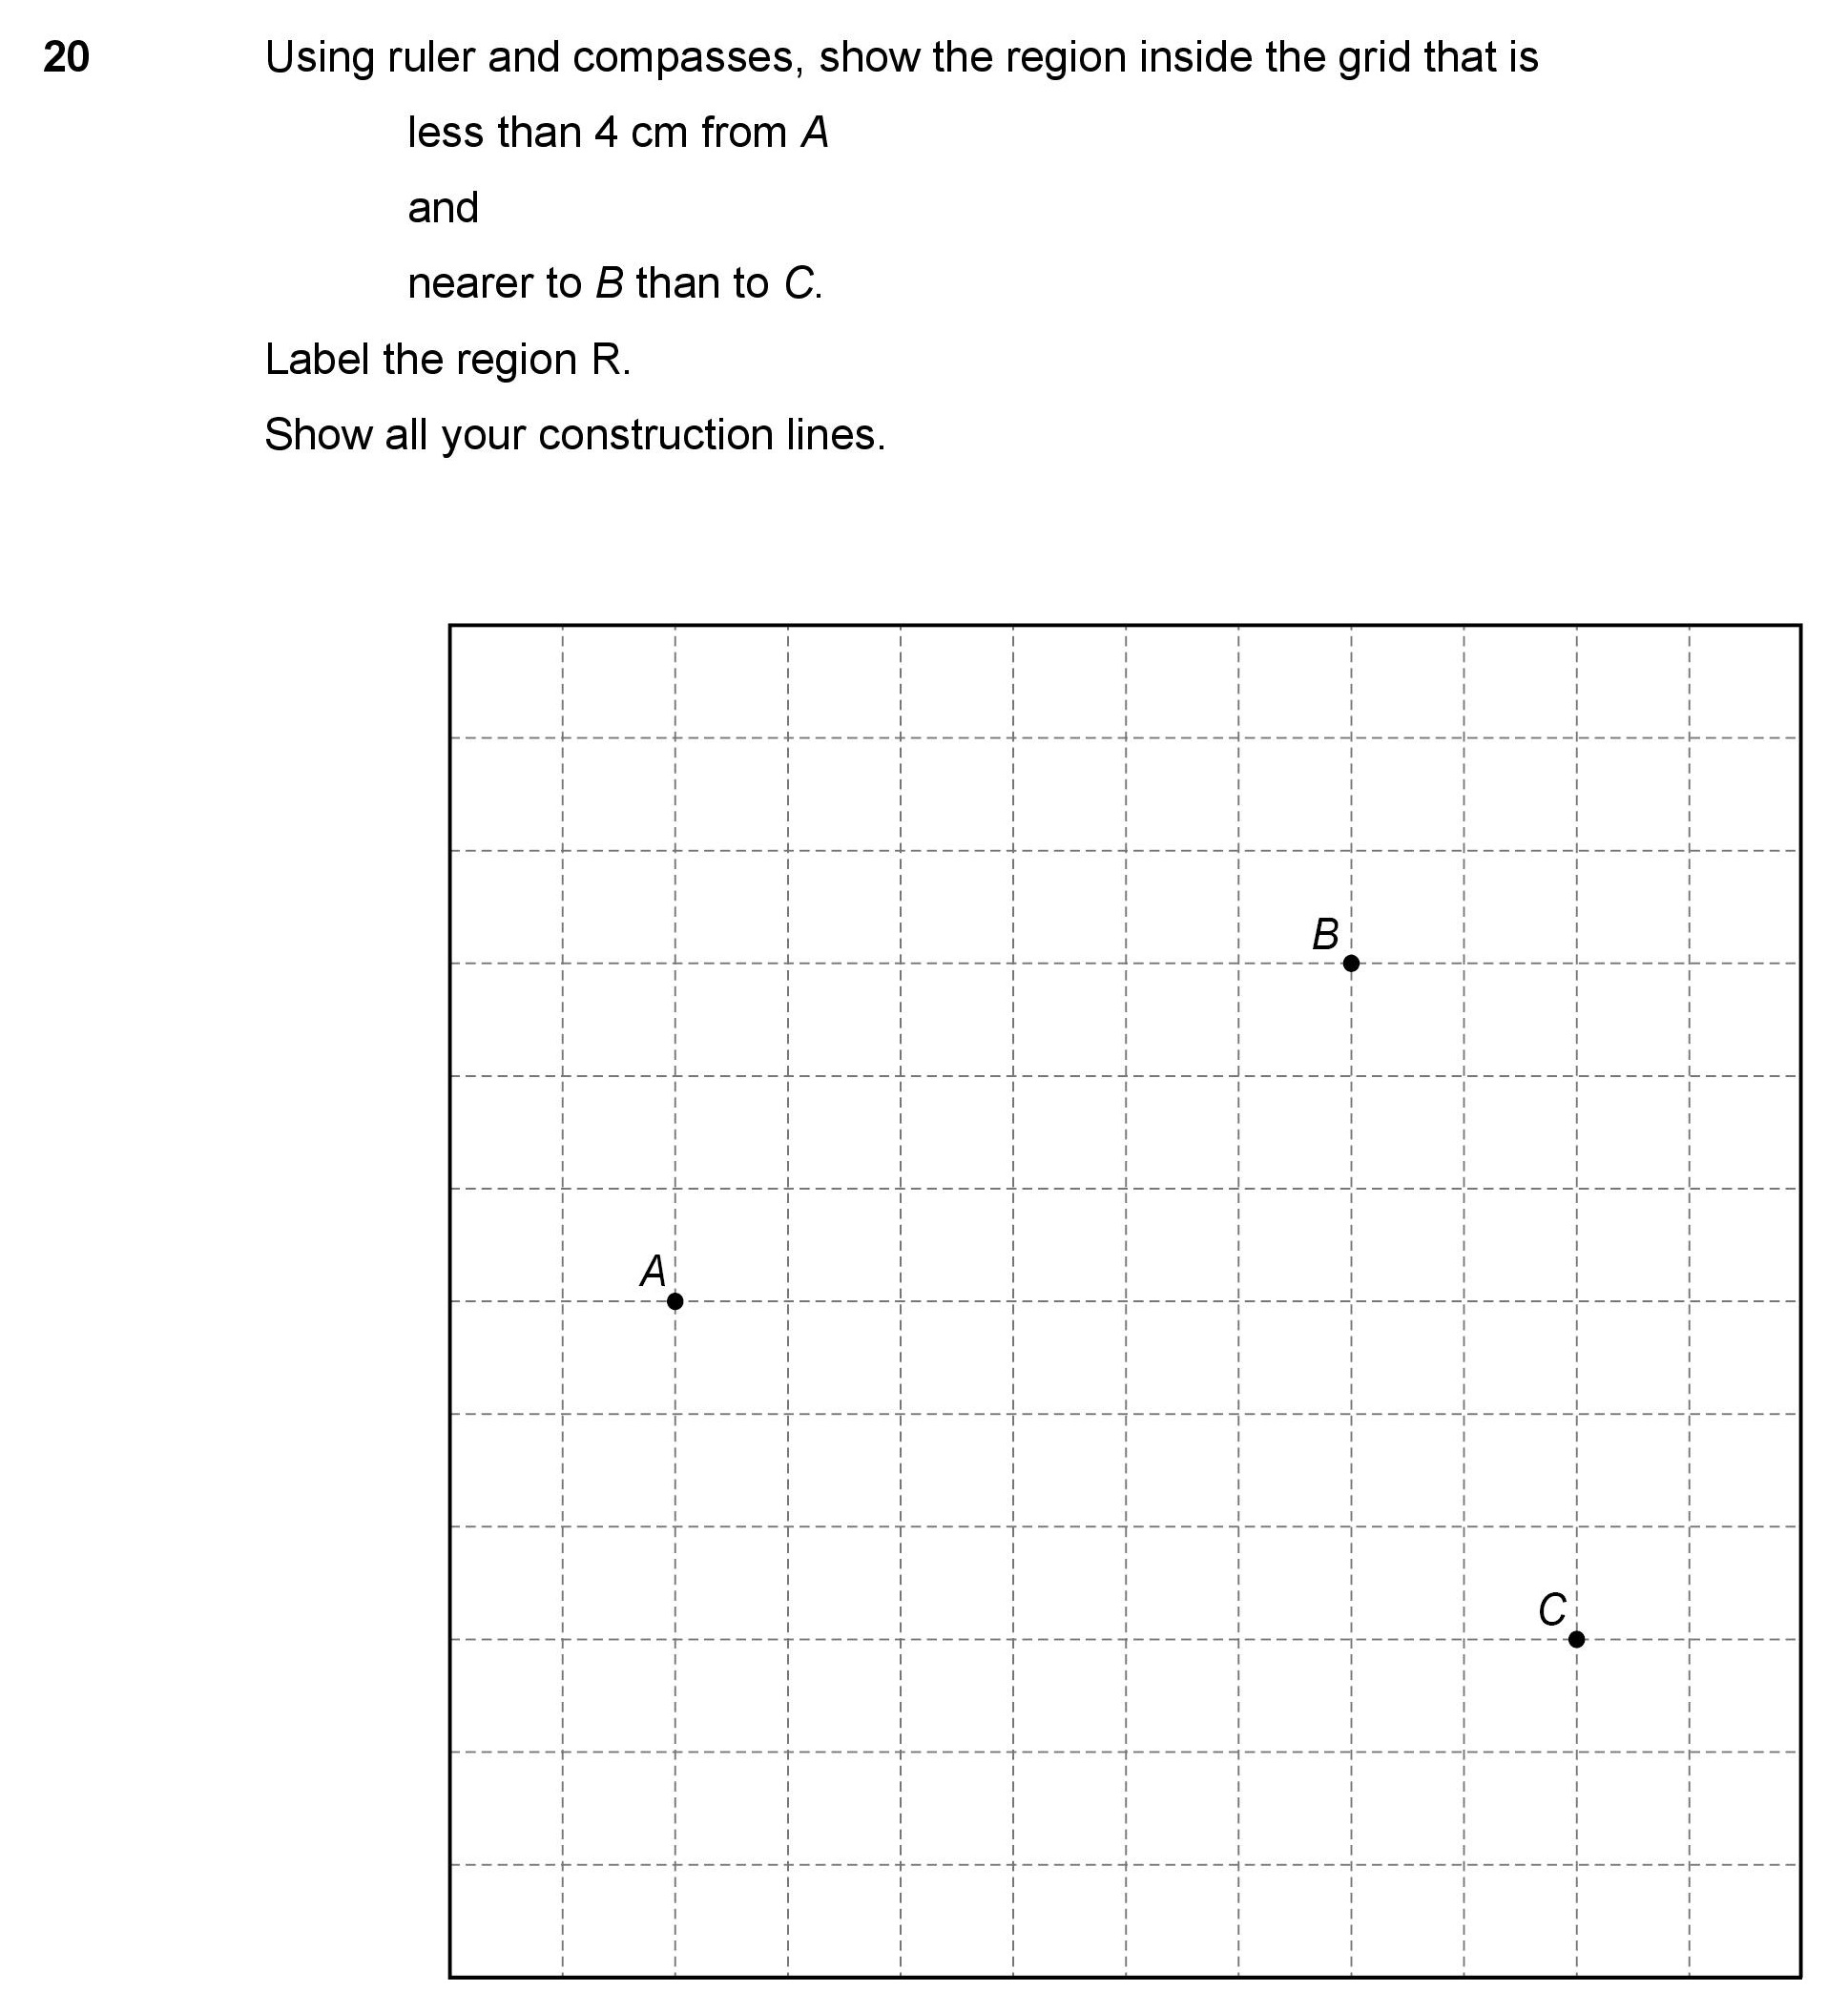
| Loci and Construction | 1 | 3 | 0.33 | 0.05 | 0.28 | |
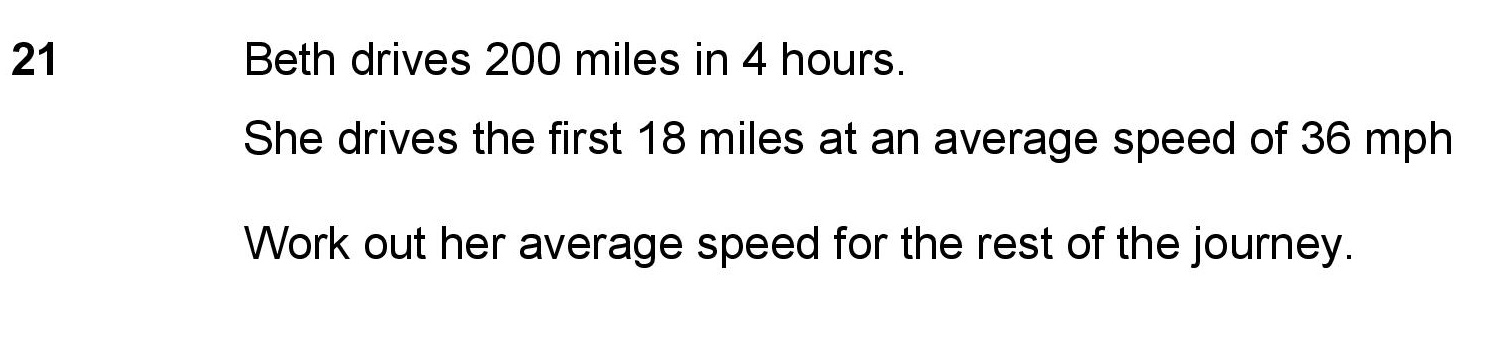
| Speed Problems | 1 | 3 | 0.5 | 0.11 | 0.39 | |
| Ratio and Shape Problems | 2 | 4 | 0.25 | 0.1 | 0.15 | |
| Describe a Frequency Table | 1 | 1 | 1.5 | 0.27 | 1.23 | |
| Averages from Frequency Tables | 1 | 2 | 0.5 | 0.07 | 0.43 | |
| Use a Frequency Table | 1 | 2 | 0.75 | 0.11 | 0.64 | |
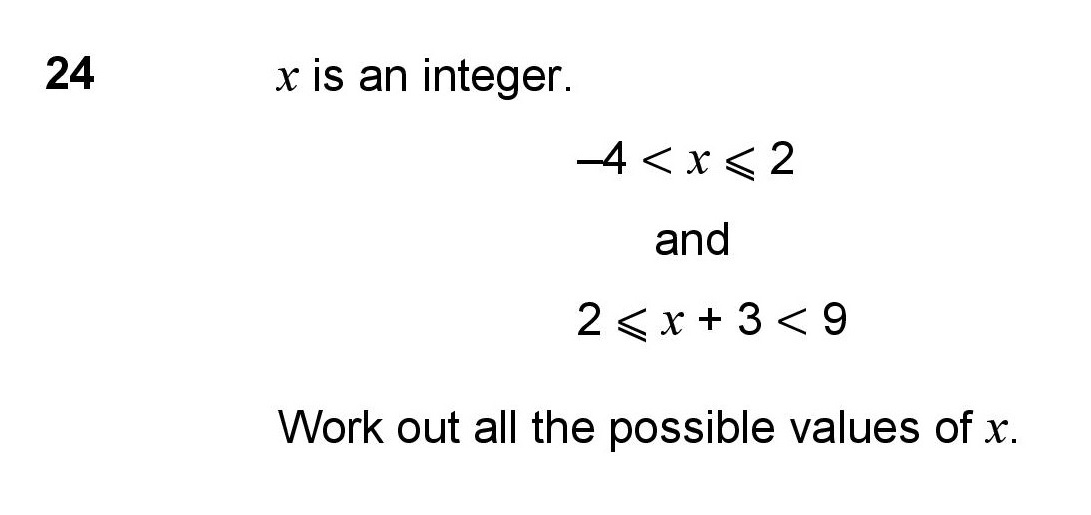
| Inequalities | 2 | 3 | 0.33 | 0.07 | 0.26 | |
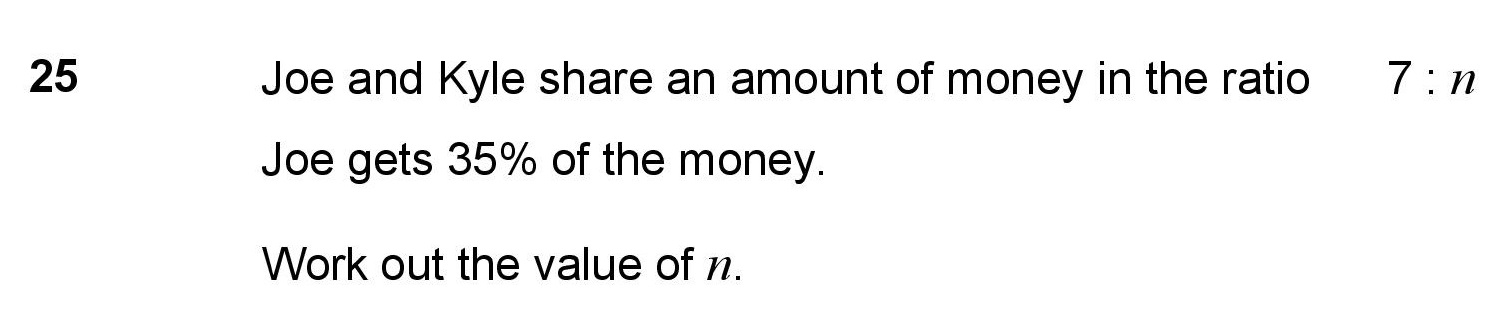
| Equivalence of Ratio and Percentage | 2 | 2 | 0.75 | 0.17 | 0.58 | |
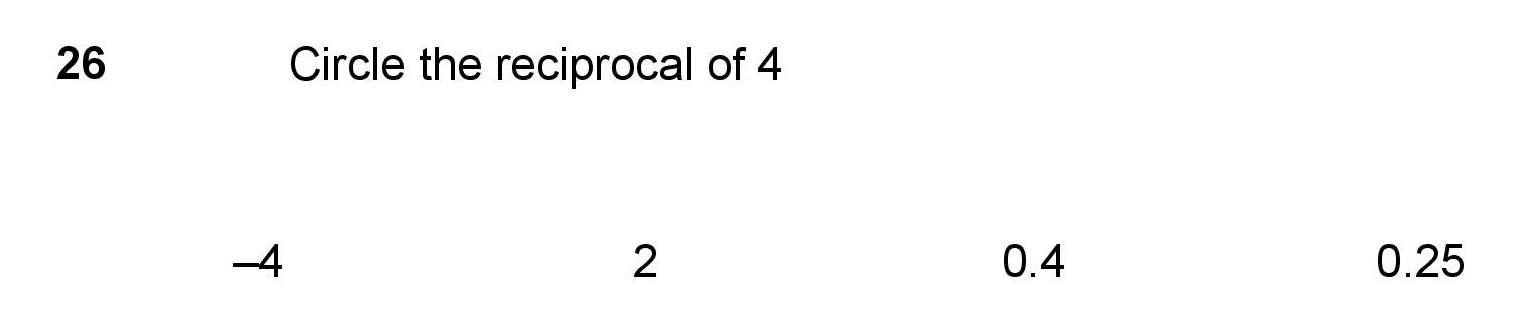
| Reciprocals and Powers of 0 and to 1 | 1 | 1 | 1 | 0.21 | 0.79 | |
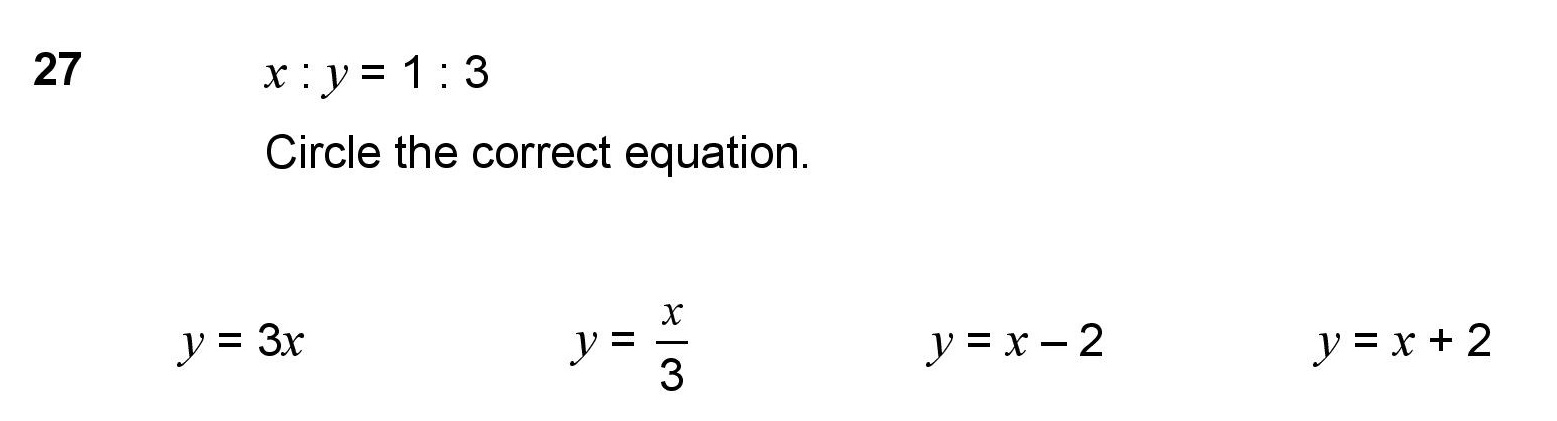
| Ratio and Algebra | 2 | 1 | 1.5 | 0.29 | 1.21 | |
| Sequences | 1 | 2 | 0.5 | 0.3 | 0.2 |