Einstein QLA: Its all relative!
Average marks for your class or department are compared to all the other pinpoint schools
who have uploaded for this test.
Average marks for your class or department are compared to all the other pinpoint schools
who have uploaded for this test.
| Question | Topic | AO Strand | Max Mark | SetA Average per mark | Pinpoint Average | Average Difference |
|---|---|---|---|---|---|---|
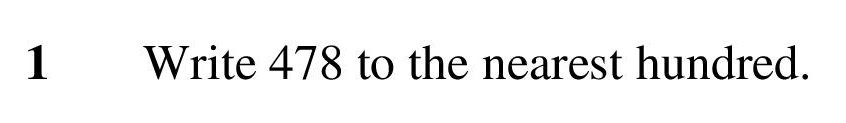
| Rounding to the nearest 10, 100 and 1000 | 1 | 1 | 1 | 0.95 | 0.05 | |
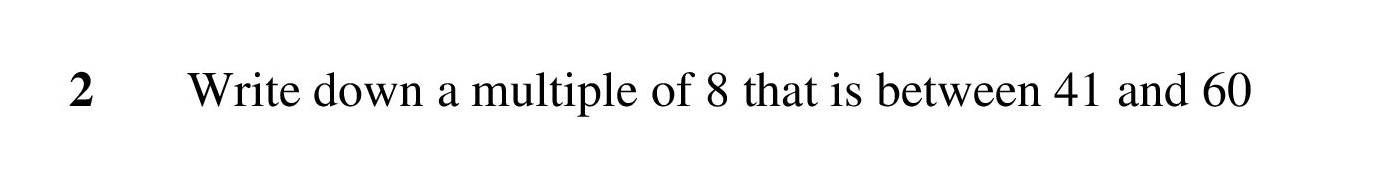
| Multiples | 1 | 1 | 0.5 | 0.89 | -0.39 | |
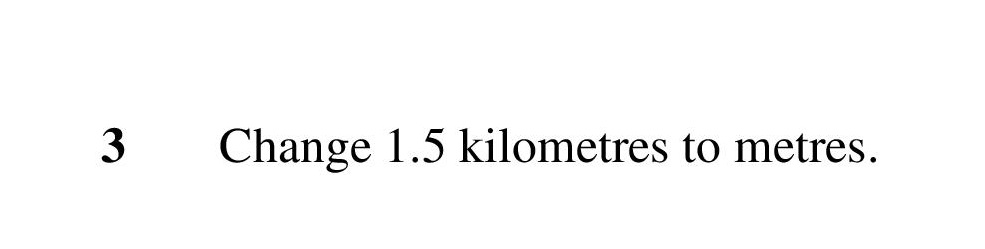
| Metric Conversions | 1 | 1 | 1 | 0.62 | 0.38 | |
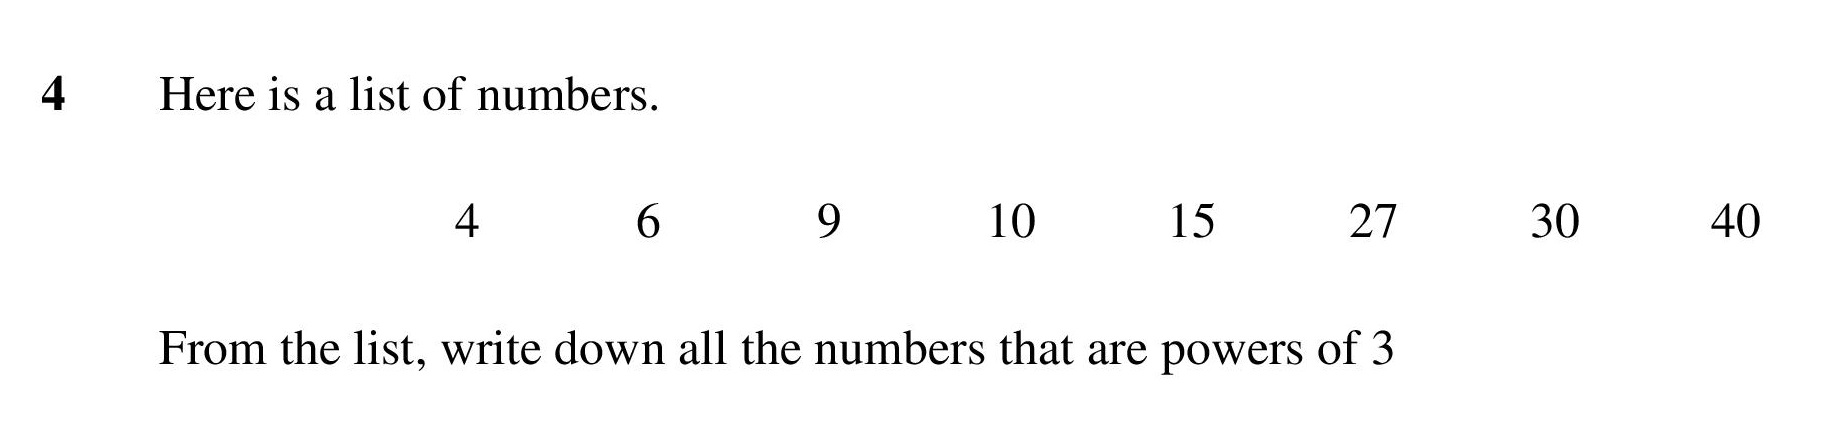
| Simple Positive integer powers and roots | 1 | 1 | 0.5 | 0.33 | 0.17 | |
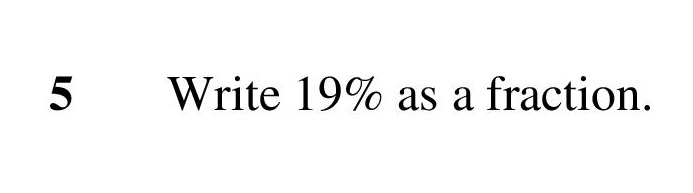
| Fractions, Decimals and % | 1 | 1 | 1 | 0.86 | 0.14 | |
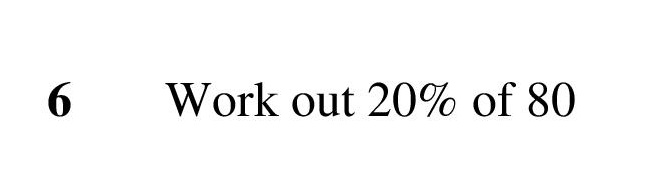
| Percentage of an amount | 1 | 2 | 0.5 | 0.76 | -0.26 | |
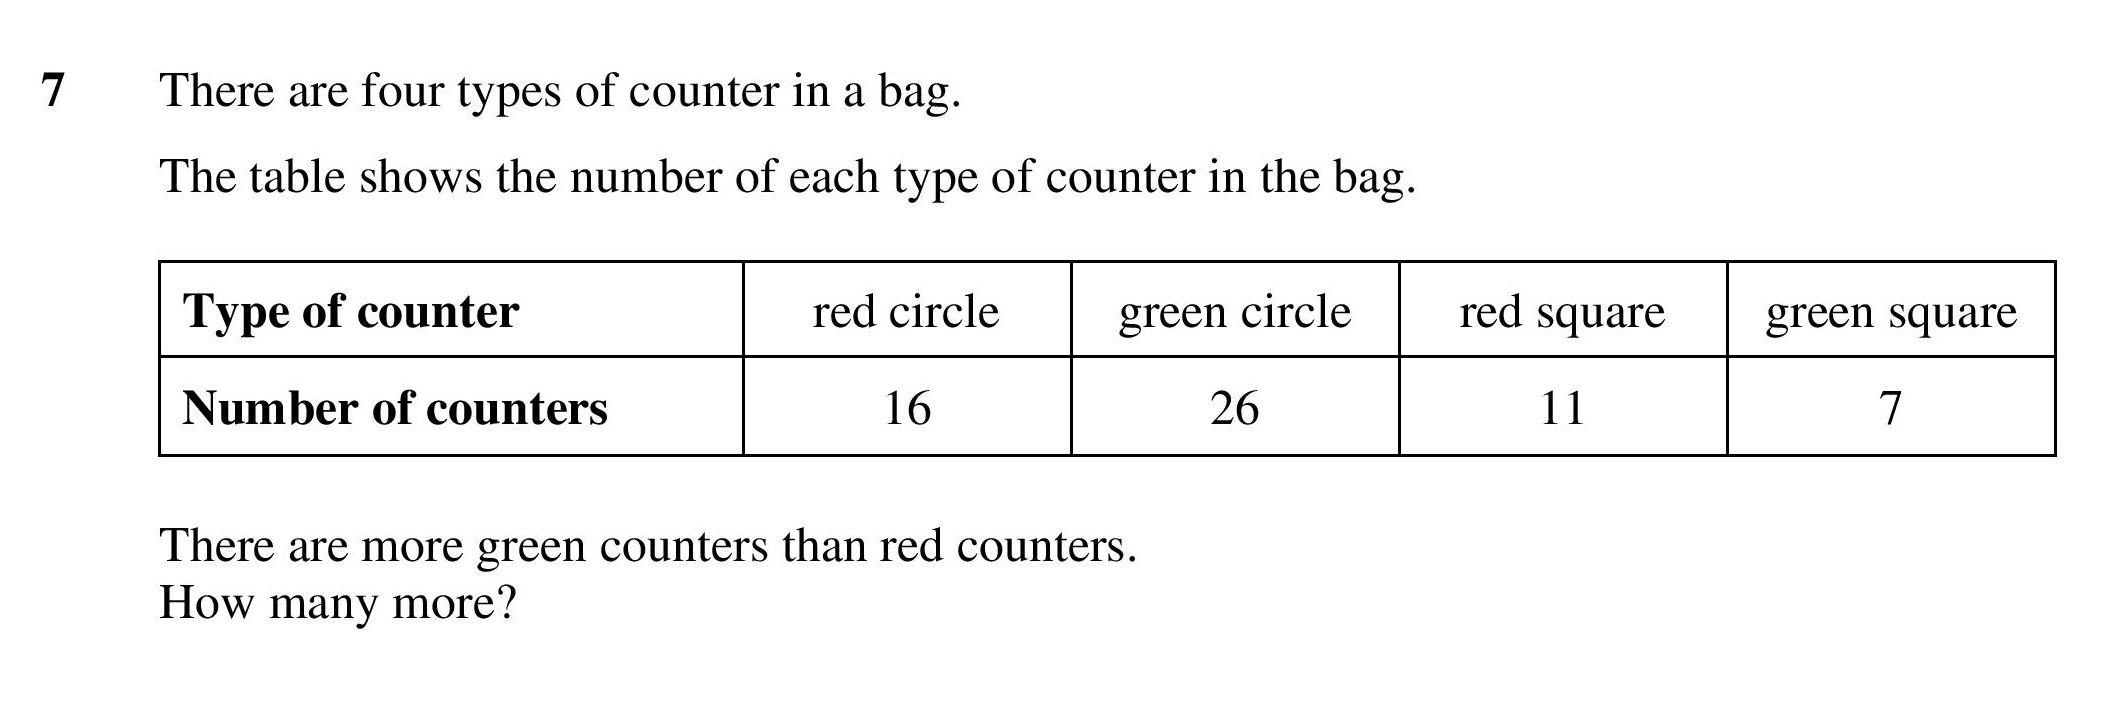
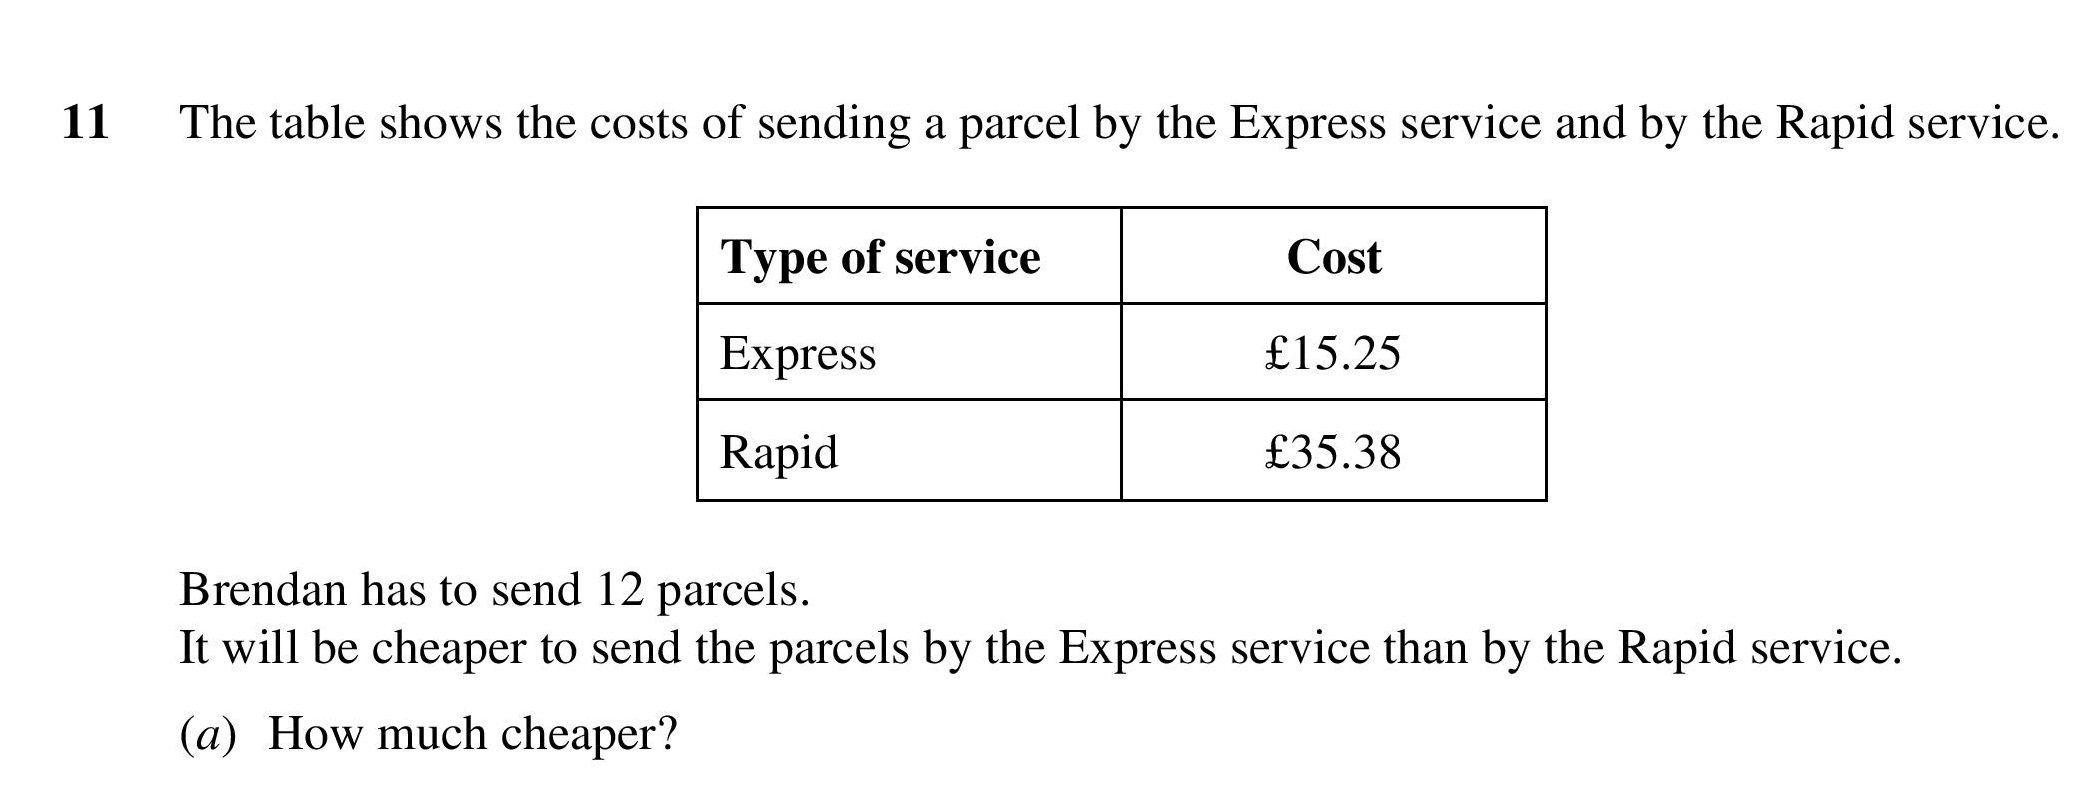
| Calculations From Tables | 1 | 2 | 0.75 | 0.54 | 0.21 | |
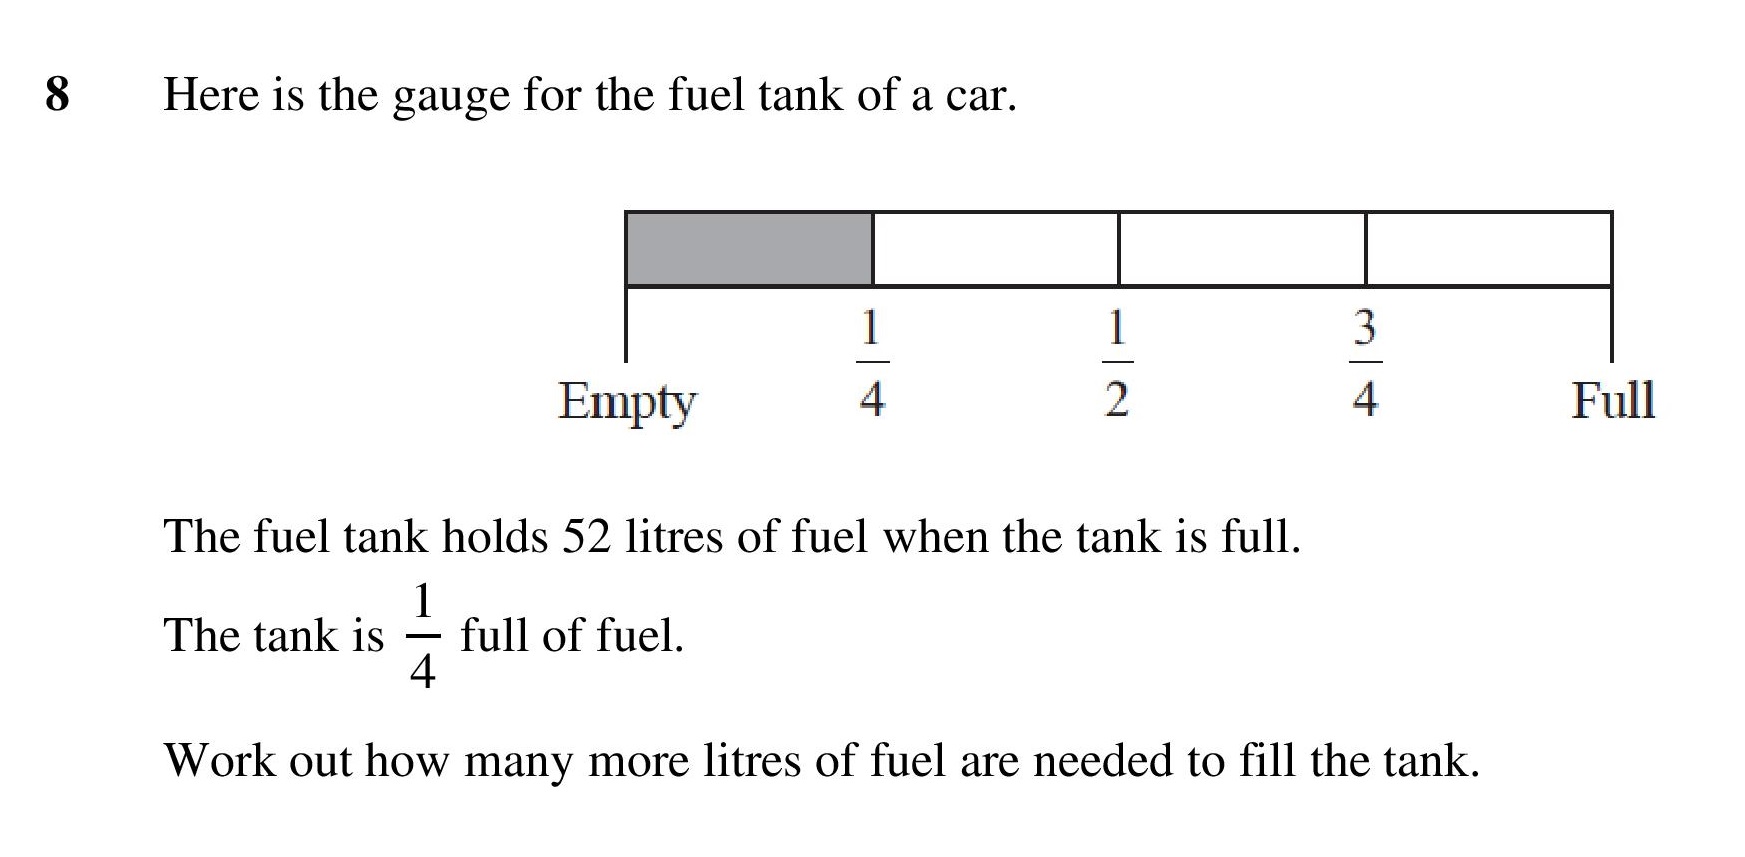
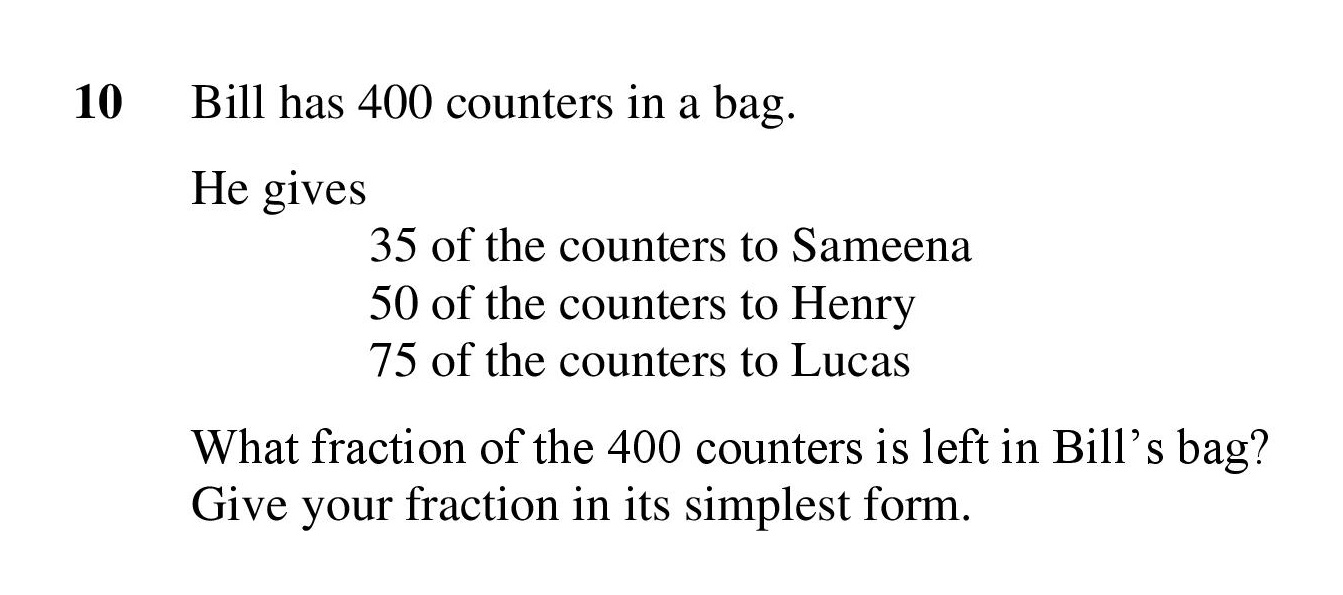
| Fractions of an Amount Worded | 1 | 3 | 0.33 | 0.67 | -0.34 | |
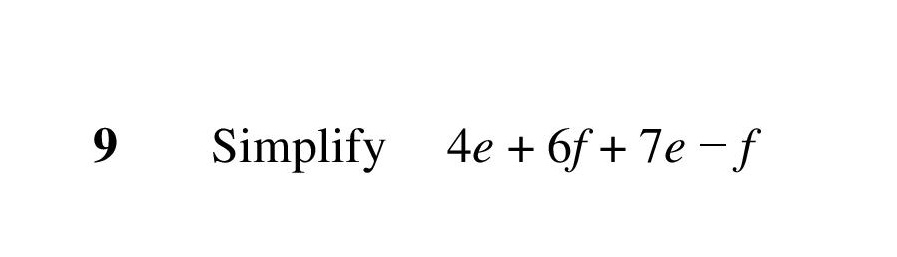
| Collecting Like Terms | 1 | 2 | 0.75 | 0.78 | -0.03 | |
| Equivalent Fractions | 1 | 3 | 0.33 | 0.67 | -0.34 | |
| Cost and Money Problems | 1 | 3 | 0.5 | 0.81 | -0.31 | |
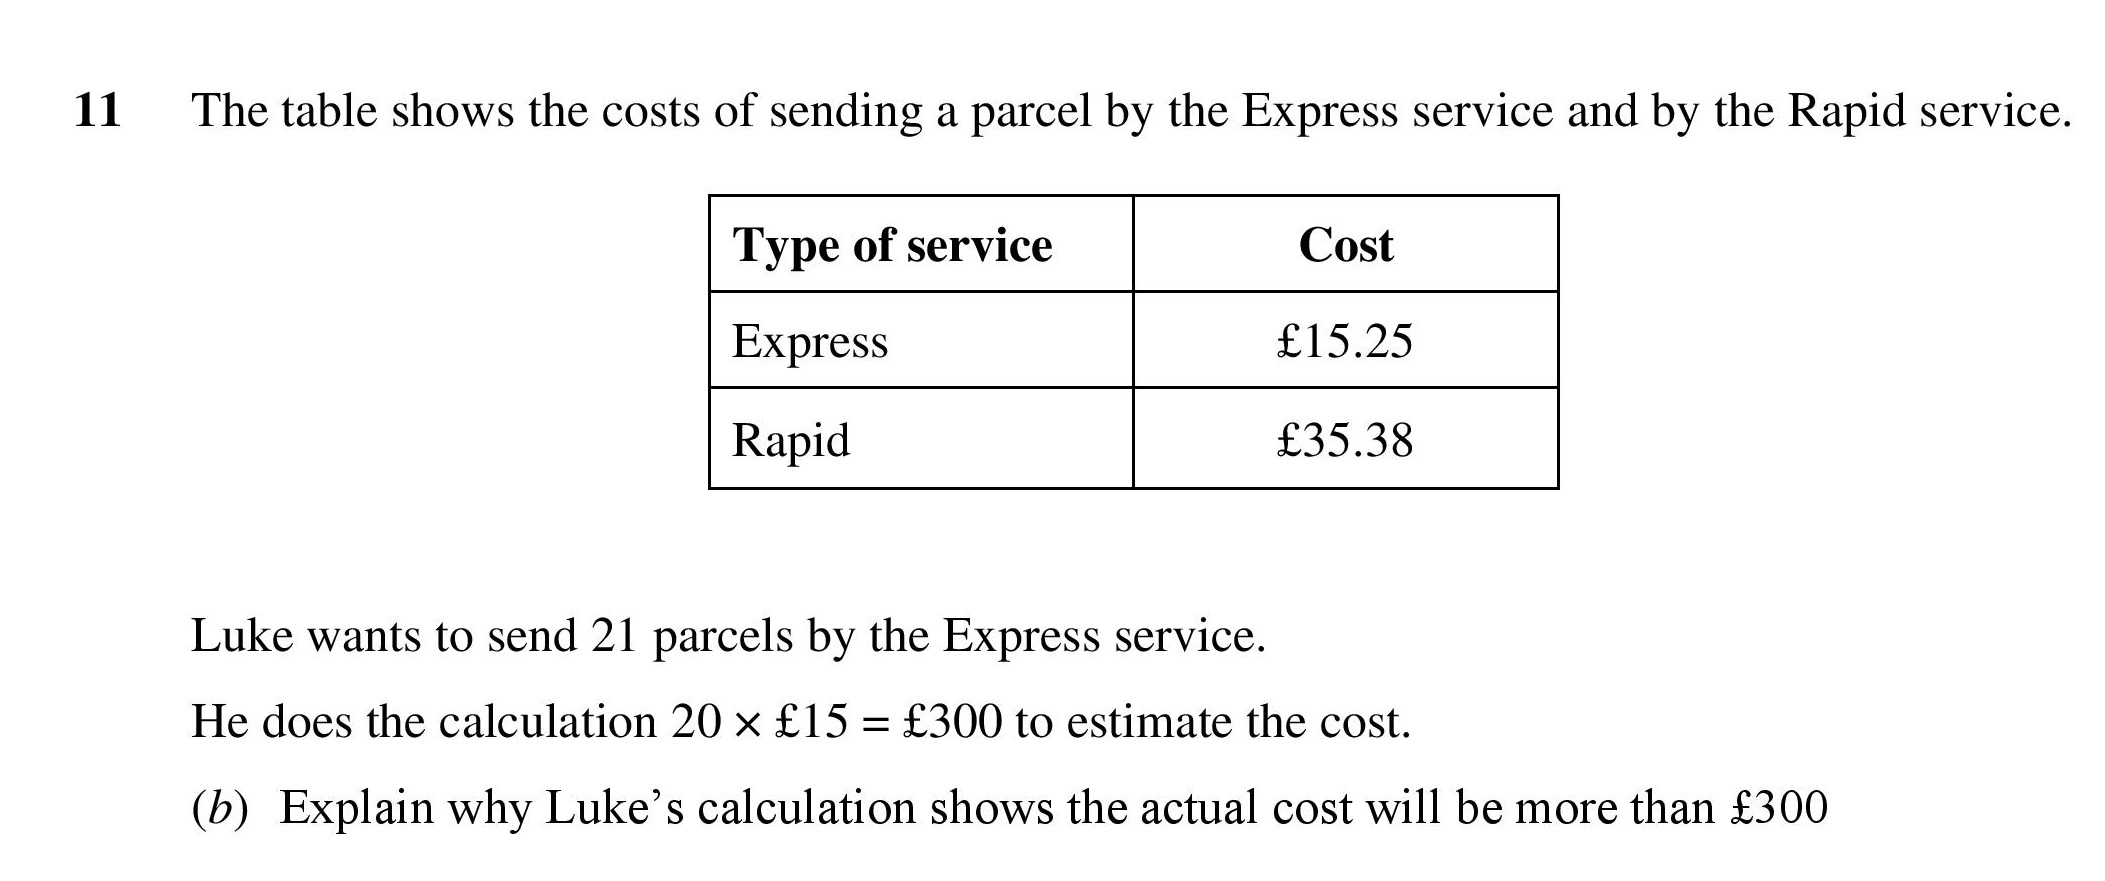
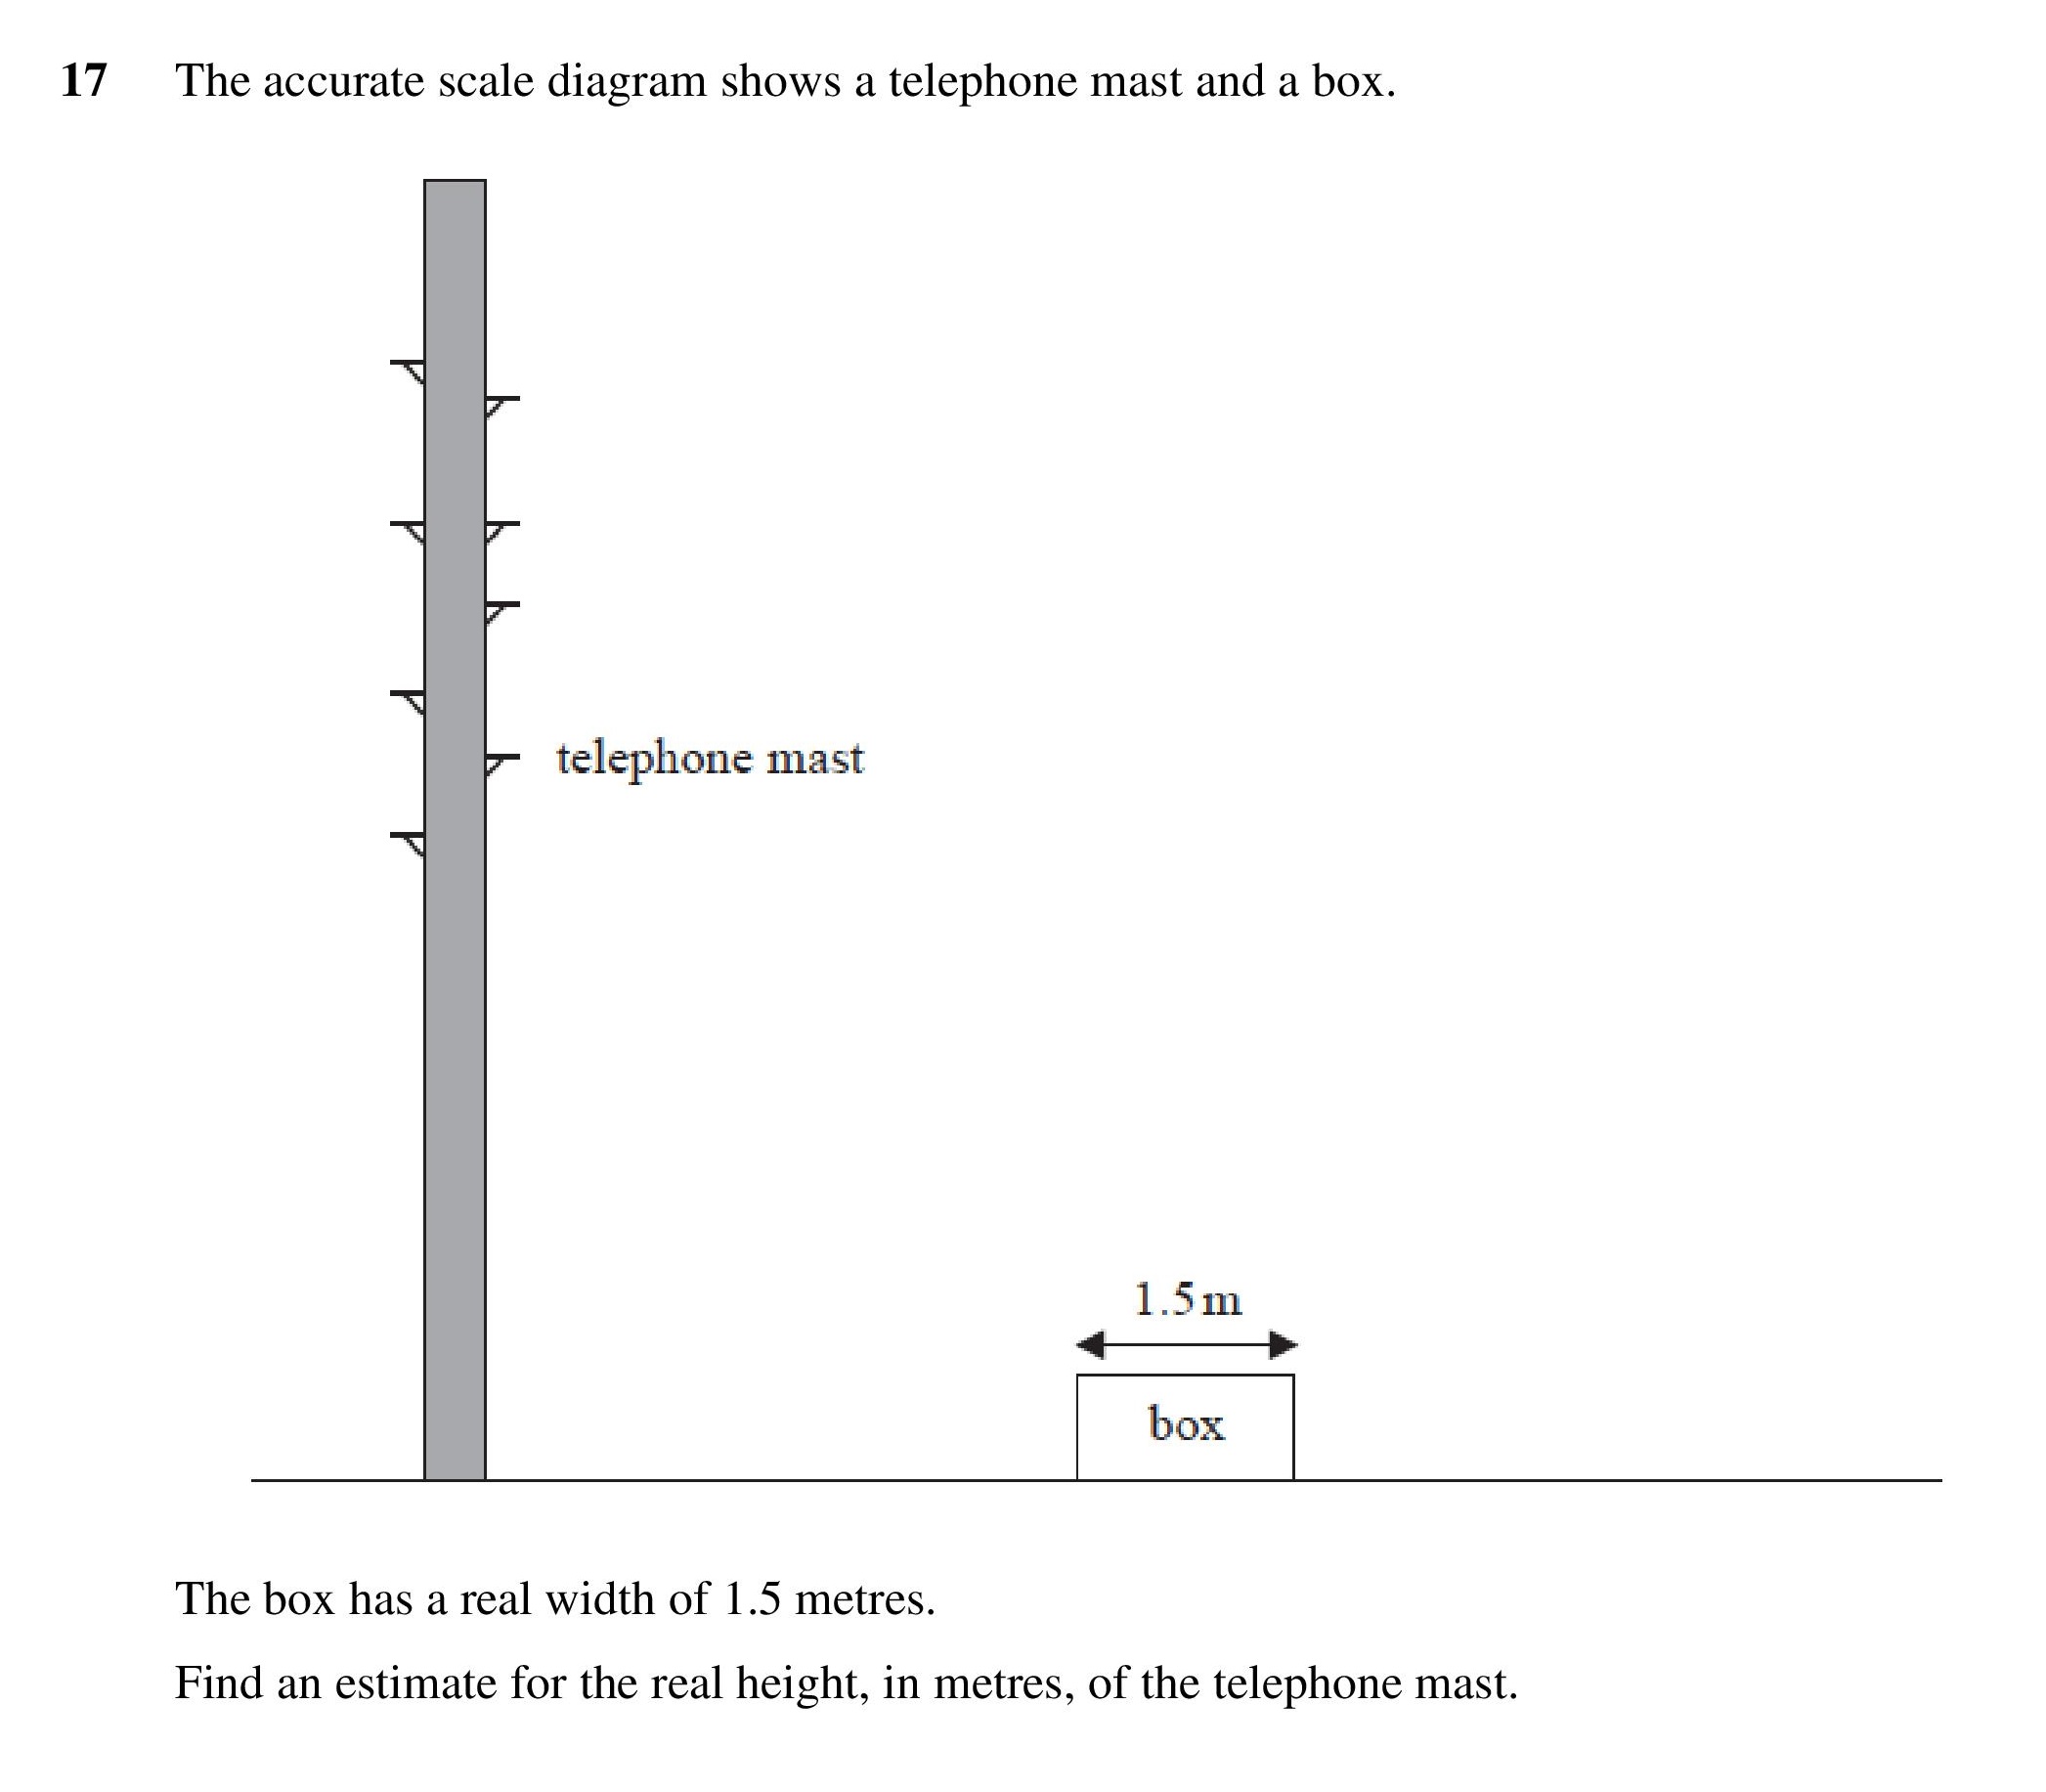
| Estimation and Reasoning | 2 | 1 | 1 | 0.53 | 0.47 | |
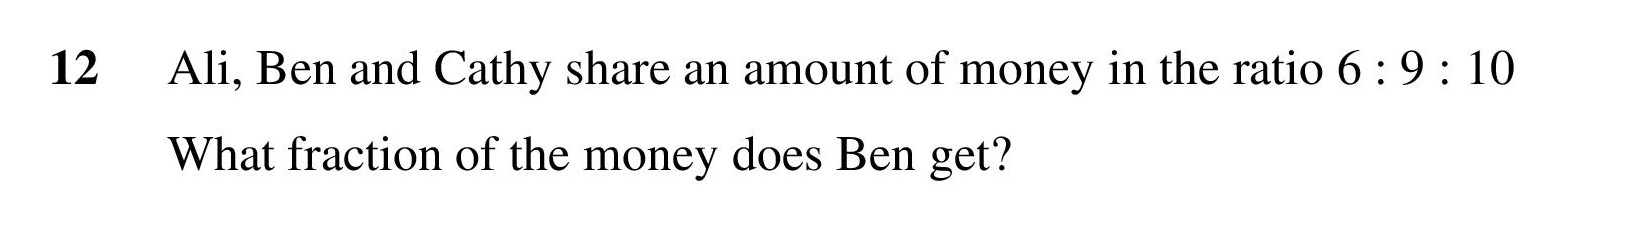
| Equivalence of ratio and fractions | 1 | 2 | 0.75 | 0.61 | 0.14 | |
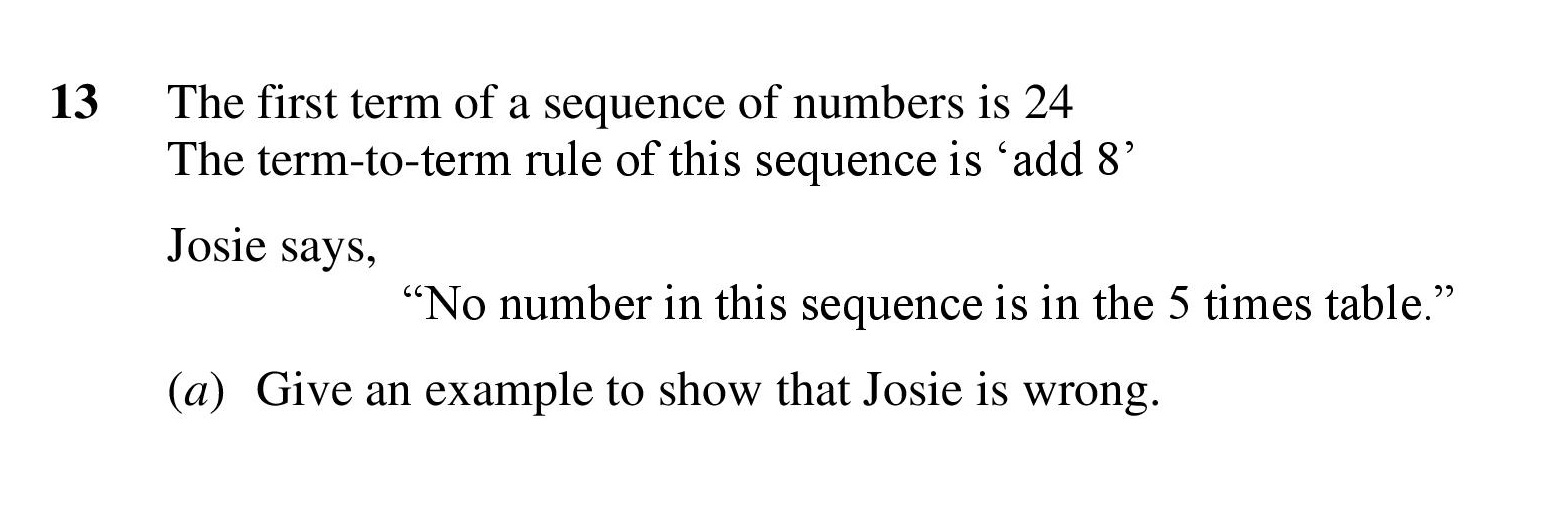
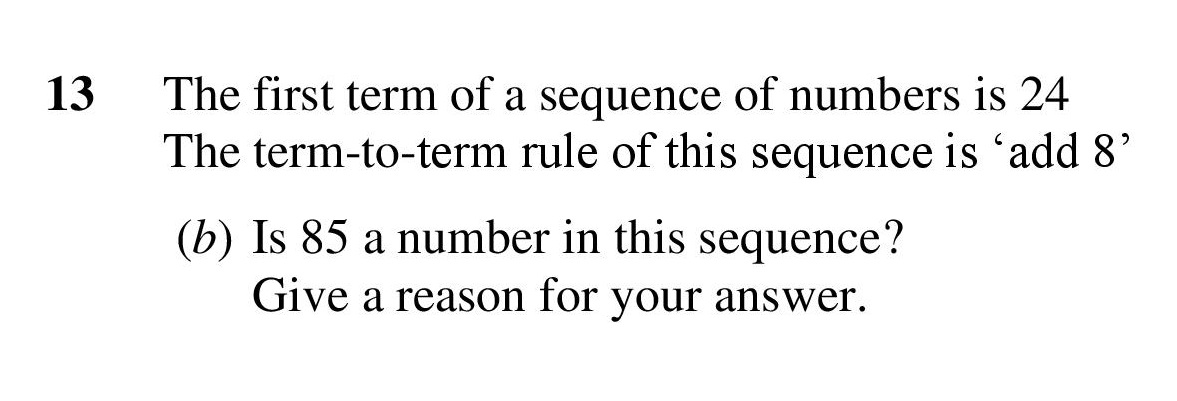
| Sequences and Counter Example | 1 | 1 | 1 | 0.78 | 0.22 | |
| Basic Sequences | 2 | 1 | 1.5 | 0.67 | 0.83 | |
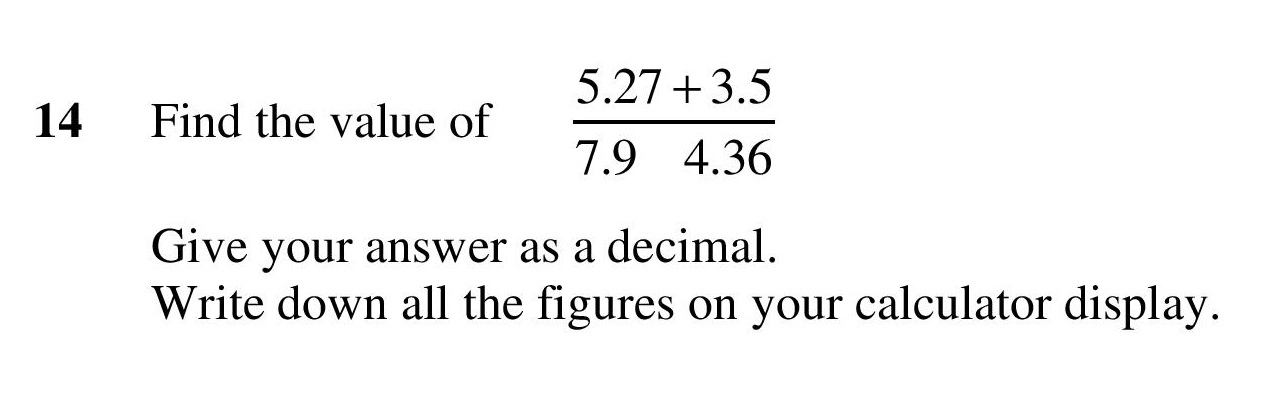
| Using a Calculator | 1 | 2 | 0.5 | 0.77 | -0.27 | |
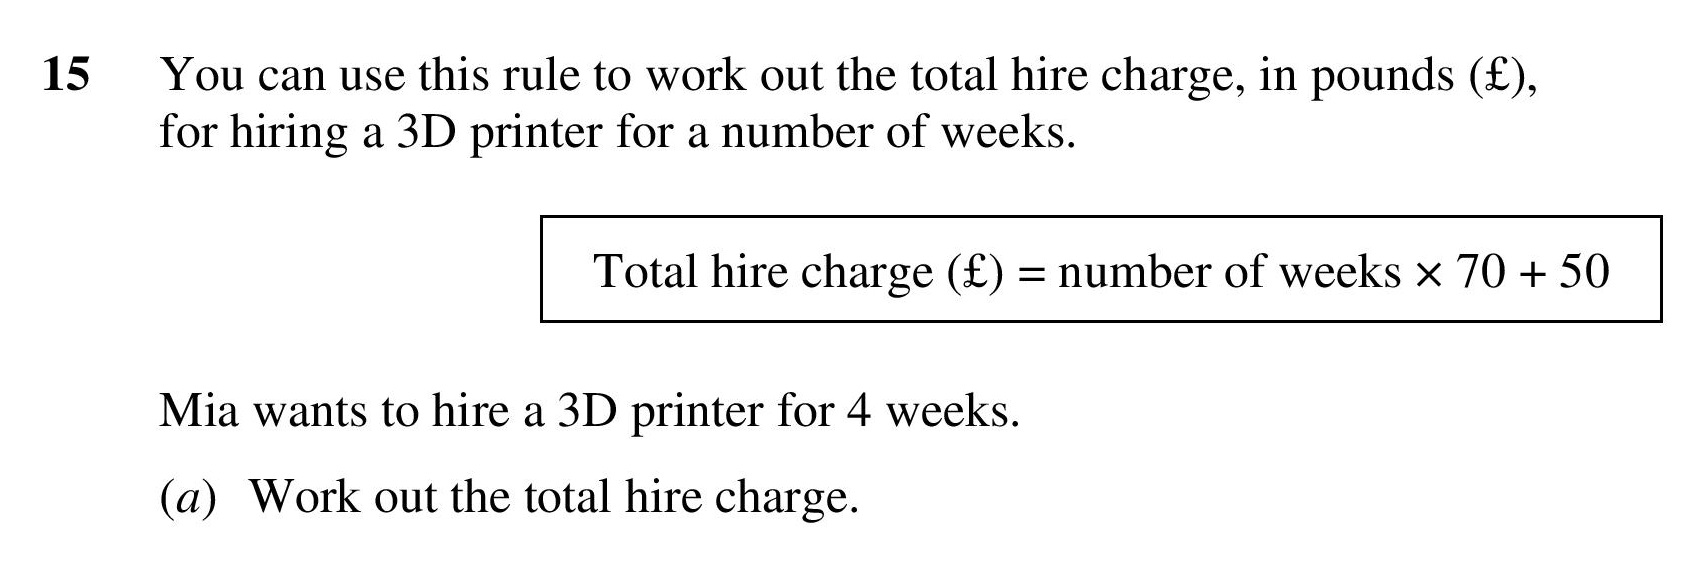
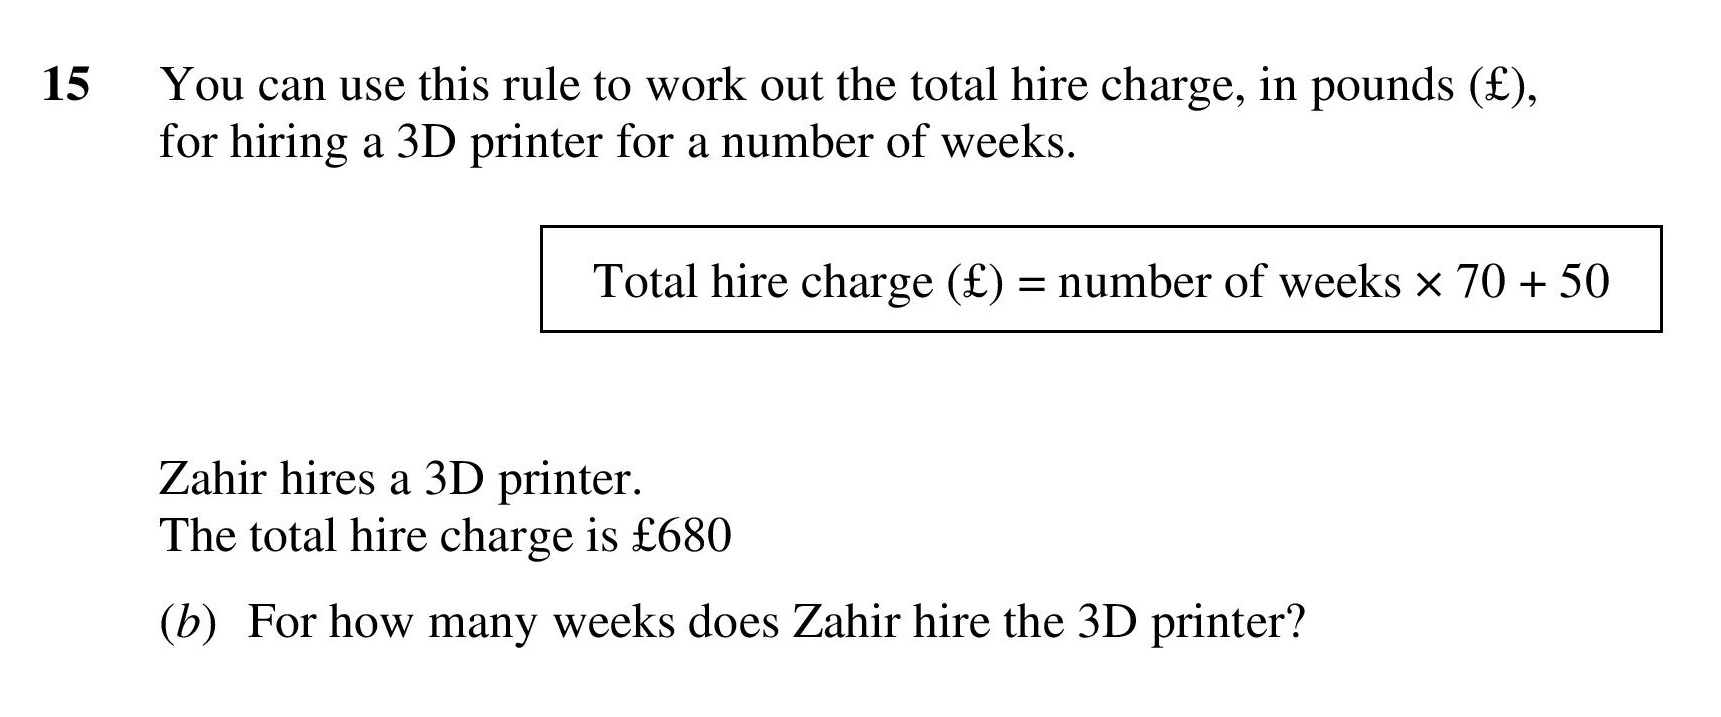
| Worded Formula | 1 | 2 | 0.75 | 0.9 | -0.15 | |
| Applying a Formula | 1 | 2 | 0.5 | 0.76 | -0.26 | |
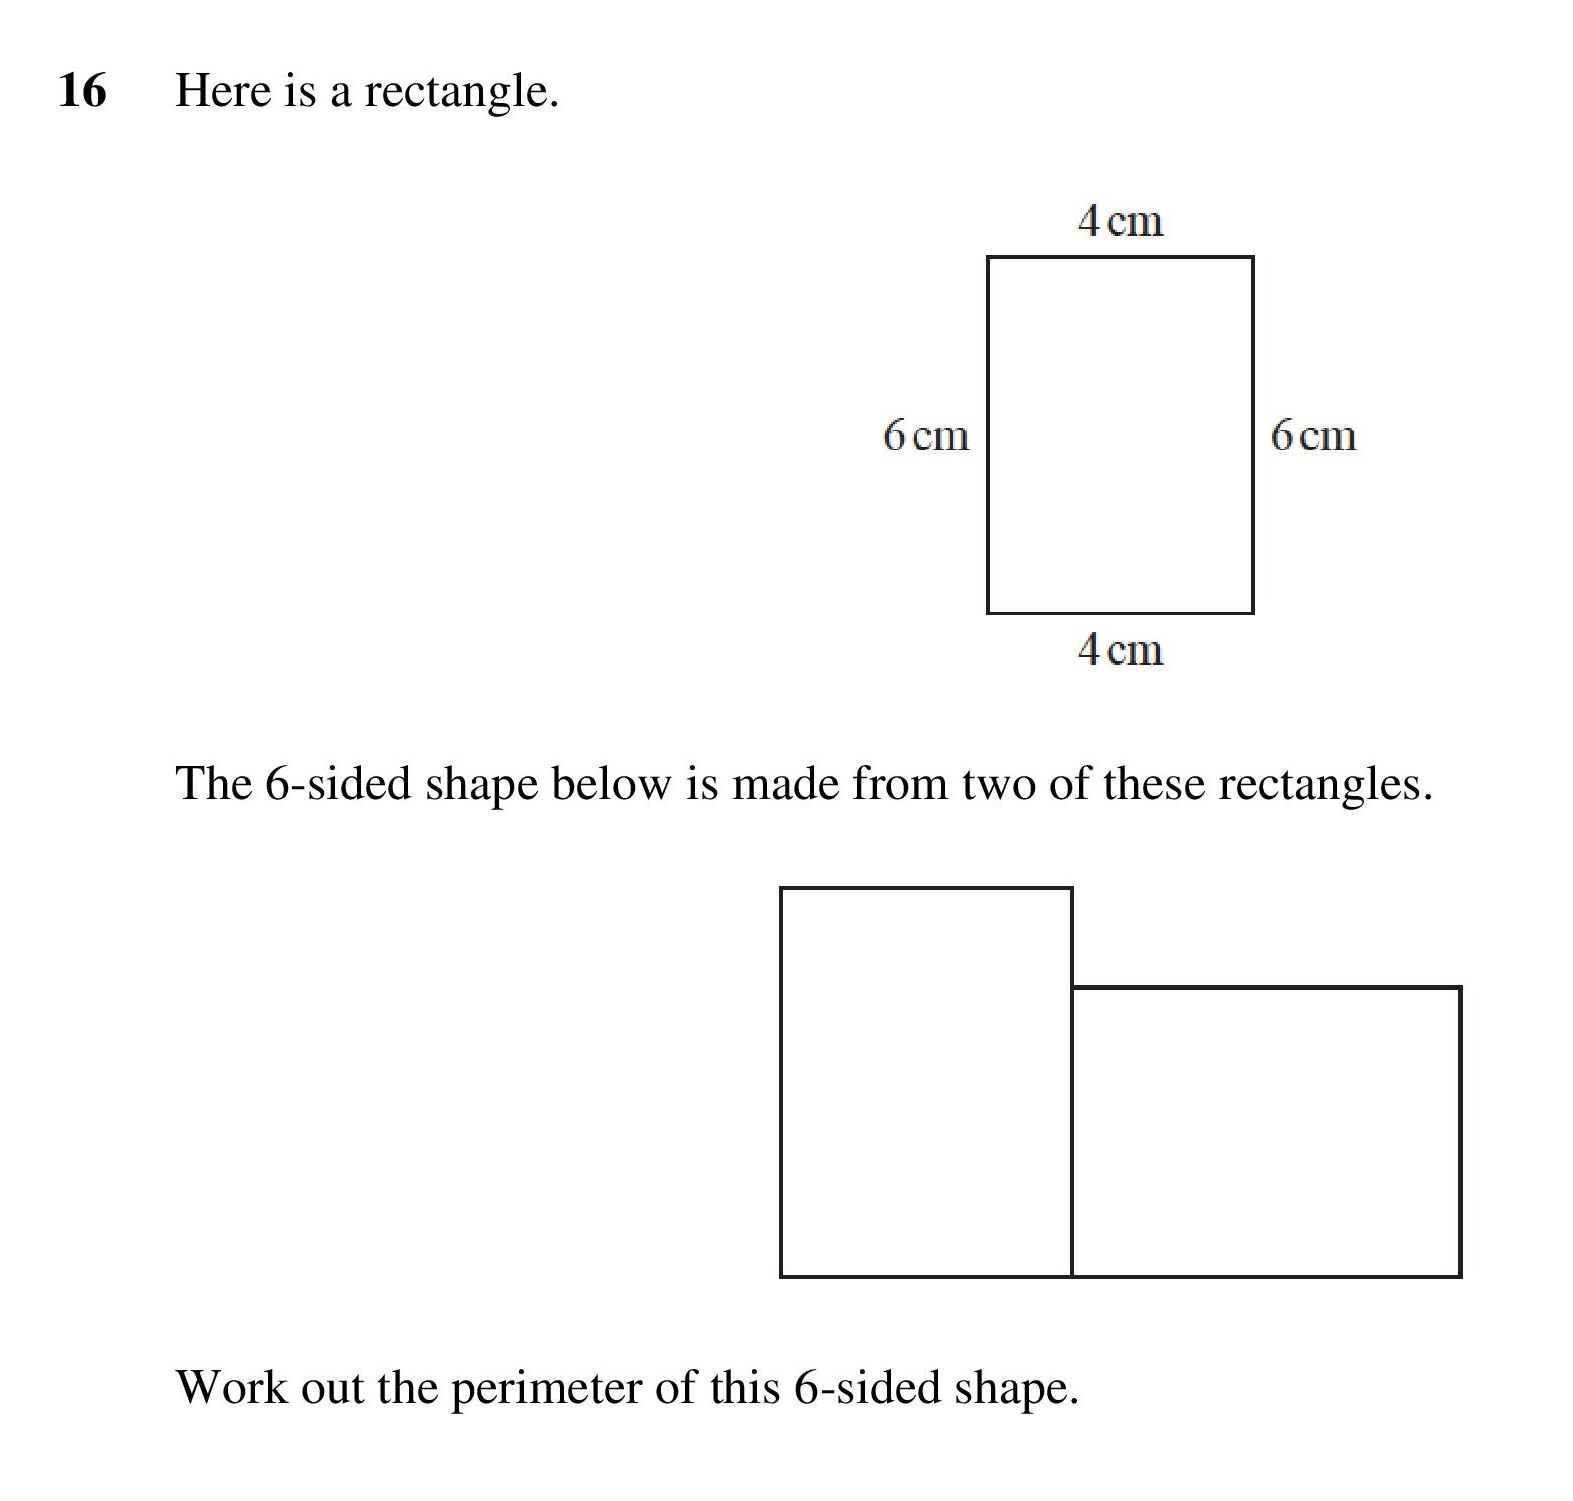
| Perimeter of a Rectangle | 1 | 3 | 0.5 | 0.44 | 0.06 | |
| Estimating measures | 1 | 2 | 0.5 | 0.38 | 0.12 | |
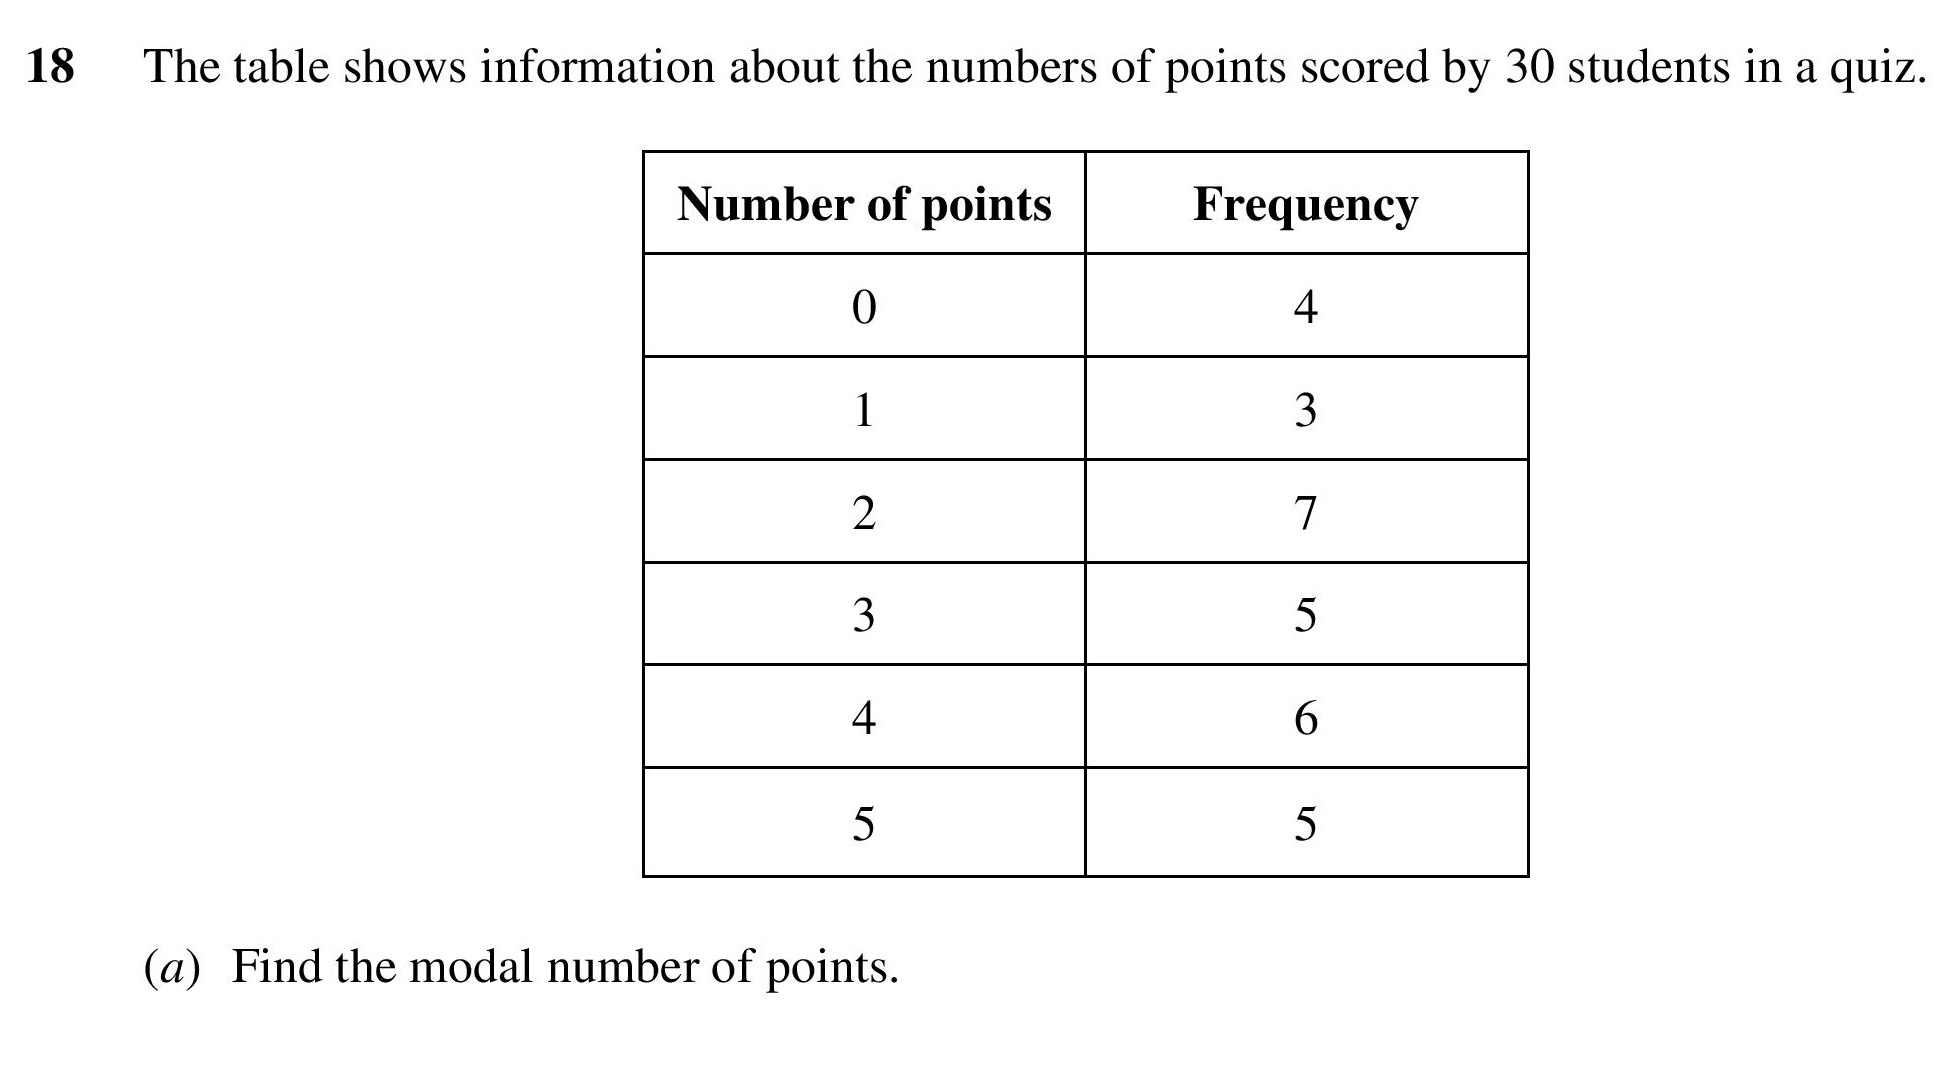
| Averages from Frequency Tables | 1 | 1 | 1.5 | 0.37 | 1.13 | |
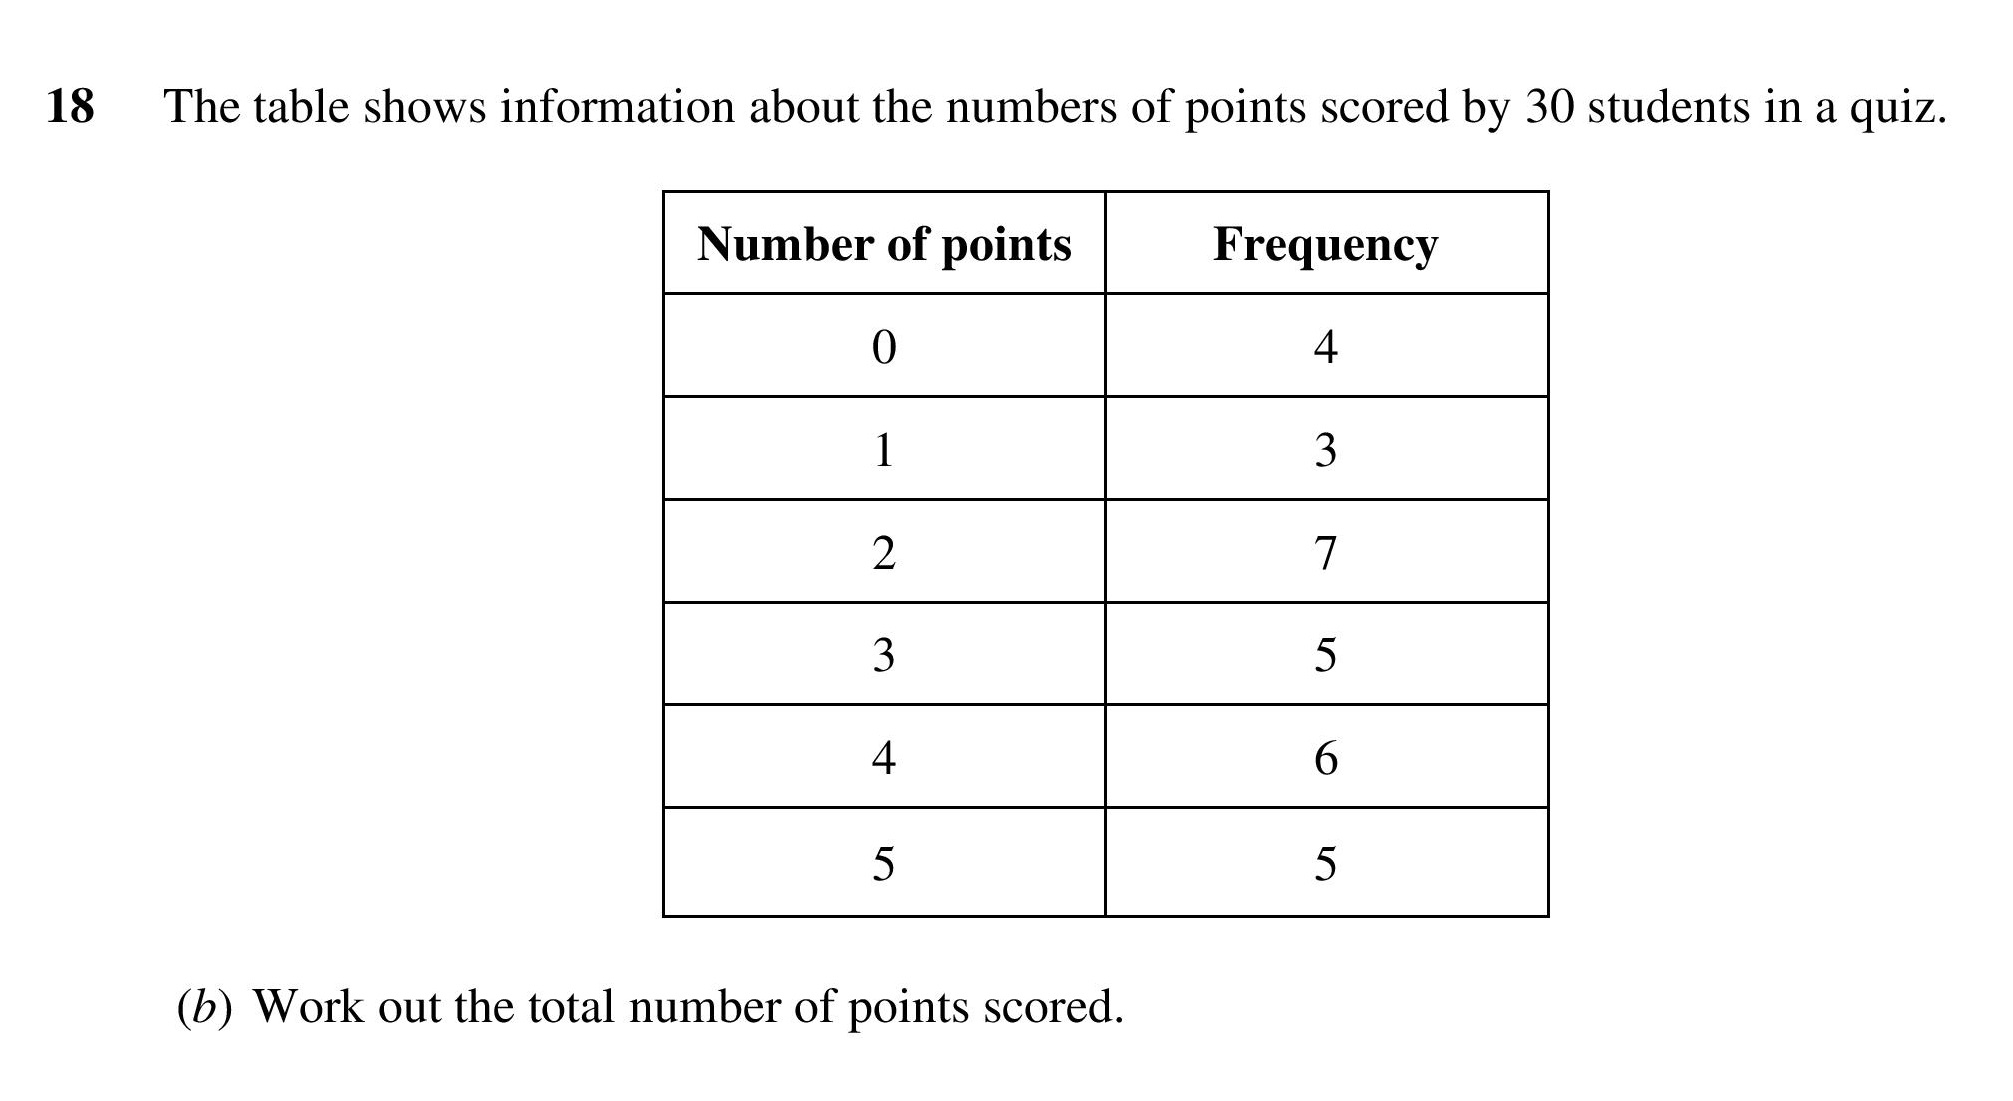
| Total from a Frequency Table | 1 | 2 | 0.5 | 0.49 | 0.01 | |
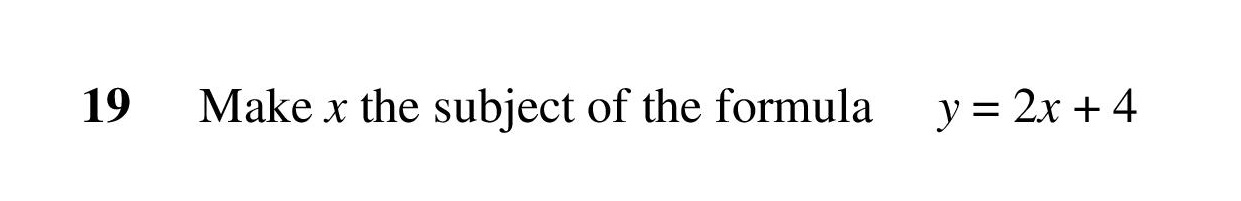
| Changing the Subject of a Formula | 1 | 2 | 0.75 | 0.22 | 0.53 | |
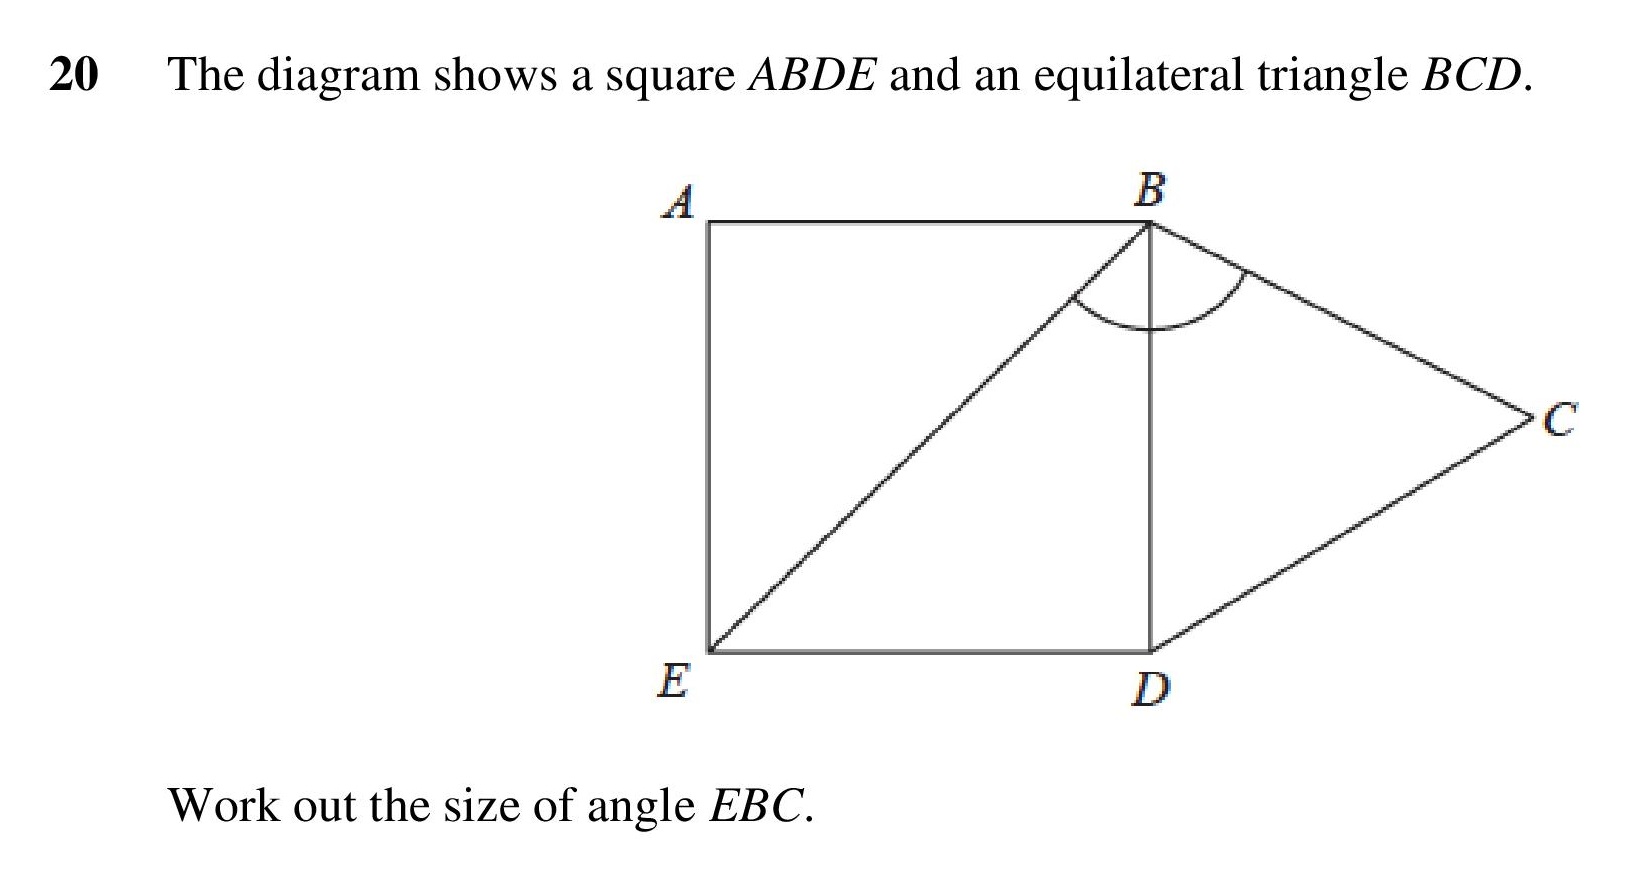
| Triangles and Quadrilaterals with simple Angl | 1 | 2 | 0.5 | 0.31 | 0.19 | |
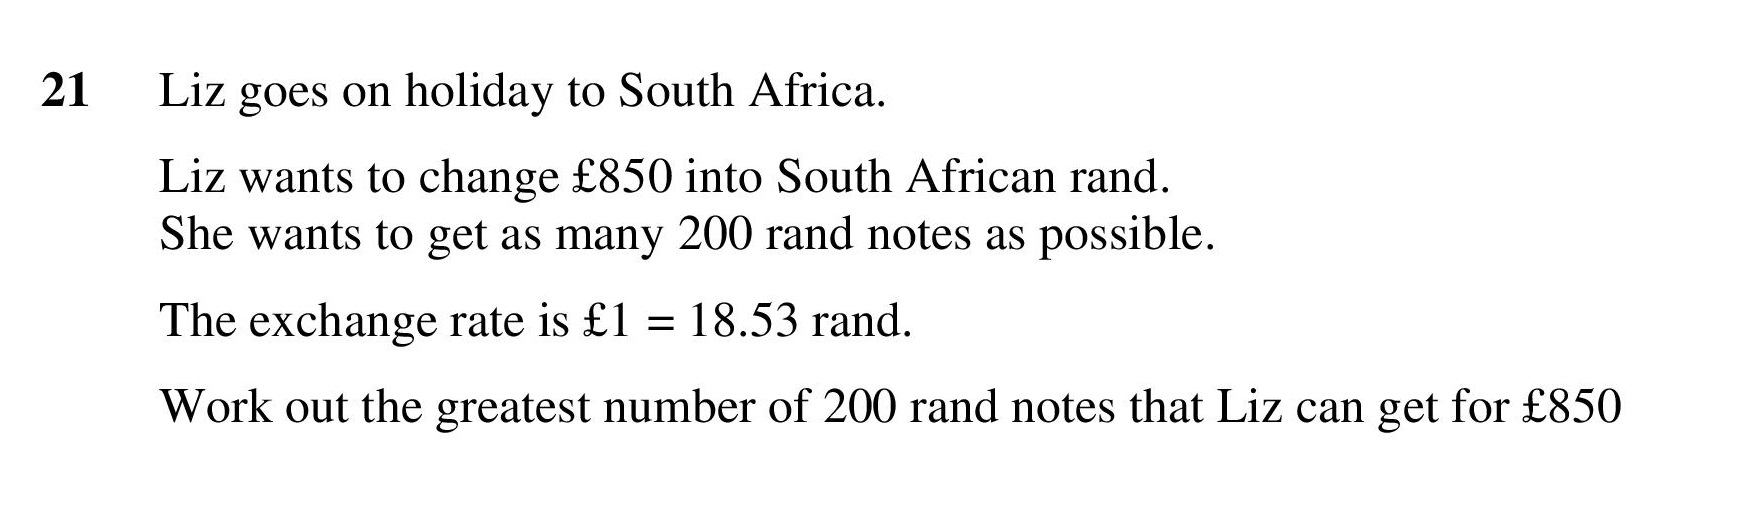
| Exchange Rates | 2 | 3 | 0.5 | 0.57 | -0.07 | |
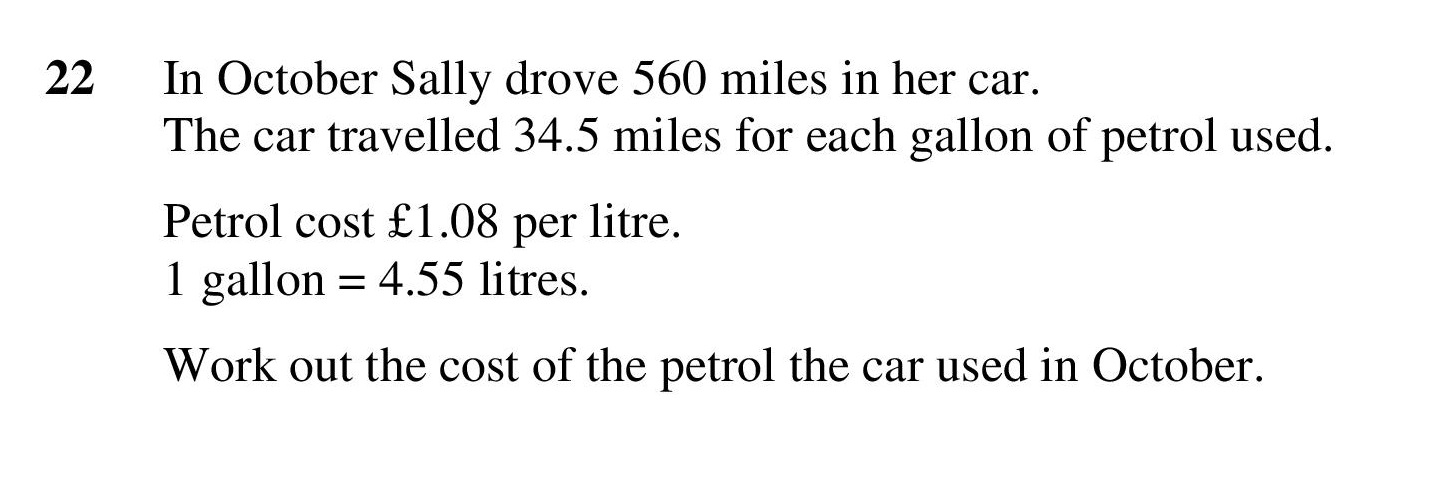
| Metric and Imperial Conversion | 2 | 4 | 0.25 | 0.27 | -0.02 | |
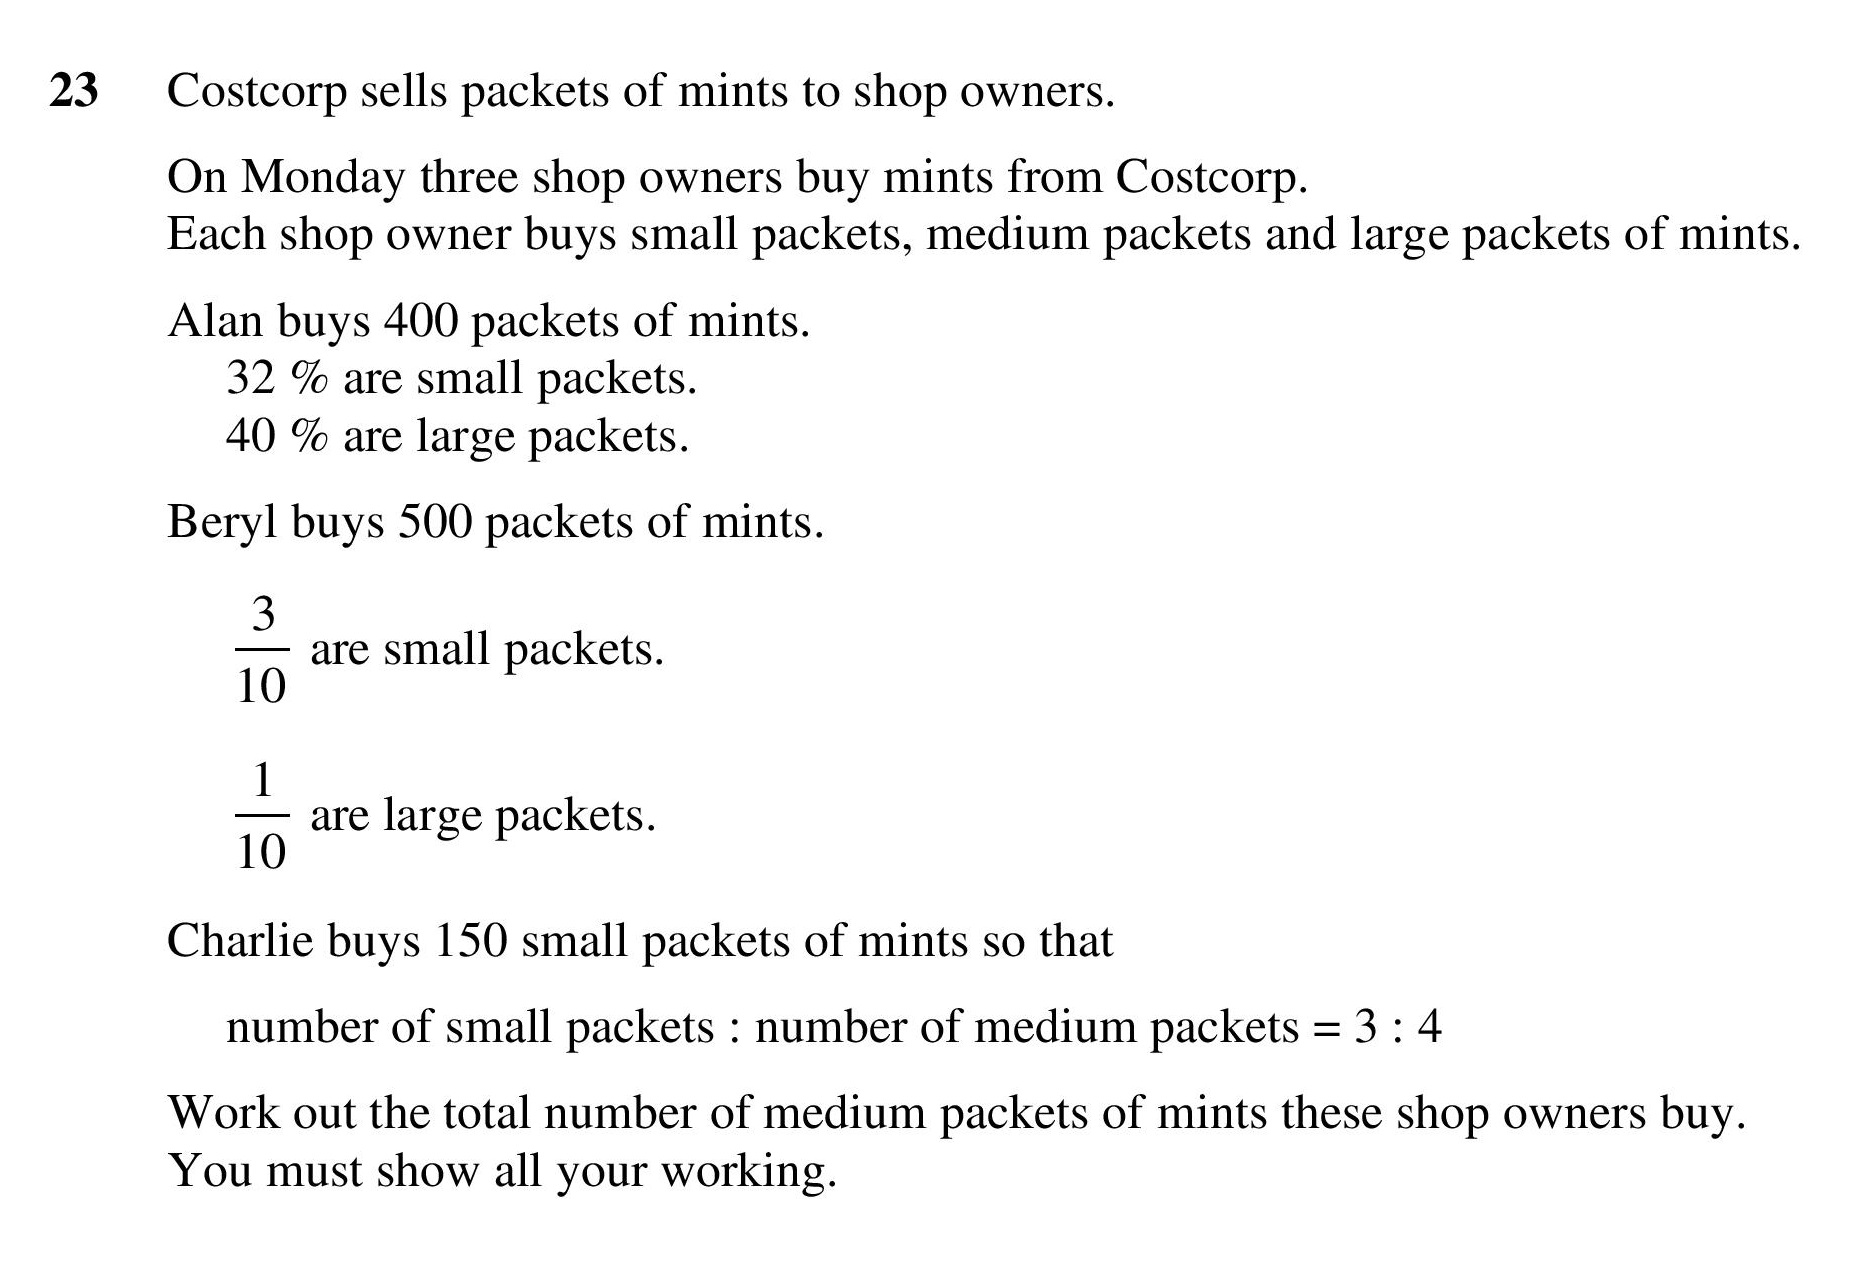
| Ratio, Fractions and Percentage Problems | 3 | 5 | 0.3 | 0.3 | 0 | |
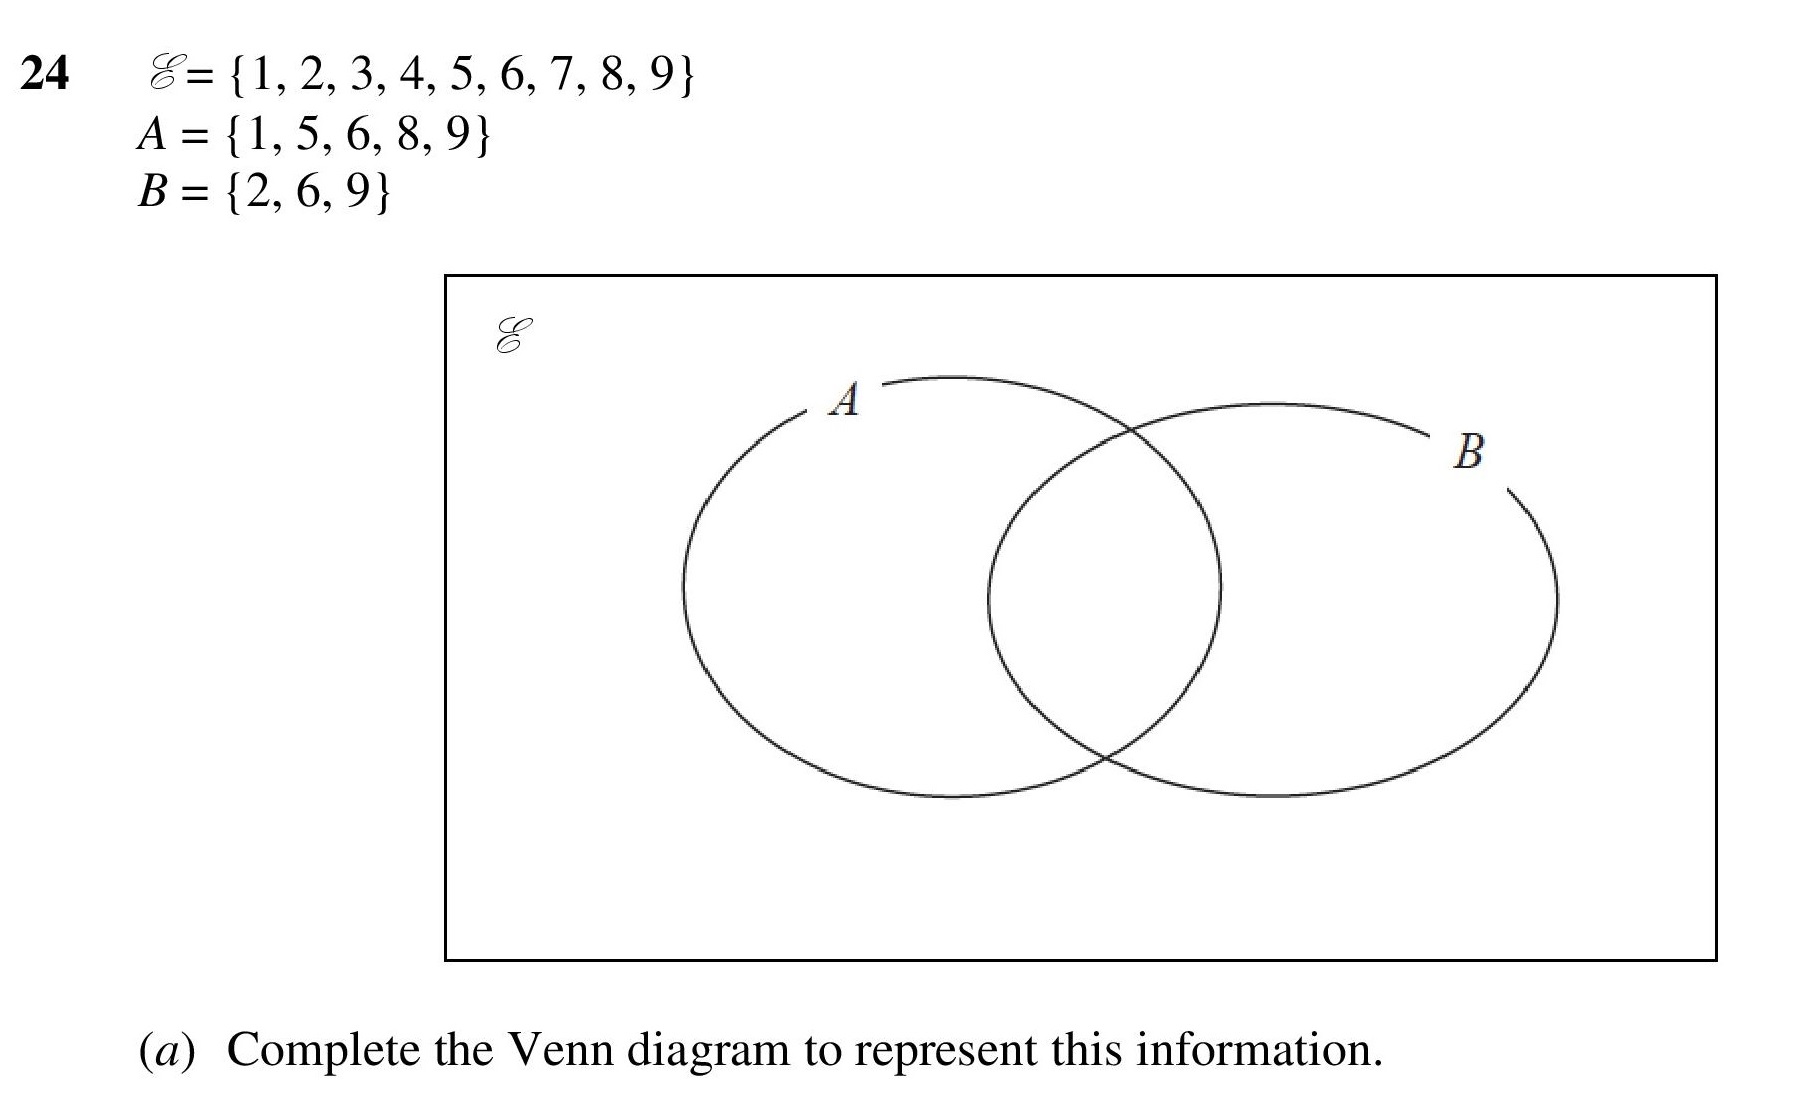
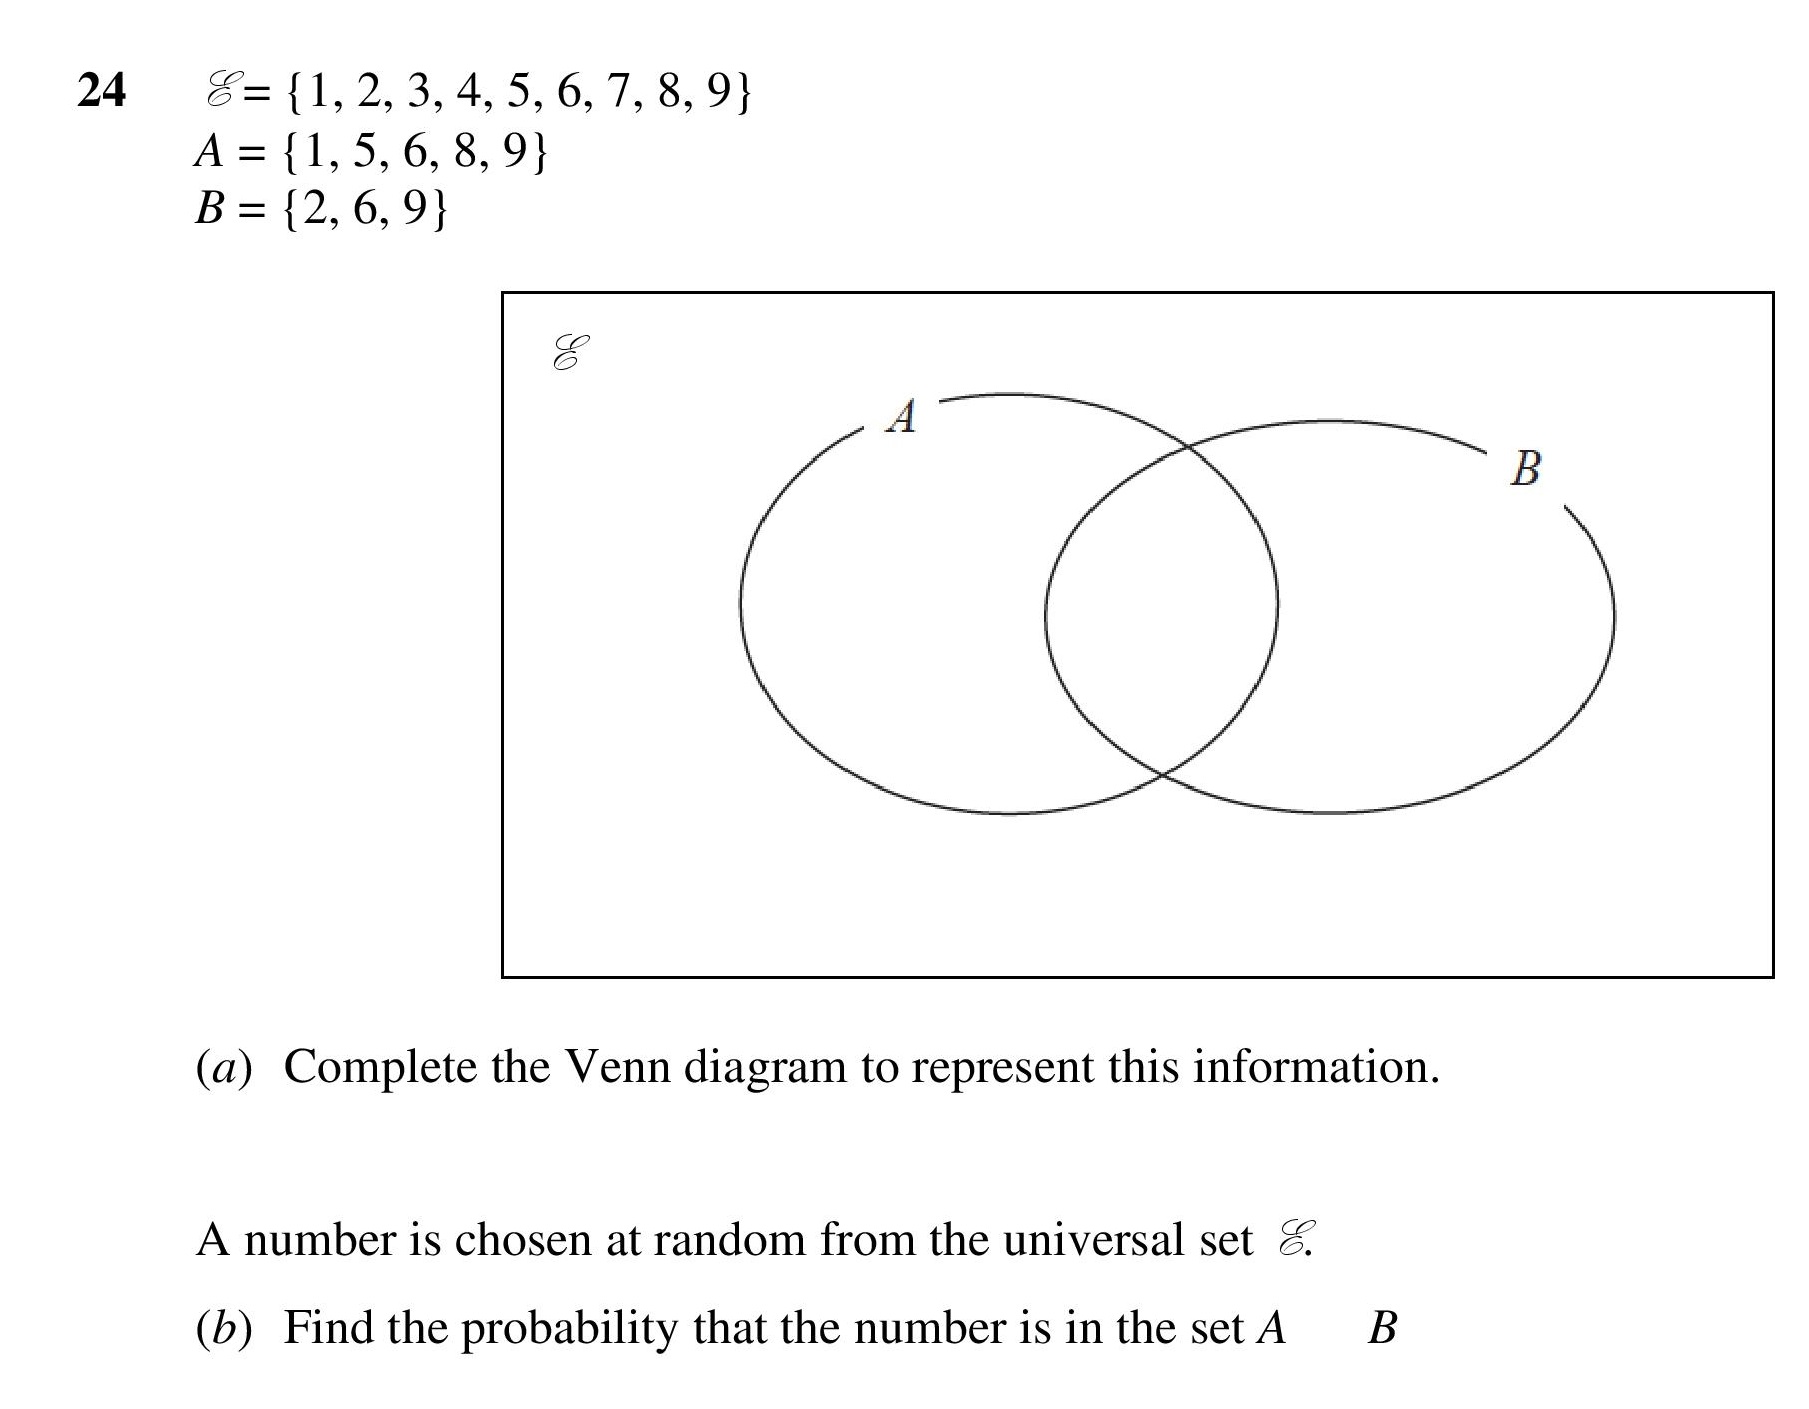
| Venn Diagrams | 1 | 3 | 0.33 | 0.53 | -0.2 | |
| Venn Diagrams and Probability | 1 | 2 | 0.75 | 0.31 | 0.44 | |
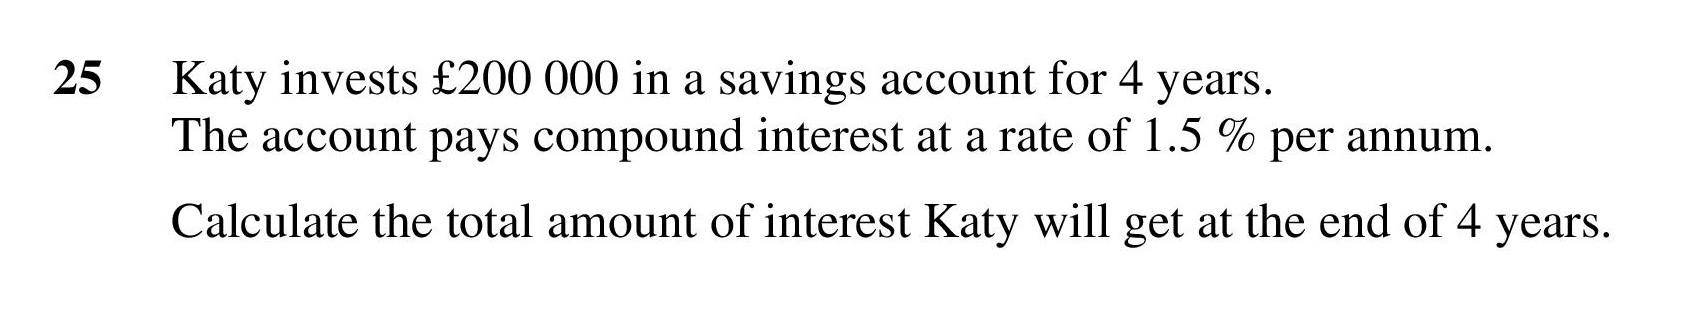
| Compound Interest and Depreciation | 1 | 3 | 0.33 | 0.11 | 0.22 | |
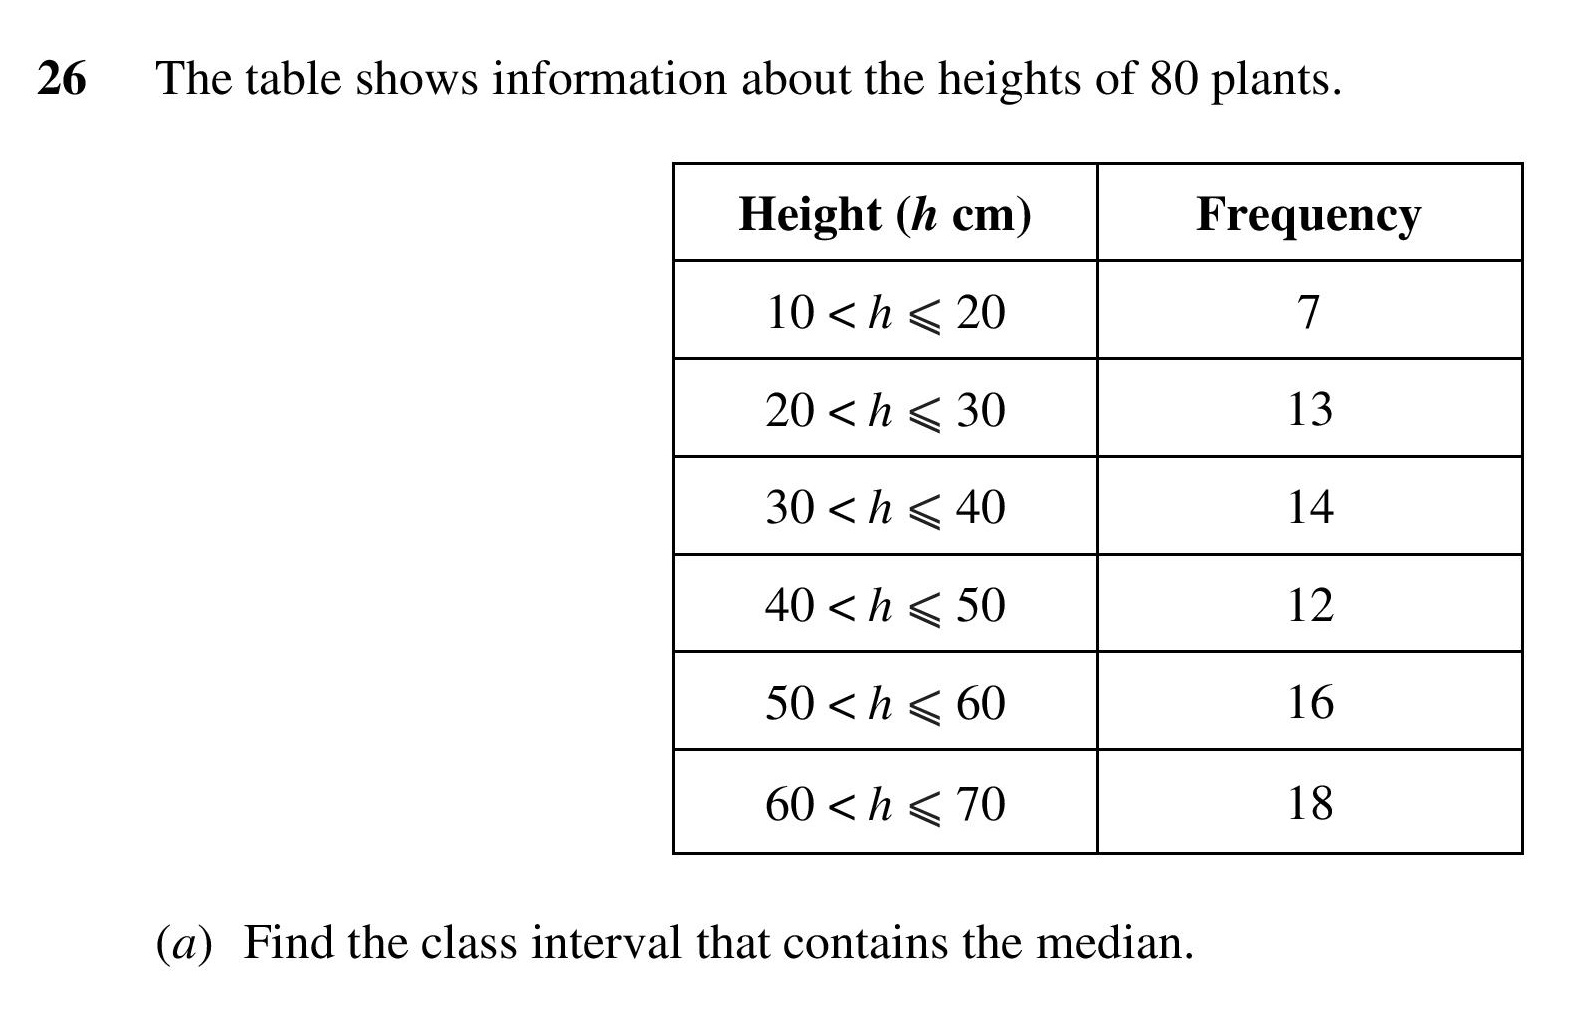
| Median from Grouped Frequency Table | 1 | 1 | 1.5 | 0.19 | 1.31 | |
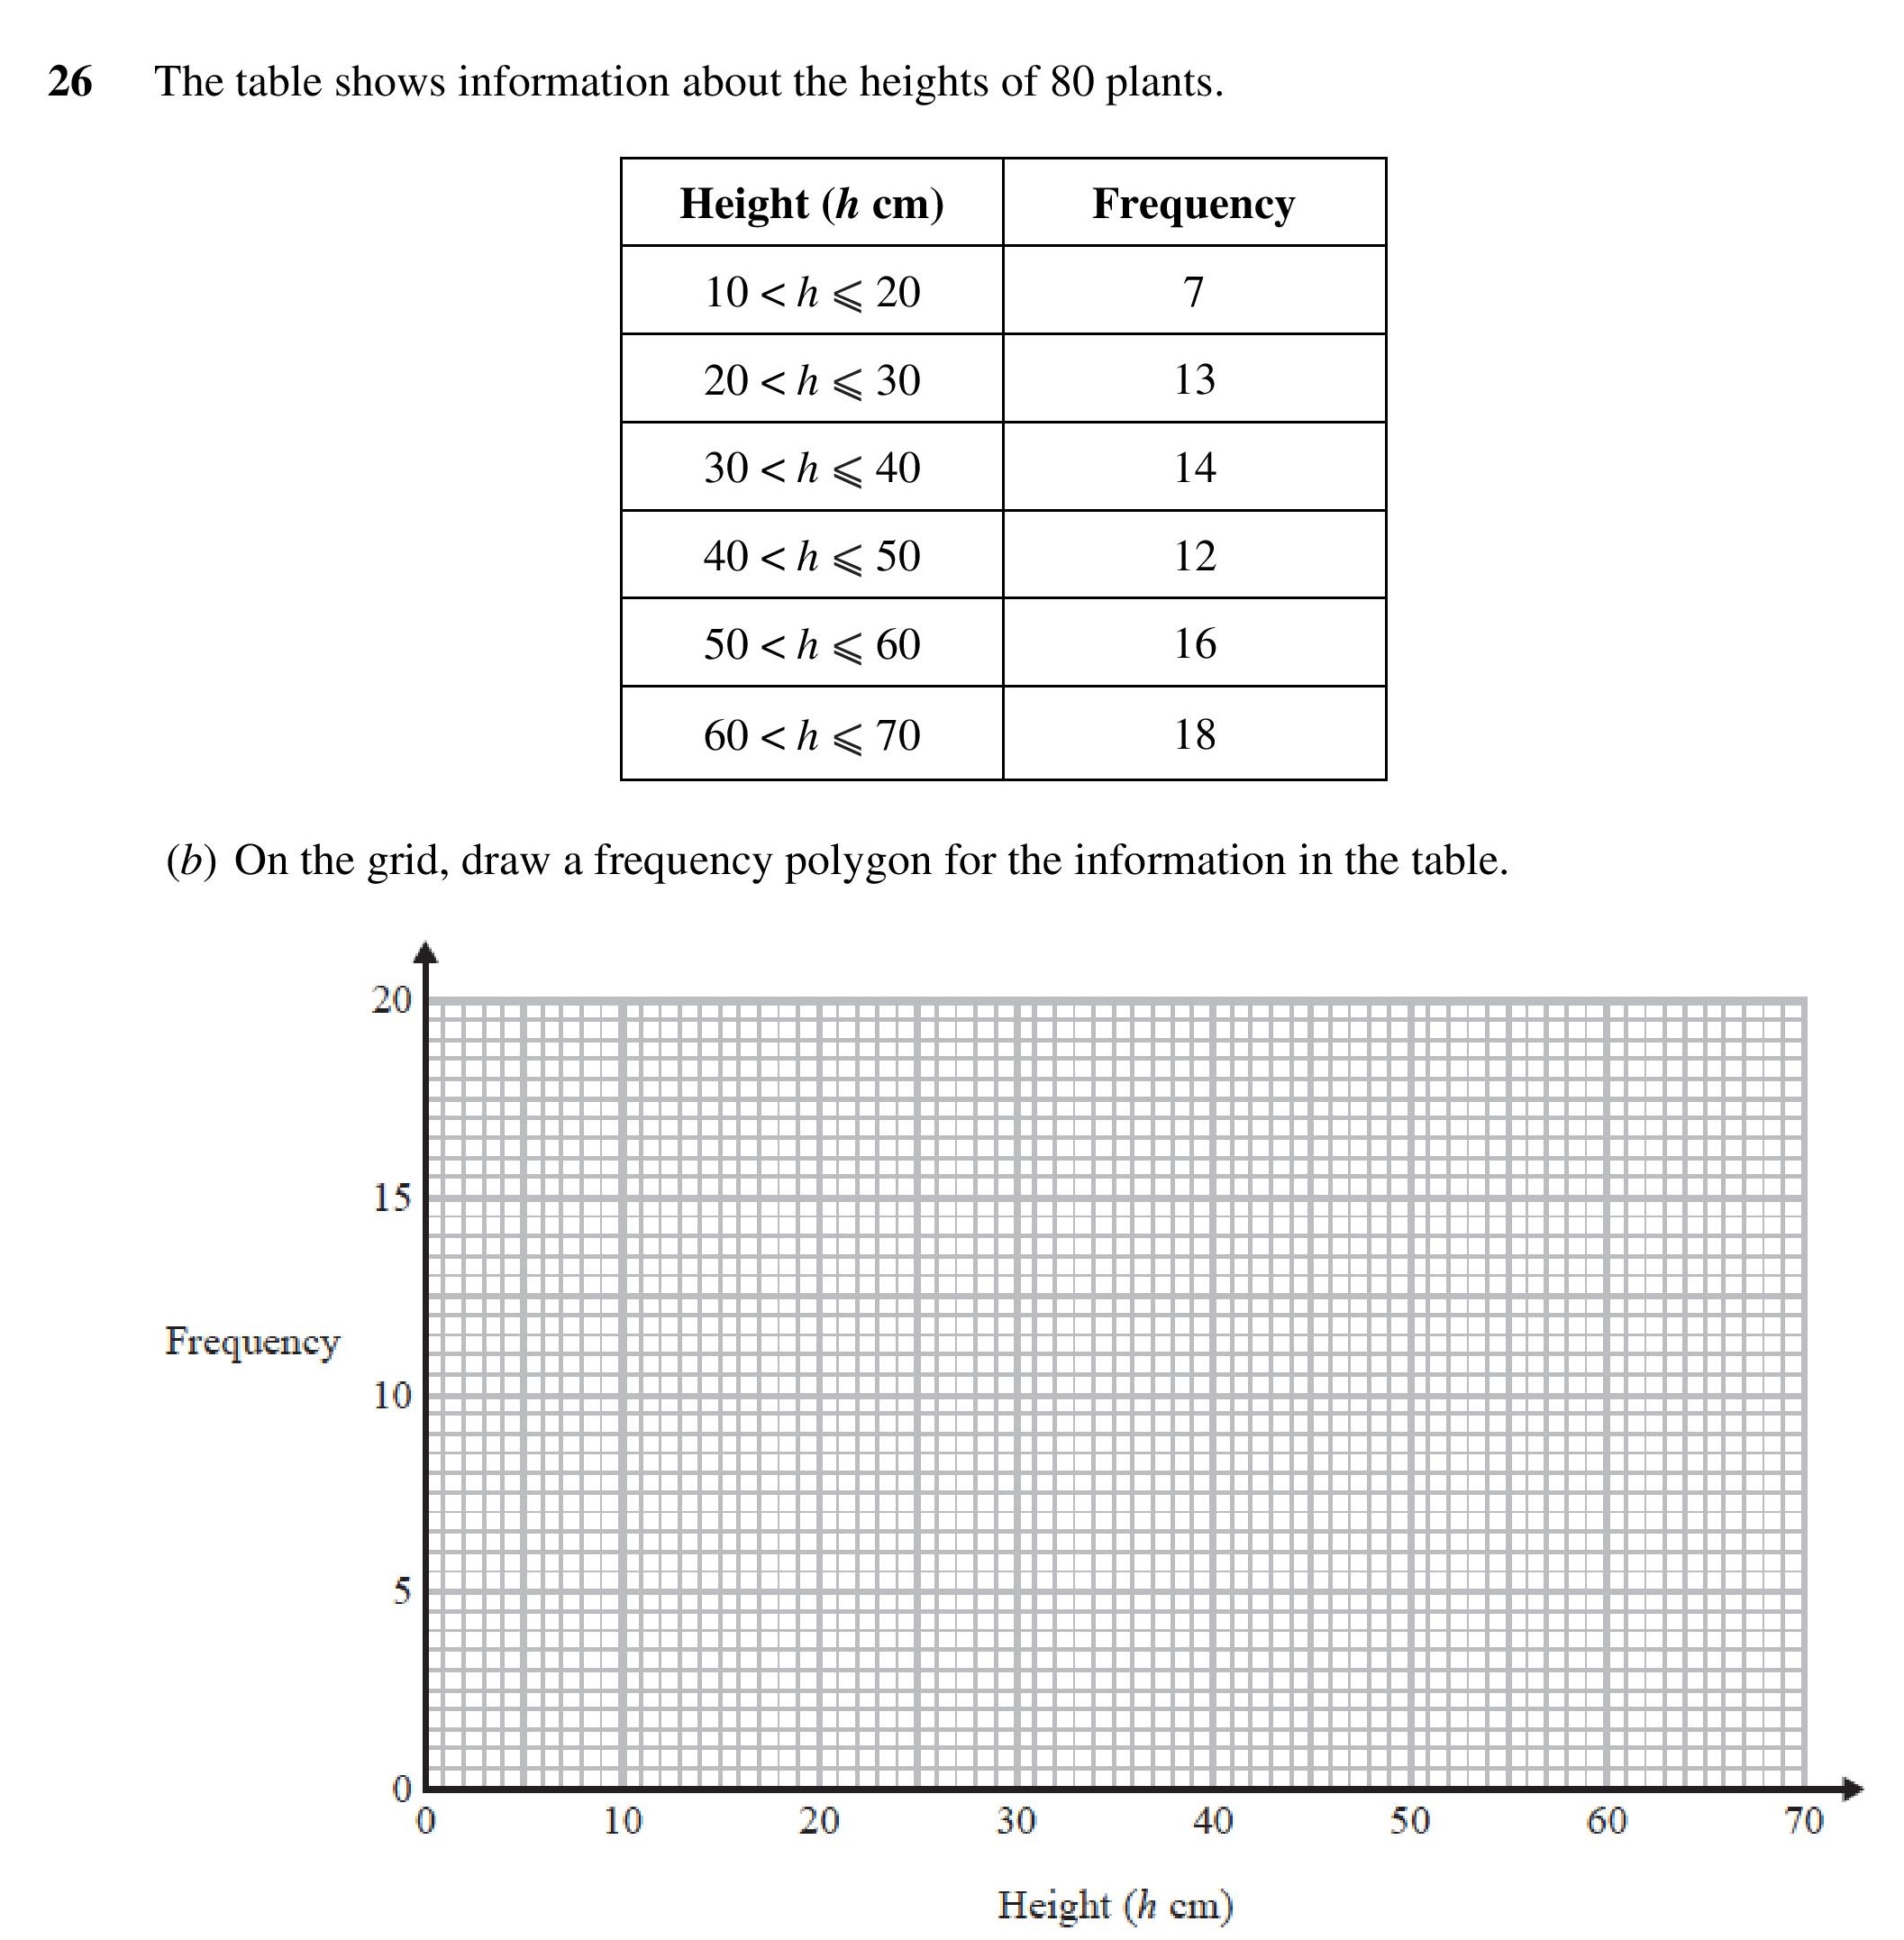
| Frequency Polygons | 1 | 2 | 0.5 | 0.23 | 0.27 | |
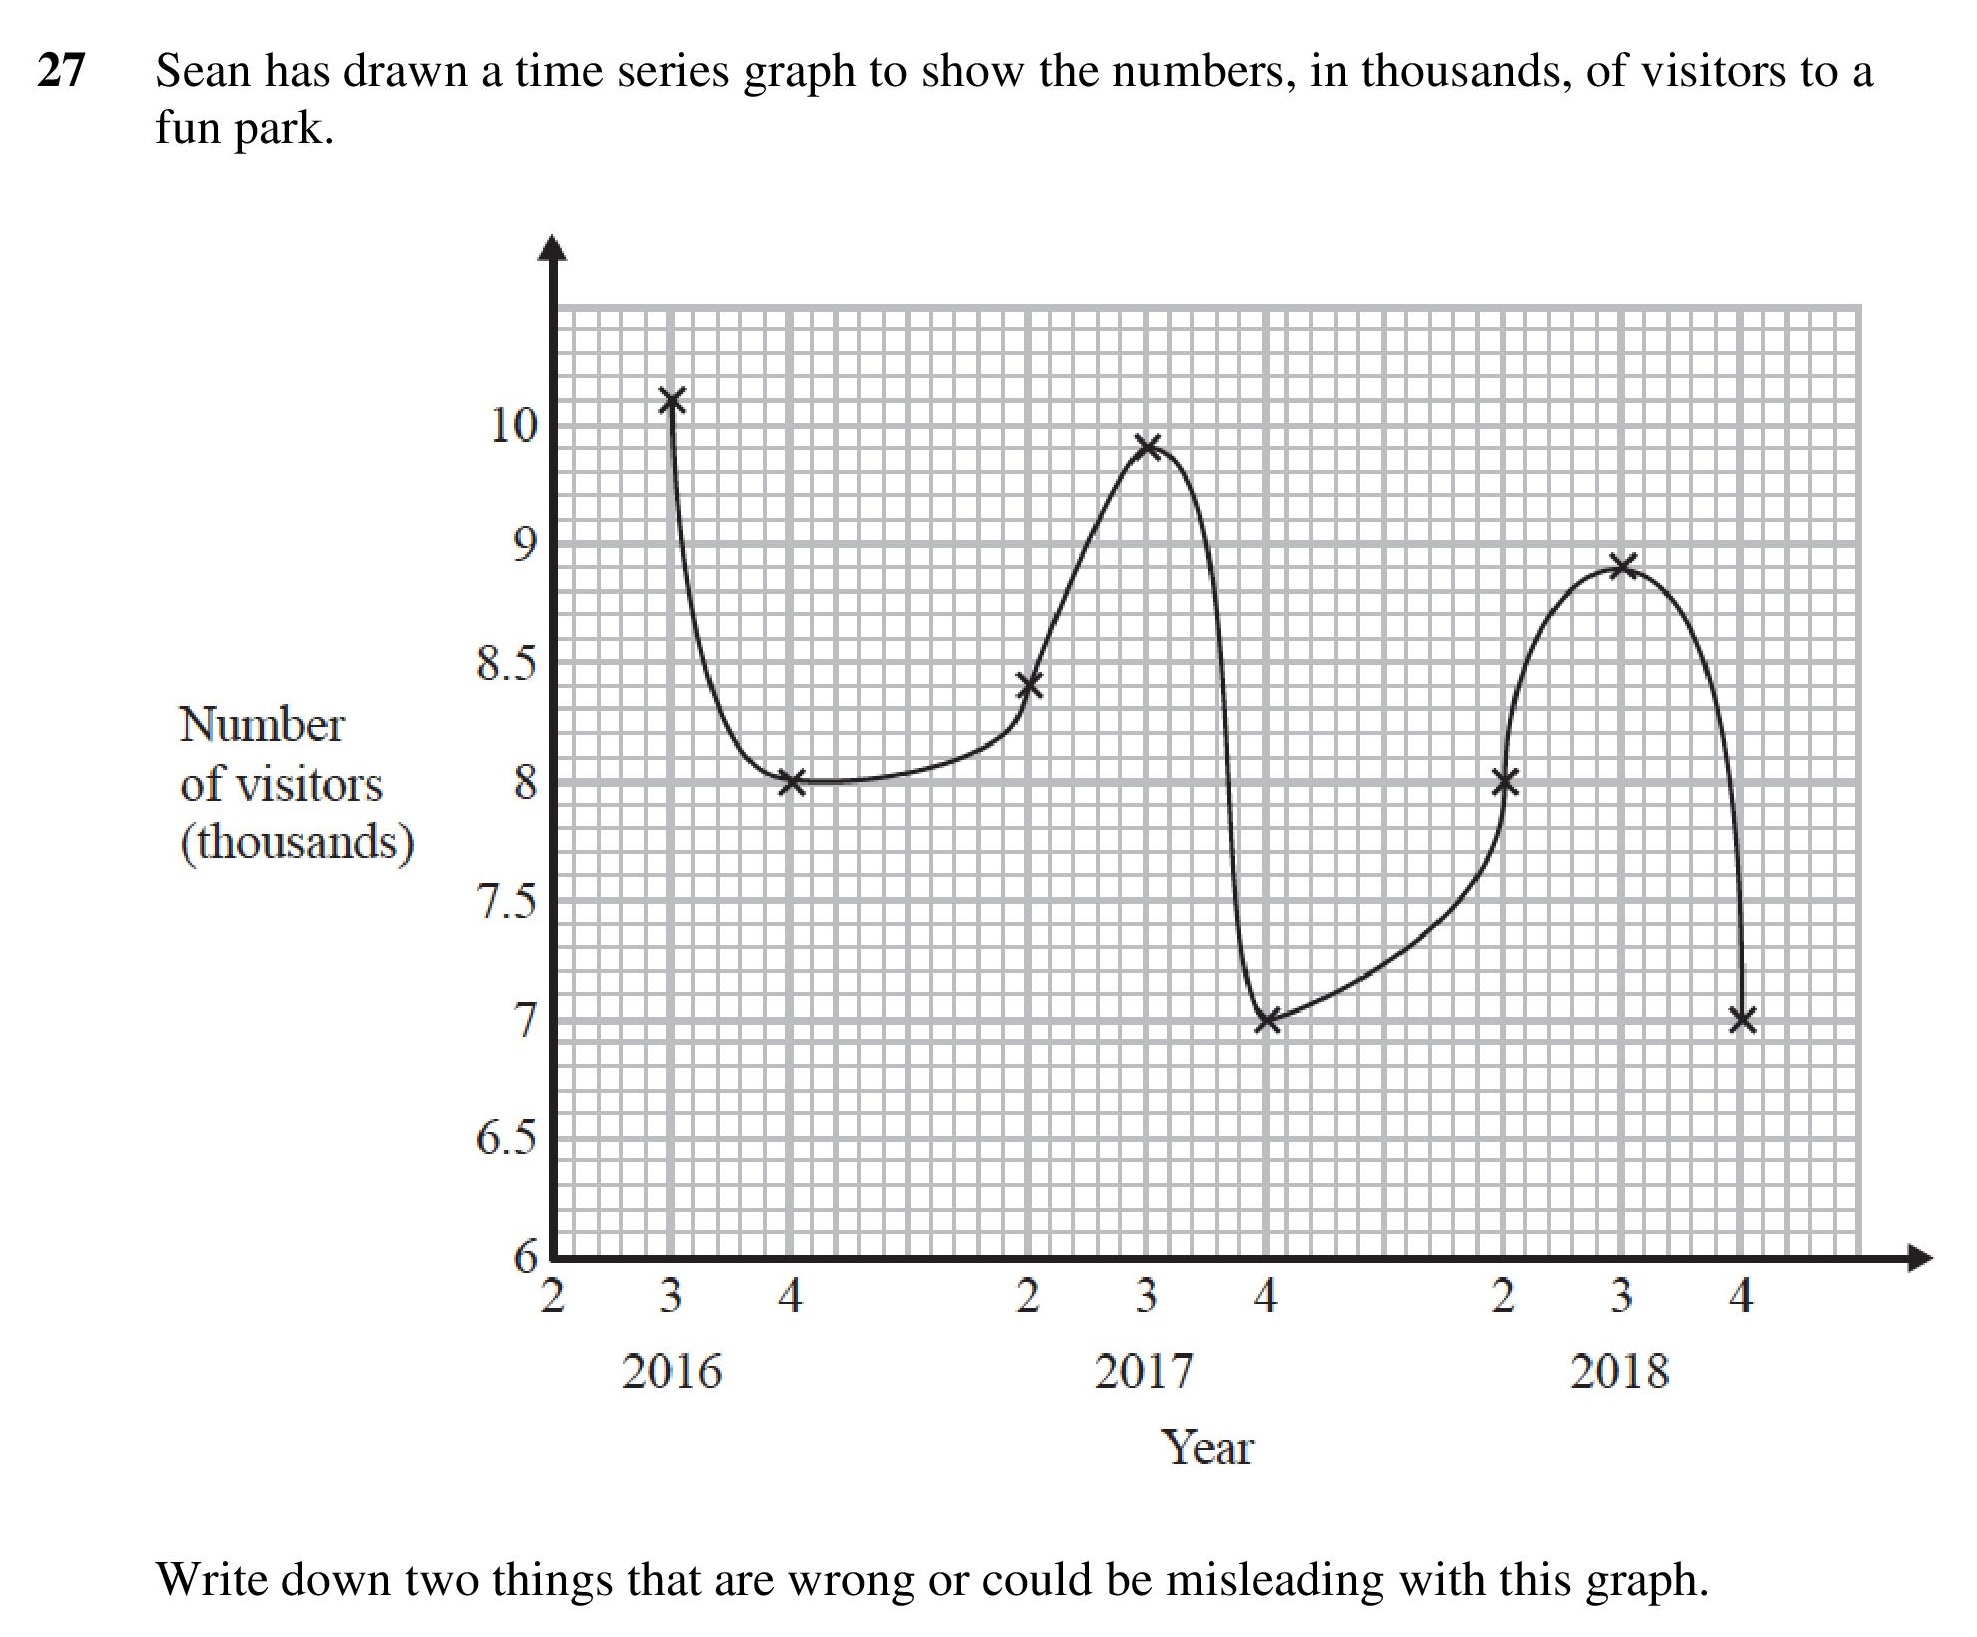
| Time Series Graph | 2 | 2 | 0.75 | 0.27 | 0.48 | |
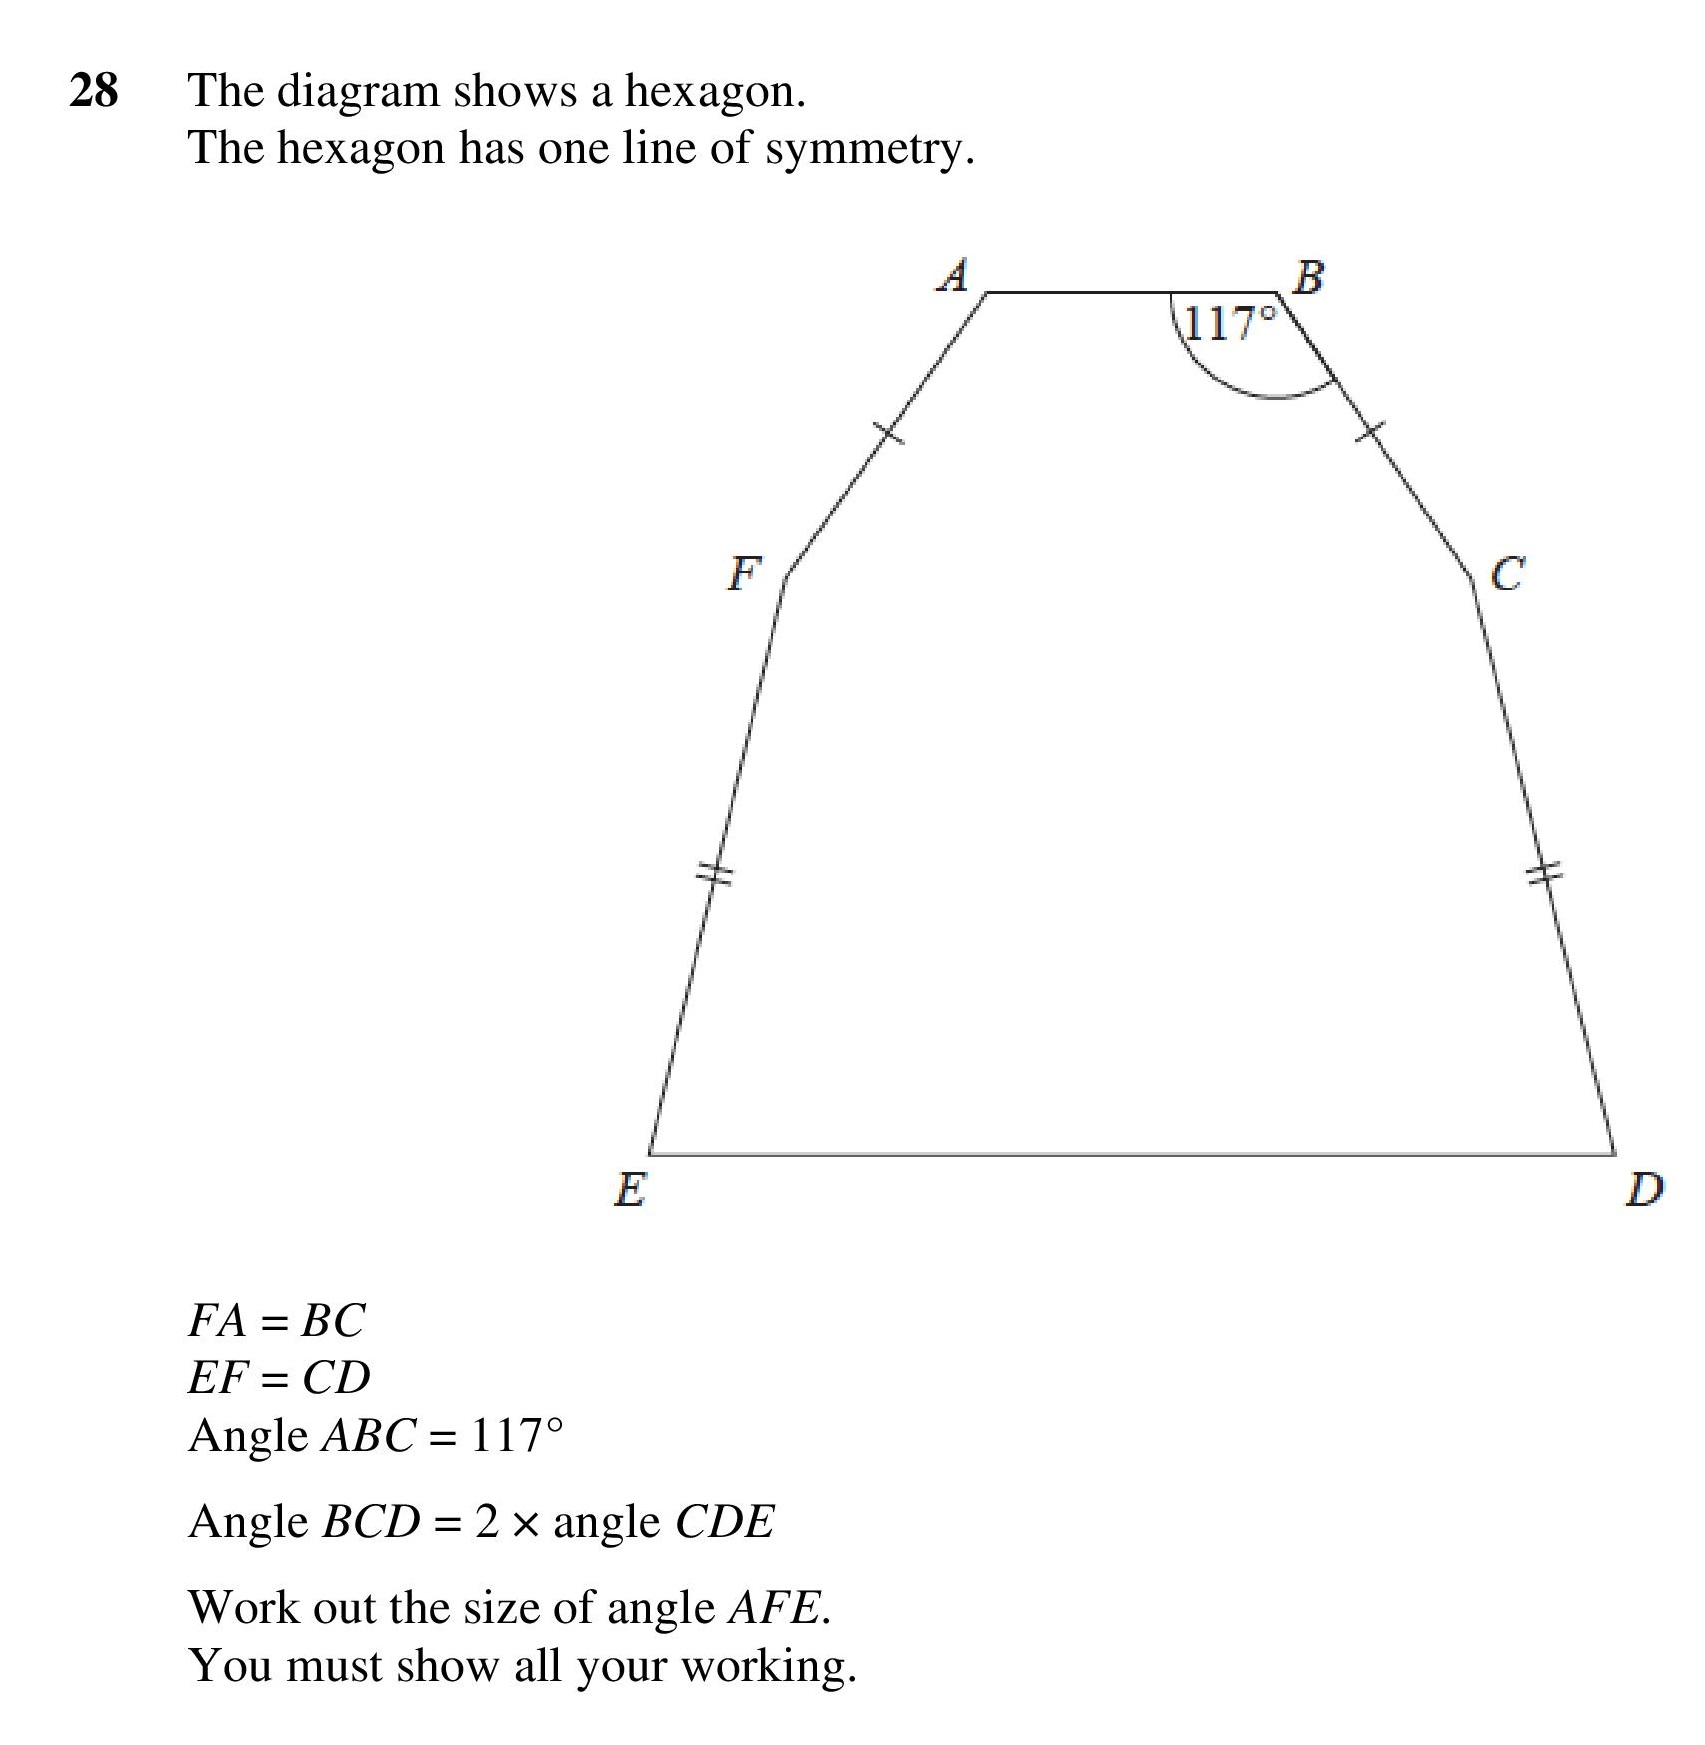
| Irregular Polygons | 1 | 4 | 0.25 | 0.05 | 0.2 | |
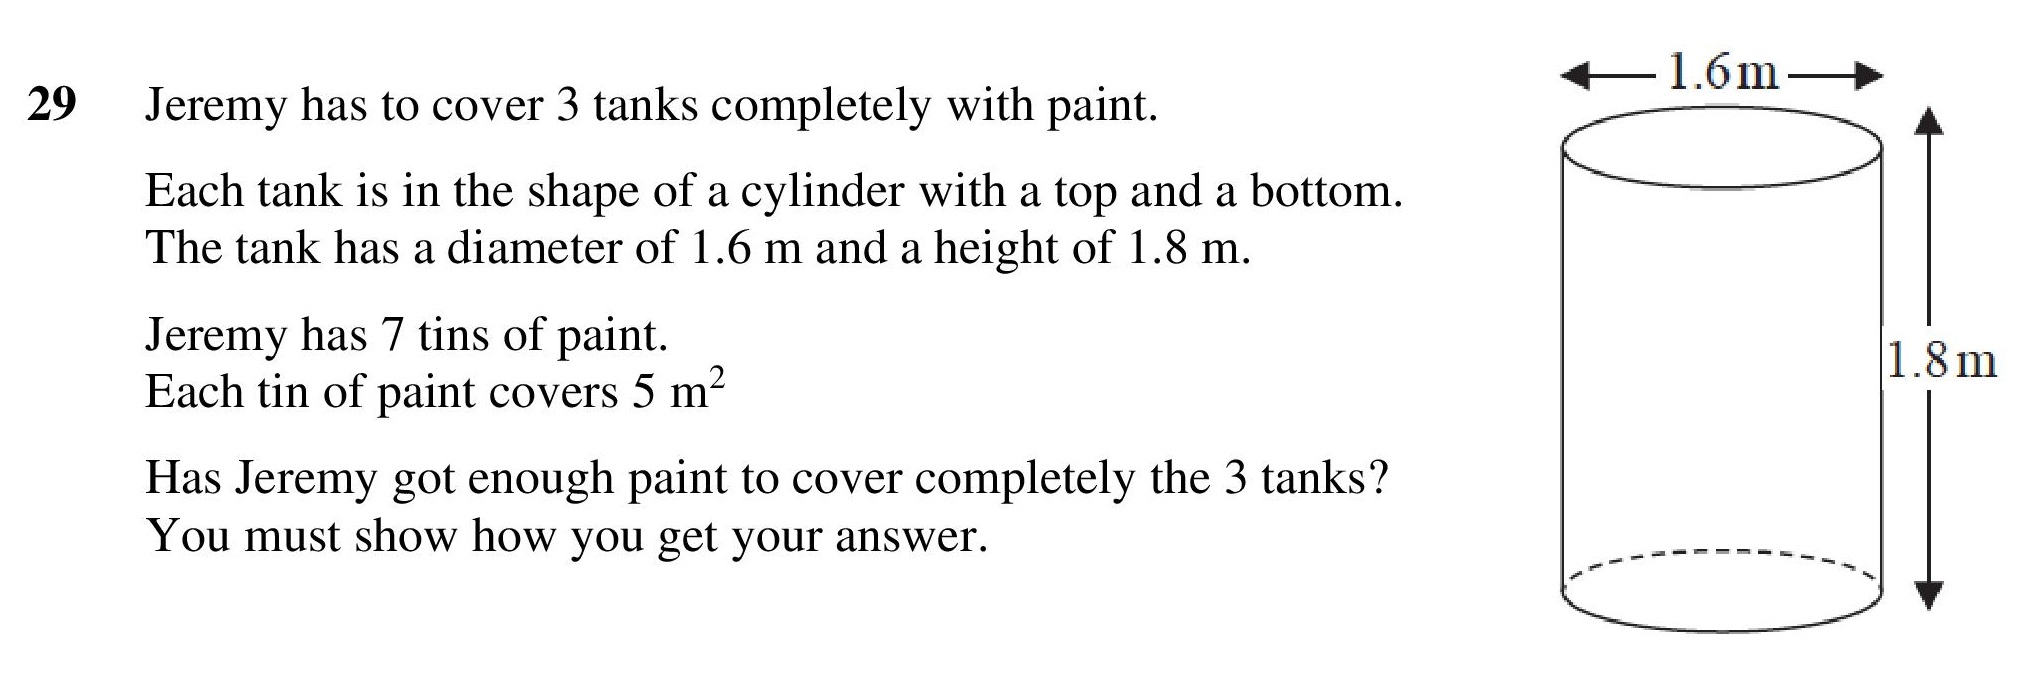
| Functional Surface area | 3 | 5 | 0.3 | 0.04 | 0.26 | |
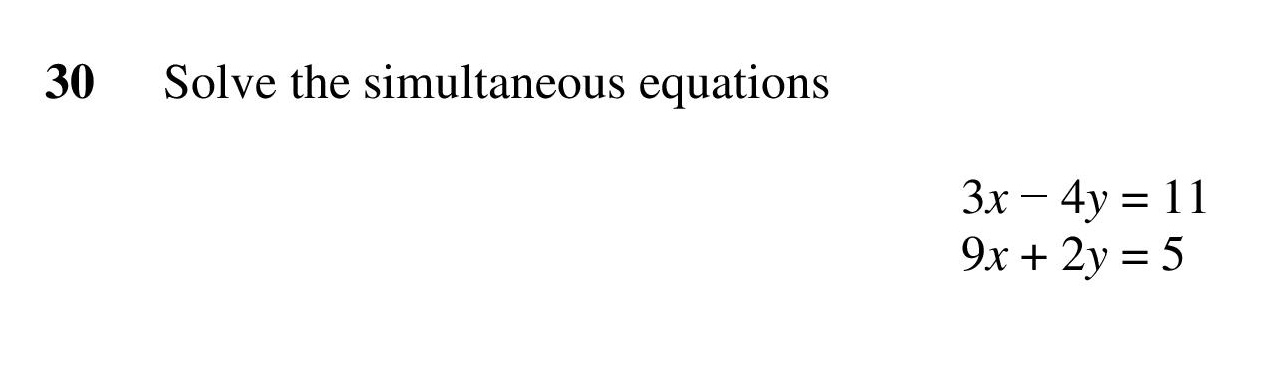
| Simultaneous Equations | 1 | 3 | 0.33 | 0.16 | 0.17 |